Evaluation of Aimhigher:
Excellence Challenge
Longitudinal Pupil Analysis Report
Marian Morris and Simon Rutt
National Foundation for Educational Research
Evaluation of Aimhigher:
Excellence Challenge
Longitudinal Pupil Analysis Report
Marian Morris and Simon Rutt
National Foundation for Educational Research
The views expressed in this report are the authors’ and do not necessarily reflect those of the Department for Education and Skills.
© NFER Trading Ltd 2006 ISBN 978 1 84478 846 0
page
Executive summary i
1. Introduction 1
2. Data overview 5
2.1 Which pupils were included? 5
2.2 How representative is the sample? 8
2.3 The analysis 9
3. Profile of the cohorts 13
3.1 Background characteristics 14
3.2 The cohorts in Aimhigher: Excellence Challenge 16
4. The impact of Aimhigher: Excellence Challenge 21
4.1 The analysis 21
4.2 The impact of Aimhigher: Excellence Challenge on attainment 23
4.3 In summary 35
5. Reflections 37
5.1 In conclusion 39
Appendix 1 41
Appendix 2 43
Appendix 3 47
Appendix 4 75
Executive summary
Executive summary
Aimhigher: Excellence Challenge (initially known as Excellence Challenge) was specifically established by the Department for Education and Skills (DfES) in 2001, with the aim of increasing the number of young people from disadvantaged backgrounds who had the qualifications and aspirations necessary to enter higher education. In August 2004 the programme was further extended through integration with the Aimhigher: Partnership for Progression (P4P) programme that had been run by the Higher Education Funding Council for England (HEFCE) and the Learning and Skills Council (LSC). The unified programme, known as Aimhigher and managed by HEFCE on behalf of the LSC and DfES, covers the whole of England and operates at three levels: national, regional and local.
This report is one of a series of evaluation reports, compiled during a multifaceted evaluation commissioned by the DfES from a consortium comprising the National Foundation for Educational Research, the London School of Economics and the Institute for Fiscal Studies. The evaluation adopted an integrated, mixed methodology strategy, incorporating wide-ranging surveys (of young people in compulsory education, post-16 destinations and post-18 destinations, including higher education), interview programmes (in Aimhigher: Excellence Challenge partnerships, schools, colleges and higher education institutions) and detailed area case studies (in ten selected partnerships).
This report draws specifically on the analysis of data that was collected, over three academic years (2001/02, 2002/03 and 2003/04), from 24,485 young people in Year 11. These figures include data from 19,434 young people in Year 11 in the ‘treatment’ schools and 5,051 who were enrolled in comparison schools.
Key findings
In summary, once all background characteristics at school and pupil level had been controlled for, statistically significant associations were identified between a number of policy interventions, pupil attainment and pupil aspirations.
Higher than expected levels of attainment were associated with the following interventions:
! capped eight GCSE score (an additional 0.72 GCSE points or just under one grade at GCSE);
• Designation as a member of the gifted and talented cohort was associated with higher levels of attainment in terms of:
! capped eight GCSE score (an additional 3.52 GCSE points);
! an increased likelihood of achieving five of more A* to C grades at GCSE – young people in the gifted and talented cohort were more than twice as likely to have achieved such grades as young people with the same background characteristics who were not so designated.
There appeared to be a significant association with visits to university during their final year in compulsory education and young people changing their mind between Year 9 and Year 11 and deciding to look for consider higher education. Young people who had taken part in such visits were nearly twice as likely to have changed their minds about participating post-18.
Discussions about university life with university undergraduates and lecturers and similar discussions with their family and friends were also associated with increased probabilities of thinking about a university course (by a factor of one and one third and one and two thirds, respectively).
Aims of the study
The analysis conducted for this report aimed to address some key research questions about the extent to which Aimhigher: Excellence Challenge had made an impact on young people's attainment and on their aspirations towards obtaining a place in higher education.
Methods
The analysis reported in this paper drew on data from young people in Year 11 in 2001/02, 2002/03 and 2003/04, matched to PLASC (the Pupil Level Annual Schools Census) and the National Pupil Database NPD and to questionnaire data and other information from young people’s teachers and their schools’ senior management teams. Earlier data, collected from the 2003/04 Year 11 cohort when they were in Year 9 (2001/02) was also incorporated.
Executive summary
Profile of the Cohorts
As identified in earlier reports from this study, the profile of the Aimhigher: Excellence Challenge cohorts was not identical to those of all young people nationally. The young people were from schools predominantly located in metropolitan areas and, compared with all schools nationally, had higher proportions of pupils who were entitled to Free School Meals; who spoke a first language other than English and had lower mean levels of aggregated attainment: few of the young people responding to the surveys came from high performing schools.
The participating Year 11 cohorts in 2001/02, 2002/03 and 2003/04, however, were largely similar in relation to their background circumstances, particularly in terms of young people’s socio-economic circumstances, the percentage with special educational needs and the proportion of young people who had been excluded for a fixed term during the previous academic year.
As part of the Aimhigher: Excellence Challenge policy, two specific cohorts of young people have been identified by partnerships. The first of these included young people designated as part of the widening participation cohort; that is, those who were in learning (whether pre- or post-16) who had the ability to progress to higher education, but who came from disadvantaged backgrounds without any history of higher education. Nine per cent of the young people in the Year 11 cohorts in the study were identified as part of the widening participation group in their school.
The targeting strategies adopted across the various schools and partnerships appears to have ensured a degree of equity for this strategy, with similar proportions of boys and girls (9% of the year group in each case) being included in the cohort and no significant differences in the level of representation between young people from different minority ethnic groups.
Unlike the profile of the widening participation cohort, the picture within the gifted and talented cohort demonstrated some significant variations in relation to minority ethnic groups. Even when prior attainment was taken into account, the probability of a young person from an Indian background being designated as gifted and talented was significantly lower than the probability for a young person from any other ethnic group. Pupils from Black Caribbean, Black African and Black other groups were more likely than pupils from white UK or other backgrounds to be so designated.
It is possible for young people to be identified in both groups (both pre- and post-16 and 20% of the young people in the widening participation cohort were also identified as gifted and talented.
Once all background characteristics at school and pupil level had been included in the analysis, along with information on young people's experiences of Aimhigher: Excellence Challenge activities, associations were identified between the following policy interventions and higher attainment at Key Stage 4 across all three Year 11 cohorts:
• Designation as a member of the widening participation cohort was associated with higher levels of attainment in terms of:
! capped eight GCSE score (an additional 0.72 GCSE points or just under one grade at GCSE);
• Designation as a member of the gifted and talented cohort was associated with higher levels of attainment in terms of:
! capped eight GCSE score (an additional 3.52 GCSE points);
! an increased likelihood of achieving five of more A* to C grades at GCSE – young people in the gifted and talented cohort were more than twice as likely to have achieved such grades as young people with the same background characteristics who were not so designated.
This story is not quite as straightforward as the initial analyses (nor the analyses in previous years) may have suggested, however:
• While young people in both widening participation and gifted and talented cohorts across the three cohorts consistently achieved higher capped eight GCSE scores than their peers with the same background characteristics, only those in the gifted and talented cohort appeared to have a greater likelihood of achieving five or more GCSEs.
Executive summary
• Amongst young people in the 2004 Year 11 cohort, there was an association between being in the gifted and talented cohort when in Year 9 (2002), or in the gifted and talented cohort when in Year 11 (2004), and higher capped eight scores and an increased probability of achieving five or more GCSEs at grades A* to C. No such association emerged for the widening participation cohort in the longitudinal analysis.
• Amongst young people in the longitudinal cohort, however, visits to higher education institutions and discussions with university staff and undergraduates (both potentially Aimhigher: Excellence Challenge-related activity and open to widening participation pupils) were associated with both higher capped eight scores and higher probabilities of achieving five or more good GCSEs. It should be noted that these activities were often open to gifted and talented as well as to widening participation pupils. • The role of the school, in encouraging young people to consider higher
education, was also associated with higher capped eight scores in the cross-sectional analysis, but did not emerge as significant during the longitudinal analyses. Indeed, the statistical analyses identified few school level variables as significantly related to pupil attainment, suggesting that it is the experience of each individual pupil and the circumstances and educational outlooks of each pupil, rather than the school type (age range, size, management type) that has the most significant impact on attainment.
The Impact of Aimhigher: Excellence Challenge on Pupil Attitudes
Overall, young people from schools in Aimhigher: Excellence Challenge areas tended to display less positive attitudes to learning than the young people in the comparison cohorts, even though their (self-reported) behaviour was good. This was in direct contrast to the gifted and talented cohorts who were significantly associated only with those who had both a good attitude and good behaviour. This suggests that Aimhigher: Excellence Challenge may have successfully sought out young people who, as yet, may not have a positive attitude to learning or to the possibility of continuing in learning, even though their ostensible behaviour in school may be good. There was no association, however, with young people who had a good attitude but poor behaviour, raising the question as to whether it was low prior attainment or poor behaviour (in school at least) that may have precluded young people’s designation to the widening participation group.
The analysis suggested that some Aimhigher: Excellence Challenge activities appeared to be more associated with positive attitudes, while others were more associated with good behaviour.
• Visits to university and being in schools in which the value of a university education was discussed appeared to be associated with positive attitudes amongst pupils (whether behaviour was good or bad);
Talking to undergraduates and talking to university staff were also associated with pupils with good attitudes and behaviour, though not with those with poor attitudes though good behaviour, even though a proportion of young people in this group took part in such activities (13.6% spoke to undergraduates and 22.4% to higher education staff). This raises a number of questions: are such discussions always motivational, or are they effective only when attitudes are already good?
It should be noted that, from the cross-sectional analysis, causal effect cannot be imputed and, indeed, the longitudinal analysis proved inconclusive. While there were associations with a range of school variables (including teachers being seen by pupils as treating them with respect and teachers encouraging young people to do the things at which they were good) parental input (including making sure young people did their homework and encouraging them to stay in education beyond 16) had a bigger impact on attitudes to learning. Nonetheless, an aspiration to go to university was, arguably, the biggest single factor associated with positive changes in attitude over time. To what extent, therefore, has Aimhigher: Excellence Challenge had an impact on young people’s aspirations?
The impact of Aimhigher: Excellence Challenge on pupil aspirations
Not surprisingly, across the three Year 11 cohorts, the strongest associations with intentions to enter higher education were with pupil level variables, such as parents educated to at least degree level, being a girl and having a greater number of books in the home. Young people who spoke a first language other than English had a higher probability of signalling this intention, while those from white UK backgrounds were only half as likely as other pupils with the same characteristics and prior attainment to suggest they might go to university. Parental support, with parents praising good work and making it clear that they considered education important, was also a significant factor.
Nonetheless, policy-related activities also appeared to be strongly associated with young people’s aspirations. Teachers talking about the value of university, visits to higher education institutions, and talking with undergraduates, university lecturers and Personal Advisers, were all linked to a stated intention to take up a university place. Are such visits and discussions associated with young people who were already considering such a pathway, or have they significantly influenced young people’s decision-making?
Executive summary
completion and attendance. There was also a higher likelihood that they enjoyed school and came from families where they thought education was valued. Crucially for the Aimhigher: Excellence Challenge policy, however, young people’s change of mind appeared to be associated with visits to university during their final year in compulsory education (though only 13% had taken up such an opportunity); young people who had taken part in such visits were nearly twice as likely to have changed their minds about participating post-18. Discussions about university life with university undergraduates and lecturers and similar discussions with their family and friends were associated with increased probabilities of thinking about a university course.
In conclusion: The impact of Aimhigher: Excellence Challenge
The story that emerges with respect to the impact of Aimhigher: Excellence Challenge is, not surprisingly, somewhat complex. While a number of associations between policy inputs and pupil outcomes exist across the three Year 11 cohorts, the role of Aimhigher: Excellence Challenge in significantly influencing young people’s attainment, attitudes and aspirations over time is harder to identify. Nonetheless, there are indications that:
• There are associations between some Aimhigher: Excellence Challenge interventions and improvements in young people’s attainment between Key Stage 3 and Key Stage 4. Whilst designation to the widening participation cohort was not specifically associated with longitudinal change, visits to higher education institutions and discussions with staff and undergraduates were associated with higher levels of attainment at Key Stage 4, including the probability of attaining five or more GCSEs at grades A* to C.
• Taking part in visits to higher education institutions and discussions with staff and undergraduates were associated with a higher probability of changing a negative decision about higher education into a positive one. There is no clear indication, however, that it necessarily contributed to a sustained decision to follow such a path.
Introduction
1. Introduction
Participation rates in higher education appear to have increased significantly over the last decade, with participation by young people in full-time higher education (including sandwich courses), as measured by the Age Participation Index (API),1 rising from 19% in 1990/91 to 35% in 2001/02, an increase of 16 percentage points (DfES, 2004a).2 More recently, and in order to measure progress towards the Government’s 50% target for participation amongst people aged 17 to 30, the API was replaced by the Higher Education Initial Participation Index (HEIPR). This also demonstrates an increase (though not as dramatic) in participation over the period from 1990/00 (41% participation) to 2002/03 (43%). However, recent data from HESA, and published by the DfES, shows that the provisional Higher Education Initial Participation Index (HEIPR) for 2003/2004 remains at 43%, suggesting that there has been no increase in participation rates since 2002/2003 (DfES, 2005a).3
There is, nonetheless, an indication of differential rises in the rate of participation, with rates of entry to higher education rising at a greater rate amongst women than amongst men. The provisional rate of participation for females in 2003/04, for example, was 47%, a four percentage point increase since 1999/2000, while that amongst men was 38%, the same rate as in 2000/2001 and showing a decrease of one percentage point from 2002/2003. Such differences in participation rates are also evident between other groups of young people, as highlighted in the analysis of the fourth sweep of the eleventh Youth Cohort Survey in 2005 (DfES, 2005b).
1
The Age Participation Index (API) measured the number of home domiciled young (aged under 21) initial entrants to full-time and sandwich undergraduate courses, expressed as a proportion of the average 18 to 19 year old Great Britain population. The DfES, in measuring progress towards targets, previously used the IER (Initial Entry Rate) which summed ‘the percentages of the age group who enter Higher Education for the first time in each year of age between 18 and 30’ http://www.dfes.gov.uk/psa2002/TechnicalNotesFinalPSA.rtf. This was replaced by the Higher Education Participation Index (HEIPR), which gave a clearer measure of participation and included those who were not included in the API; that is, part-time students and those that participate in higher education for the first time aged 21-30. The HEIPR has been compiled for students aged 17-30 domiciled in England in full or part-time higher education in the UK and is now being used to measure progress towards the Government’s 50% target for experience of higher education.
2
Department for Education and Skills (2004). 4.6: Participation in Higher Education [online]. Available:
http://www.dfes.gov.uk/trends/index.cfm?fuseaction=home.showIndicator&cid=4&iid=23 [December 2005]
3
The rates quoted here are for UK domiciled young people studying in English universities only. The HESA data upon which the figures are based omits young people studying in Scotland, Wales, Northern Ireland or overseas. Department for Education and Skills (2005a) Participation Rates in Higher Education: Academic Years 1999/2000 - 2003/2004 (Provisional) (Statistical First Release 14/2005) [online]. Available
This analysis suggested that, of the respondents to the survey, participation in higher education was greater, for instance, amongst young people from higher professional backgrounds than amongst those whose parents were in lower supervisory and routine occupations (59% compared to 16% and 19% respectively).4 In part, this was because such young people were more likely to have achieved higher qualifications at the end of Year 11 and at age 18, significant indicators of subsequent participation rates.5 Eighty-nine per cent of survey respondents from professional backgrounds achieved a level 2 qualification, compared with 62% of those whose parents were in lower supervisory occupations and 64% of those who were in routine occupations. Seventy two per cent of the young people from professional backgrounds achieved a level 3 qualification, compared with 32% of those whose parents were in lower supervisory occupations and 31% of those who were in routine occupations.
However, this also brings into focus one of the main issues facing the Government in its efforts to widen participation in higher education amongst young people from families with no such tradition. In this cohort (all of whom were aged 19 in the spring of 2005) around half of the young people who had appropriate qualifications but who came from routine occupation backgrounds, for example, had not progressed to higher education. This echoes the findings from Gilchrist et al. (2004) who noted that, while nearly 90% of young people from social classes I and II who have appropriate entry qualifications at age 21 achieve higher education qualifications by the age of 30, the proportion of qualified young people from social classes III (non-manual) to V (unskilled) achieving such higher education qualifications by the same age is significantly lower.6 The figures for young people from such backgrounds ranged from 36% for social class III (non-manual) down to 18% for social classes III (manual) and V (unskilled).
Aimhigher: Excellence Challenge (initially known as Excellence Challenge) was specifically established by the Department for Education and Skills (DfES) in 2001, with the aim of increasing the number of young people from disadvantaged backgrounds who had the qualifications and aspirations necessary to enter higher education. Following the publication of the Government’s White Paper, ‘The Future of Higher Education’ (DfES, 2003),7 funding for the initiative was guaranteed up to 2006 and new areas (Phase 3
4
Department for Education and Skills (2005b) Youth Cohort Study: The Activities and Experiences of 19 Year Olds: England and Wales 2005 (Statistical First Release 49/2005) [online]. Available http://www.dfes.gov.uk/rsgateway/DB/SFR/s000613/SFR49-2005.pdf
5 Three quarters of the young people in the cohort who gained eight or more GCSEs at grades A* to
C in Year 11, for example, were still in full time education at aged 19.
6
Gilchrist, R., Phillips, D. and Ross, A. (2002). ‘Participation and potential participation in UK higher education.’ In: Archer, L., Hutchings, M. and Ross, A. (2002) Higher Education and Social Class. London: RoutledgeFalmer.
7
Introduction
EiC areas and those established Excellence Clusters that were still outwith the policy) were incorporated. In August 2004 the programme was further extended through integration with the Aimhigher: Partnership for Progression (P4P) programme that had been run by the Higher Education Funding Council for England (HEFCE) and the Learning and Skills Council (LSC). The unified programme, known as Aimhigher and managed by HEFCE on behalf of the LSC and DfES, covers the whole of England and operates at three levels: national, regional and local.
Previous research suggested that a lack of information about higher education opportunities (which was thought to be more evident amongst families that had no history of higher level study), as well as social and financial concerns, played a part in reduced levels of applications from young people from lower social class groups (Connors et al 2001).8 Aimhigher: Excellence Challenge sought to address some of these issues through, for instance, the provision of pertinent information, targeted student-centred and school or college-centred activities and an element of financial support. These were intended to improve motivation, raise aspirations and assist transition to further and higher education.
To what extent has it succeeded in its aim of raising aspirations amongst young people from groups with traditionally low rates of participation? This report explores this question, using data obtained from 24,485 young people and their schools both in and outwith Aimhigher: Excellence Challenge areas.9 It is one of a series of evaluation reports,10 compiled during a multifaceted evaluation commissioned by the DfES from a consortium comprising the National Foundation for Educational Research, the London School of Economics and the Institute for Fiscal Studies. The evaluation adopted an integrated, mixed methodology strategy, incorporating wide-ranging surveys
(of young people in compulsory education, post-16 destinations and post-18 destinations, including higher education), interview programmes (in Aimhigher: Excellence Challenge partnerships, schools, colleges and higher education institutions) and detailed area case studies (in ten selected partnerships).11 The analysis that has been undertaken includes techniques to ascertain aspects both of the educational impact and the economic
8
See, for example Connor, H. and Dewson, S. with Tyers, C., Eccles, J., Regan, J. and Aston, J. (2001). Social Class and Higher Education: Issues Affecting Decisions on Participation by Lower Social Class Groups (DfEE Research Report 267). Sheffield: DfEE.
9
Questionnaire data was received from nearly 37,000 young people in Year 11, but some of this data could not be included in some of the detailed statistical analyses outlined in this report, either because young people’s schools did not return their senior manager and teacher questionnaires (this was the reason for the omission of pupil data in the majority of cases) or because a match could not be made to PLASC data for that young person.
10
A full list of all of the reports that have been produced since the evaluation began in 2001 is included in Appendix 4.
11
effectiveness of the Aimhigher: Excellence Challenge policy. This report focuses on the educational impact of the programme.
The report begins with an overview, in Chapter 2, of the datasets included in the analysis, before providing a profile of the responding cohorts in Chapter 3. This profile outlines a range of background factors (such as sex, ethnic background, socio-economic and family variables) and attainment at Key Stages 3 and 4 (split by pupil background characteristics and school characteristics). Chapter 4 explores the relationship between attainment, attitude, aspirations and educational interventions, taking into account background variables at pupil and school level. It presents the findings from a series of multilevel cross-sectional and longitudinal models. For pupils in Year 11, these include multilevel models that examine the relationship between interventions and best (or capped) eight GCSE scores, and logistic multilevel models examining the probability of a young person achieving five or more GCSEs at A* to C. It also includes models exploring the relationship between policy-related interventions and young people’s attitudes to learning, young people’s behaviour and young people’s aspirations to higher education.
Data overview
2. Data
overview
The data that contributed to this report was collected as part of a large-scale longitudinal study of young people aged 13-19 in schools and colleges both in Aimhigher: Excellence Challenge partnerships (the treatment group) and in non-Aimhigher: Excellence Challenge schools (the comparison group). Over the period of the study, schools in the treatment group became incorporated into the comparison group as the policy was extended, a factor that the statistical techniques that were adopted for the study had to take into account. Figure 2.1 shows the structure of the treatment and comparison groups and of the six cohorts that took part in the evaluation.
2.1 Which pupils were included?
Schools in Phase 1 and 2 of Excellence in Cities (EiC)12 and those in non-EiC Education Action Zones (EAZs)13 were incorporated into Aimhigher: Excellence Challenge from the outset and so young people from these schools comprised the treatment group (see Figure 2.1). Schools in Phase 3 EiC areas were initially outwith the initiative and so pupils formed the comparison group, along with those in a further group of schools (not in EIC or EAZ areas) who constituted a comparison group for the evaluation of EiC; this latter group were included in Cohort 2 only – those who were in Year 9 in 2001/02. However, in September 2003, Phase 3 EiC areas were incorporated into Aimhigher: Excellence Challenge and so became part of the treatment rather than the comparison group. As a result, the young people who were in Cohort 1 (those in Year 8 in 2001/02) in the comparison schools became exposed to Aimhigher: Excellence Challenge in Year 10, while those who were in Cohort 2 (Year 9 in 2001/02) in the Phase 3 comparison schools became exposed to Aimhigher: Excellence Challenge in Year 11. The analysis reported here controlled for these changes and sought to identify any phase effects related to the point at which the school entered Aimhigher: Excellence Challenge partnerships.
12
Launched in September 1999, Excellence in Cities is one of the Government’s key policy initiatives for redressing educational disadvantage and under-performance in schools located within the most deprived urban areas of England. It has adopted a multi-strand approach to raising standards and performance and emphasises the use of locally-based partnership approaches and targeted provision. While some of the policy strands (such as Excellence Action Zones, City Learning Centres, Beacon Schools and Specialist Schools) operate at either area or whole school level, others (the Gifted and Talented Strand, Learning Support Units, and Learning Mentors) are specifically targeted at the individual student.
13
Post-16, it was rather more difficult to maintain the distinction between the treatment and the comparison groups, because young people may have left their non-Aimhigher: Excellence Challenge schools and entered FE colleges or other schools who were taking part in Aimhigher: Excellence Challenge activities. Similarly, young people who had been exposed to Aimhigher: Excellence Challenge activities pre-16, might have moved on to FE colleges or schools outwith the initiative. The analysis conducted for this group (not described in this paper) sought to identify the impact of young people’s self-reported experiences, pre- and post-16, of Aimhigher: Excellence Challenge related activities on their aspirations and intentions.
This report draws specifically on the analysis of data that was collected, over three academic years (2001/02, 2002/03 and 2003/04), from 24,485 young people in Year 11.14 These figures include data from 19,434 young people in Year 11 in the ‘treatment’ schools and 5,051 who were enrolled in comparison schools. A breakdown of the number of responses, by year and from treatment and comparison schools, is provided in Appendix 1.
14
Data overview
[image:20.612.65.737.110.502.2]7
Figure 2.1 The structure of the treatment and comparison groups in each of the cohorts in the evaluation
2001/02 2002/03 2003/04
Treatment Comparison Treatment Comparison Treatment Comparison
Cohort 1 8
Phase 1 and 2 EiC and non-EiC EAZs
8
Phase 3 EiC
9
Phase 1 and 2 EiC and non-EiC EAZs
9
Phase 3 EiC
10
Phase 1 and 2 EiC and non-EiC EAZs
10
None
Cohort 2 9
Phase 1 and 2 EiC and non-EiC EAZs
9
Phase 3 EiC
10
Phase 1 and 2 EiC and non-EiC EAZs
10
Phase 3 EiC
11
Phase 1 and 2 EiC and non-EiC EAZs
11
None
Cohort 3 10
Phase 1 and 2 EiC and non-EiC EAZs
10
Phase 3 EiC plus EiC comparison
11
Phase 1 and 2 EiC and non-EiC EAZs
11
Phase 3 EiC plus EiC comparison
12
Phase 1 and 2 EiC and non-EiC EAZs
12
EiC comparison only
Cohort 4 11
Phase 1 and 2 EiC and non-EiC EAZs
11
Phase 3 EiC
12
Phase 1 and 2 EiC and non-EiC EAZs
12
[Phase 3 EiC]
13
Phase 1 and 2 EiC and non-EiC EAZs
13
None
EiC cohort 1
12
Phase 1 and 2 EiC and non-EiC EAZs
12
[Phase 3 EiC]
Post-18
Phase 1 and 2 EiC and non-EiC EAZs
None Aimhigher: Excellence Challenge baseline 13
Phase 1 and 2 EiC and non-EiC EAZs
None
2.2 How
representative is the sample?
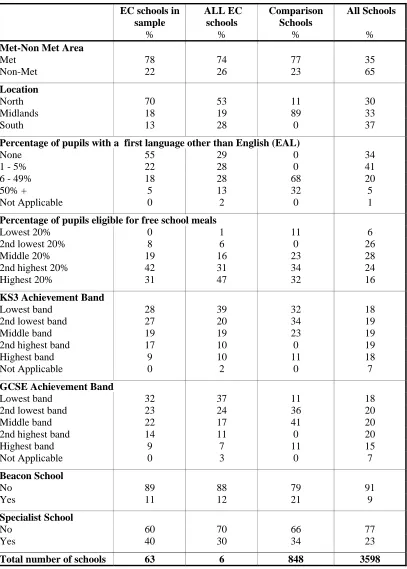
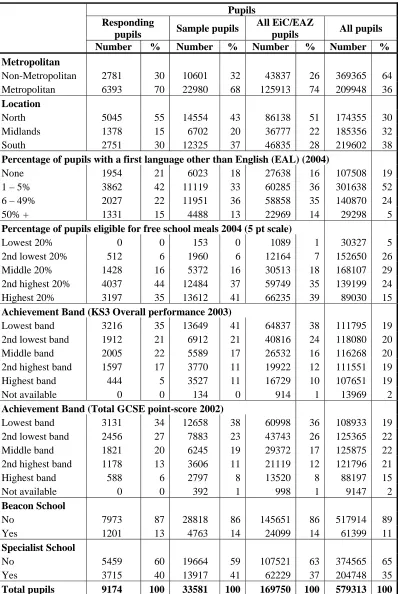
Given that the areas in which Aimhigher: Excellence Challenge was implemented were primarily those with high levels of socio-economic and educational disadvantage, it is not surprising that the profile of the young people in the Aimhigher: Excellence Challenge cohorts are not identical to those of all young people nationally. Young people were from schools predominantly located in metropolitan areas: 74% of all Year 11 Aimhigher: Excellence Challenge pupils (and 70% of the respondents), for instance, were from such schools, compared with only 36% of all pupils nationally. In 2003/04, and compared with non-Aimhigher: Excellence Challenge schools, for example, they had:
• higher proportions of pupils who were entitled to Free School Meals: 39% of the Aimhigher: Excellence Challenge schools were in the top quintile of pupil eligibility, compared with 15% of all schools
• higher proportions of pupils who spoke a first language other than English: 14% of the Aimhigher: Excellence Challenge Year 11 cohorts, compared with five per cent nationally, were in schools where more than 50% of the population are identified as such speakers.15
• generally lower mean levels of aggregated attainment: only 10% of the Aimhigher: Excellence Challenge schools were in the highest band of achievement at Key Stage 3, compared with 19% of schools nationally, while 38% of the Aimhigher: Excellence Challenge schools were in the lowest band, in contrast with only 19% of non-Aimhigher: Excellence Challenge schools. The picture is similar at Key Stage 4, with eight per cent of Aimhigher: Excellence Challenge schools in the highest band of achievement, compared with 15% of schools nationally, and 36% were in the lowest band, in comparison with 19% of non-Aimhigher: Excellence Challenge schools.
Tables1 to 3 in Appendix 2 provide a picture of the representativeness of the young people (in Year 11) who responded to the surveys in 2001/02, 2002/03 and 2003/04 compared with all pupils in these cohorts in England. From this data it is evident that young people responding to this survey are broadly representative of all young people in Aimhigher: Excellence Challenge schools, and, as outlined above, include a higher proportion of young people from disadvantaged and low performing schools than would be expected were one to look at all secondary schools nationally. However, it should be noted that the most disadvantaged and lowest performing schools in Aimhigher areas may not be fully represented. At the time when the surveys were conducted, some of these schools were already the subject of intense scrutiny, from Ofsted, from local authorities and from the evaluation of other initiatives (such
15
Data overview
as the DfES commissioned study into schools in extremely challenging circumstances), and proved to be the hardest group to recruit to the evaluation.
2.3 The
analysis
As in earlier analyses (see Morris et al., 2005) individual pupil-level data was used to provide descriptive statistics and to facilitate more complex multilevel analyses, in order to address some key research questions. These included:
• What is the general pattern of attainment amongst different groups of pupils? Are these differences still evident once young people’s background characteristics are taken into consideration?
• Are there any differences in young people’s attitudes to education and aspirations between different groups of pupils?
• To what extent are there any variations in performance between young people, with the same background characteristics, in Aimhigher: Excellence Challenge schools and those in comparison schools?
• What is the relationship (if any) between Aimhigher: Excellence Challenge interventions and attainment and/or attitudes and aspirations, once individual pupil and school characteristics and pupil prior attainment are taken into account?
• Is it possible to identify the particular impact of any specific Aimhigher: Excellence Challenge interventions on attainment and/or attitudes and aspirations?
Data from the young people’s questionnaires was matched to PLASC (the Pupil Level Annual Schools Census) and the National Pupil Database NPD,16 in order to obtain background characteristics (sex, ethnicity, special educational needs, in receipt of Free School Meals or level of fluency, for example) and levels of attainment (prior attainment and end of Key Stage data or GCSEs, as appropriate).17 Individual pupil information obtained from the schools (such as a young person’s designation as gifted and talented or as a member of the widening participation cohort) was also matched to the survey data, as was questionnaire data from young people’s teachers and their schools’ senior management teams.
In order to be included in the multilevel modelling process, all relevant background data (at pupil and school level) needed to be available.18 At each stage of the analysis, a decision was made as to whether young people for
16
This included prior attainment (at Key Stage 2 or 3, as appropriate) and, in the case of young people in Years 9 and 11, attainment at the end of the Key Stage.
17
It should be noted that the attainment data for the Year 11 cohort does not include data from NISVQ, as no agreement had been reached about equivalency measures between GCSE and NVQ level 1 qualifications for the 2001/02 cohort.
18
whom the relevant individual data item was missing (such as number of books in the home or prior attainment at Key Stage 3) should be assigned to the mean for that variable or omitted from the analysis.19 This means that the number of young people for whom the various models were constructed is therefore lower than the number for whom the basic descriptive statistics were derived. However, as Tables 2.1 and 2.2 indicate, the numbers of pupils in each of the cross-sectional and longitudinal models is sufficiently large to enable the research team to have confidence in the reliability of the findings.
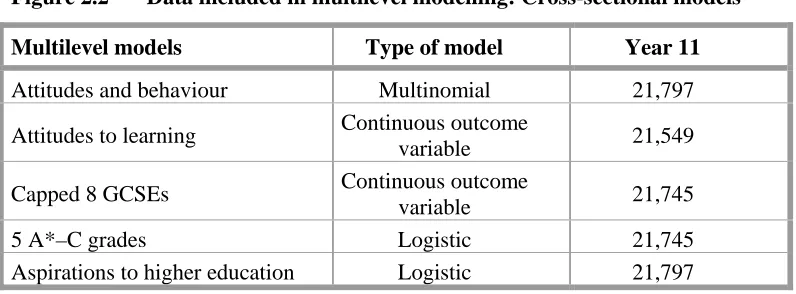
Figure 2.2 provides an overview of the numbers of young people included in each of the various cross-sectional attainment and attitude models. The models were constructed to measure the relationship between policy-related activities and outcomes at the end of Year 11, focusing, in particular, on GCSE attainment, on attitudes and behaviour and on aspirations to higher education.
Figure 2.2 Data included in multilevel modelling: Cross-sectional models
Multilevel models Type of model Year 11
Attitudes and behaviour Multinomial 21,797
Attitudes to learning Continuous outcome
variable 21,549
Capped 8 GCSEs Continuous outcome
variable 21,745
5 A*–C grades Logistic 21,745
Aspirations to higher education Logistic 21,797
Using a cross-sectional approach to the analysis enables an exploration of any differences between cohorts in different years. Are the attainment and attitudinal outcomes for young people in Year 11, for example, associated with the same demographics (background variables and socio-economic characteristics) in each cohort, or is there any indication that the impact of demographics may be different between cohorts or between those in Aimhigher: Excellence Challenge schools and those in comparison schools? Is there any suggestion that particular Aimhigher: Excellence Challenge activities may have been associated with young people's aspirational outcomes across all Year 11 three cohorts (see Figure 2.1), for instance, or does such an association appear to be evident for only one of the cohorts?
19
Data overview
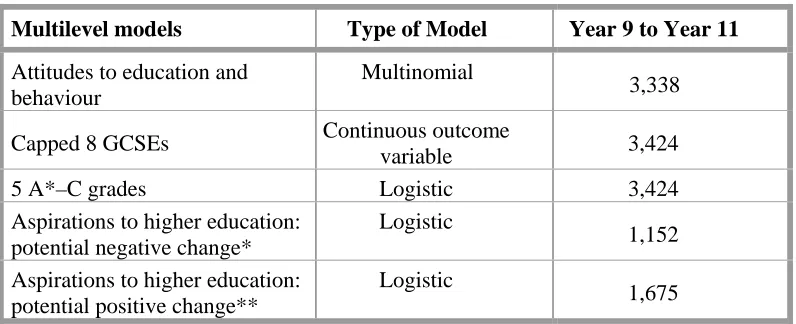
The study also sought to examine the impact of Aimhigher: Excellence Challenge on changes to young people's attainment, attitudes and aspirations within cohorts, however. Is there any evidence to suggest that taking part in widening participation activities from Year 9 has had an impact on young people's changed aspirations to take up a place in higher education for instance? In order to address such questions, a different analytical approach, using longitudinal models, was adopted. Figure2.2 provides an overview of the numbers of young people included in each of the various longitudinal
[image:24.612.105.503.300.462.2]attainment, attitudinal and aspiration models. These were constructed using data from Cohort 2 - the 2001/02 Year 9 cohort who were in Year 11 in 2003/04 (see Figure 2.1). In order to maximise the number of pupils upon which the longitudinal analysis could draw, these models included pupil level and school level data (from the NFER’s Register of Schools) and did not draw on the data from teacher or school questionnaires.
Table 2.2 Data included in multilevel modelling: Longitudinal models
Multilevel models Type of Model Year 9 to Year 11
Attitudes to education and behaviour
Multinomial
3,338
Capped 8 GCSEs Continuous outcome
variable 3,424
5 A*–C grades Logistic 3,424
Aspirations to higher education: potential negative change*
Logistic
1,152
Aspirations to higher education: potential positive change**
Logistic
1,675
*This analysis was conducted for a sub-set of the data; young people who had made a positive decision towards higher education in Year 9 and who had either maintained that choice or had changed their mind between Year 9 and Year 11.
**This analysis was conducted for a sub-set of the data; young people who had made a negative decision towards higher education in Year 9 and who had either maintained that choice or had changed their mind between Year 9 and Year 11.
Profile of the cohorts
3. Profile of the cohorts
As indicated in Chapter 2, the relative size of the cohorts from both the ‘treatment’ schools and the ‘comparison’ schools differed across the three years. While some of these changes were a result of attrition, most of the differences between the years reflect the changing reach of the policy, with young people from comparison schools becoming part of the treatment group in 2003/04.
• In 2001/02, the comparison group comprised 794 Year 11 pupils from schools in Phase 3 EiC areas (12% of the respondents in that year).
• In 2002/03, the comparison cohort in Year 11 was larger (4257, or 31% of the respondents in that year) since, alongside pupils from the Phase 3 EiC schools, it included pupils who were part of the non-EiC comparison cohort survey.
• By 2003/04, there was no comparison cohort, since Phase 3 EiC schools had been phased into the Aimhigher: Excellence Challenge initiative. The analysis uses a phase marker to ascertain whether or not there is any difference in outcomes between young people in the Phase 1 and 2 EiC schools and EAZ schools that took part in Aimhigher: Excellence Challenge from the outset and those in the Phase 3 EiC schools that entered Aimhigher: Excellence Challenge at a later date.
The Year 11 cohorts in 2001/02, 2002/03 and 2003/04 were largely similar in relation to their background circumstances, particularly in terms of young people’s socio-economic circumstances, the percentage with special educational needs and the proportion of young people who had been excluded for a fixed term during the previous academic year. While there were marginally higher proportions of female respondents to the surveys in all three years, the proportion of female respondents in 2001/02 was greater (at 52% against 47%) than in 2002/03 (48% against 47%) when there was less of a female response bias (data on sex was missing for one per cent of the cohort in 2002 and five per cent of the cohort in 2003). The percentage of young people who spoke a first language other than English was also greater in 2003/04 than in the 2002/03 cohort, which, in turn, was also greater than the 2001/02 cohort.
schools in which attainment levels were high (schools in which more than 82% of young people achieved five or more GCSEs at A* to C). What was the profile of the young people in these different schools?
3.1 Background characteristics
[image:27.612.109.503.356.510.2]Of those for whom the sex of the respondents to the surveys was known, under half (all of whom completed the questionnaires in school), were male: 47% of the Year 11 cohorts were boys. As indicated in Table 3.1, the average level of attainment of boys in the cohorts was lower at Key Stage 3 (a mean level of 4.8 for the Year 11 cohort) than that of girls (a mean level of 5.0). This difference in attainment was maintained at GCSE for the Year 11 cohort (a mean capped eight score20 of 37.3 points compared with 32.9 points for boys, for example, and an average of 5.3 A* to C grades compared with an average of 4.2 for boys).21 However, such a simple comparison fails to take account of young people’s background characteristics, home circumstances or academic progress, or of their experiences in school or through policy interventions such as Excellence Challenge/Aimhigher.
Table 3.1 Attainment of Year 11 cohorts: by sex*
Attainment levels Male Female
Average Level at Key Stage 3** 4.8 5.0
N = 10746 11,335
Total GCSE score*** 38.1 44.0
Capped 8 GCSEs 32.9 37.3
Number of A*-C grades 4.2 5.3
Number of A* to G grades 8.7 9.1
N = 10,991 11,610
Source: Matched data from National Pupil Database 2001/01, 2002/03 * Data on sex was missing for 738 pupils - 3% of the cohort
** Data on KS3 attainment was missing for 1,666 pupils – 7% of the cohort *** Data on GCSE attainment was missing for 1,146 pupils – 5% of the cohort
20 The term capped eight GCSEs is used by the DfES as an output measure and is the sum of the
point scores for an individual’s best eight GCSE (and equivalent) qualifications. By limiting each entrant’s contributory points score to eight subjects, it seeks to overcome differences between the different entry policies of schools and so allow a clearer comparison of attainment across schools.
21
Profile of the cohorts
The majority of the Year 11 pupils (70%), were from white UK backgrounds, with additional groups of young people from white other backgrounds (1.4%).22 Pakistani (4.8%) and Indian (4.4%) pupils formed the largest minority ethnic groups within the survey, while those from Black Caribbean (1.9%)and Black African (1.8%) heritage constituted a larger group than those of Bangladeshi (1.1%) or Chinese (<1%) pupils.
Overall, average levels of attainment (see Table 3.2) at the end of Year 11 were highest amongst the Chinese pupils (who attained a mean of just over grade C at GCSE and a mean of 7.1 GCSES at A* to C) and lowest amongst the Black Caribbean pupils (who attained a mean of just under grade D at GCSE and a mean of 3.7 GCSES at A* to C).
Table 3.2 Attainment by Year 11 cohorts: by Ethnicity
Pri
o
r
attainmen
t
KS3 Total GCS
E
score Capped 8 GCS
E
s
Number of A*
-C
grades Number of A*
to
G
grades Total
White UK 5.0 41.2 35.2 4.8 8.9 16,979
White other 4.8 38.2 33.6 4.5 8.6 327
Black Caribbean 4.5 35.6 31.5 3.7 8.5 451
Black African 4.5 40.7 34.8 4.6 8.8 411
Black other 4.6 37.6 32.5 4.1 8.7 185
Indian 5.0 44.9 38.5 5.8 9.1 1063
Pakistani 4.4 38.1 32.7 4.1 8.8 1154
Bangladeshi 4.6 43.2 35.6 5.2 9.5 277
Chinese 5.5 52.8 43.4 7.1 9.5 80
Other 4.8 40.7 34.9 4.8 8.9 531
Information not
obtained 5.1 41.8 35.7 4.7 8.9 1143
Source: Matched data from National Pupil Database 2001/01, 2002/03, 2003/04
The degree of socio-economic deprivation amongst the cohorts was relatively high. Eighteen per cent of the Year 11 cohort were in receipt of Free School Meals, compared with an average of 11% of all pupils in England.23 However, the majority of young people reported that they lived with at least one of their
22
Note that the definitions of minority ethnic group background are those derived from 2002 PLASC data, since the changes in the 2003 data could not be back-matched to the 2002 Year 11 cohorts. However, while White European was used as a category in the 2002 PLASC dataset, it was not used in subsequent years, so the 2002 White European cohort have been re-categorised, mainly as White Other.
23
birth parents: at least 92% of the Year 11 pupils lived in a household with their mother (27.2% lived with their mother), their father (3.8%) or both parents (61%). Some 19% of the Year 11 cohort suggested that at least one of their parents had been educated to degree level, and up to 42% that one of their parents had progressed into further education. Most, however, reported that their parents had left education at 16.24
3.2 The cohorts in Aimhigher: Excellence Challenge
The cohorts in the ‘treatment’ groups (79% of the Year 11 cohorts) and the ‘comparison’ groups differed in relation to a number of background characteristics, both within the cohorts and between the cohorts.25 While marginally more of the Year 11 pupils in Aimhigher: Excellence Challenge schools were in receipt of Free School Meals (19% compared with 17%), there were significant differences in terms of:
• the proportion with special educational needs (13% of the treatment group compared with 18% of the comparison group);
• the proportion with a first language other than English (12% of the treatment group compared with 18% of the comparison group).
This suggests that, while some pupils in the Aimhigher: Excellence Challenge Year 11 cohorts may be more disadvantaged (in a socio-economic sense) than those in the comparison cohorts, the proportion of survey respondents from Aimhigher: Excellence Challenge schools who were suffering from other levels of disadvantage was lower.
Levels of attainment amongst young people in the treatment and comparison cohorts also varied. Mean levels of prior attainment amongst the Year 11 cohorts were marginally higher in the treatment schools (a mean of Level 5 at Key Stage 3) than the comparison schools (a mean of 4.9). Attainment at Key Stage 4 was also marginally higher on some measures, with mean capped eight GCSE totals of 35.3 points for those in the treatment group, compared with 34.7 points for those in the comparison group. Young people in Aimhigher: Excellence Challenge schools achieved a mean of 4.8 A* to C grades compared to a mean of 4.7 for those in the comparison schools, although the mean total for A* to G grades was 8.9 compared with 9 in the comparison schools. These variations do not take account of any other background characteristics, however.
24
Levels of parental education were obtained from pupil questionnaires and not from the parents themselves, so it is likely that there is a margin of error in this data, which should probably be regarded as indicative rather than definitive.
25
Profile of the cohorts
As part of the Aimhigher: Excellence Challenge policy, two specific cohorts of young people were identified by partnerships. The first of these included young people designated as part of the widening participation cohort; that is, those who were in learning (whether pre- or post-16) who had the ability to progress to higher education, but who came from disadvantaged backgrounds without any history of higher education. Nine per cent of the young people in the Year 11 cohorts in the study were identified as part of the widening participation group in their school.26
The targeting strategies adopted across the various schools and partnerships appears to have ensured a degree of equity, with similar proportions of boys and girls (9% of the year group in each case) included in the widening participation cohort in Year 11. Moreover, the initial apparent differences in representation from different minority ethnic groups (with a comparatively higher proportion of pupils from Chinese [17.1%] and Black African [15.1%] backgrounds and fewer from Indian [5.9%] and Bangladeshi [3.7%] backgrounds) was not found to be significant once background characteristics such as prior attainment, sex and eligibility for Free School Meals were taken into account.
Mean levels of attainment were, on average, higher amongst the Year 11 widening participation cohorts, both at Key Stage 3 and at GCSE, than amongst those not so designated, suggesting that targeting, on the whole, had been effective in identifying those with the appropriate levels of ability. The mean number of A* to C grades achieved by young people in the widening participation cohort alone,27 for example, was 5.3, compared to a mean of 4.3 for those outside the cohort.
The second cohort included those who would be identified as gifted and talented. Under Aimhigher: Excellence Challenge this group was confined (for funding purposes) to those who were in post-16 education. Pre-16, the gifted and talented cohort was funded under the EiC initiative in Phase 1 and 2 areas (11.5% of the Year 11 cohort was designated as gifted and talented) and in Phase 3 areas (6.5% of the Year 11 cohort was designated as gifted and talented). Under EiC, participating schools were required to identify a gifted and talented cohort of some five to ten per cent of each year group in Key
26
This information, along with policy-related information, such as whether or not young people were part of the gifted and talented cohort, whether or not they had been referred to a Learning Mentor or Learning Support Unit and their level of attendance, for instance, was collected from schools on a pupil-by-pupil basis. It should be noted that Learning Mentors and Learning Support Units were elements of the EiC policy, but, as they were support mechanisms operating in the Aimhigher: Excellence Challenge schools in EiC areas, had to be included in the analysis. It should also be noted that some EiC Phase 3 schools outside Excellence Challenge/Aimhigher had identified young people as members of the widening participation cohort (less than one per cent of all respondents), even though Phase 3 schools were not officially funded under Excellence Challenge/Aimhigher at the time of the research.
27
Stages 3 and 4. At least two thirds of this cohort are expected to be those with the highest levels of attainment in academic areas of the curriculum.28 No specific policy-related funding was available for this group in EAZ areas, although some identified such young people among their pre-16 cohorts. Amongst the young people in the study, 10% of the Year 11 cohorts were designated as gifted and talented.
Unlike the profile of the widening participation cohort, the picture within the gifted and talented cohort demonstrated some significant variations in relation to minority ethnic groups.29 The apparent difference between the sexes, with 11% of the females compared to 9% of males being so designated in Year 11,30 was not significant once other background characteristics were taken into account. However, even when prior attainment was taken into account, the probability of a young person from an Indian background being designated as gifted and talented was significantly lower (an odds ration of 0.62 ) than the probability for a young person from any other ethnic group. Pupils from Black Caribbean (1.48), Black African (30.14)31 and Black other (1.48) groups were more likely than pupils from white UK or other backgrounds to be so designated.
Mean levels of attainment amongst young people designated as gifted and talented were higher than for other young people, with an average of 8.4 GCSEs at grades A* to C (compared to a mean of 4.1 for the rest of the cohort) and a mean GCSE average score of 46 (a grade B), compared with a mean GCSE average score of 34 (a grade D for those outside the designated cohort).32
28 In the first data collection exercise carried out by the evaluation consortium (for the evaluation of
Excellence in Cities), schools were asked to identify gifted pupils and talented pupils separately, but in practice it was difficult for schools to provide the information in this way, and subsequent data has been gathered for the whole gifted and talented cohort. This is also true for data gathered from schools in EAZs and in non-EIC non-EAZ comparison schools.
29
See Table 7 in Appendix 3. The coefficients for seeing a mentor are presented in Table 8 and indicated that young people from Black Caribbean backgrounds and those with SEN were more likely to have been referred to a mentor, while girls and young people from Indian backgrounds were less likely to have been referred. No table of coefficients is included for young people designated as part of the widening participation cohort, since no variables, other than prior attainment, appeared as significant in the model .
30
Indeed, 54% of the Year 11 gifted and talented cohorts were female, while 45% were male. One per cent of the young people for whom sex data was not available were also designated as gifted and talented.
31
Note that the numbers of young people in this group are low, so the odds ratio may be inflated. Note too that the likelihood of a Black African pupil being designated as a member of the gifted and talented group was higher for those of the cohort who had not necessarily had the highest levels of performance at Key Stage 3; in other words the policy was more inclusive of those Black African pupils at the lower end of the academic performance criteria.
32
Profile of the cohorts
It is possible for young people to be identified in both groups (both pre- and post-16). Indeed, 20% of the young people in the widening participation cohort were also identified as gifted and talented.33 The attainment of young people in this group was marginally lower than the gifted and talented cohort as a whole, both at Key Stage 3 (an average level of 5.8) and Key Stage 4 (a mean of 8.1 GCSEs at A* to C and an average of just under a grade B across their eight best GCSEs). However, this means that some 78% of the widening participation cohort were not designated as gifted and/or talented, but were still seen as having the ability to progress to higher education with the appropriate encouragement and support.
While one can provide a profile of the Aimhigher: Excellence Challenge cohorts and examine the attainment outcomes for those designated as widening participation and gifted and talented, this provides little indication of the relative impact of the policy. Overall attainment amongst the widening participation cohort might appear be higher than for the non-widening participation cohort, for example, but does this indicate that the policy has led to such difference emerging? Other factors, related to sex, prior attainment, individual background characteristics (such as ethnicity, fluency in English and home circumstances), attendance and school factors (including performance levels, type and location) have emerged from previous research as significant indicators of attainment.
Moreover, and as indicated in Chapter 1, these inherent, socio-economic and educational factors also appear to be associated with different levels of participation in higher education. To what extent has Aimhigher: Excellence Challenge had an impact on young people’s aspirations towards higher education? Is there any indication not only of an association between Aimhigher: Excellence Challenge-related activities and young people’s views of education, but of its impact in changing young people’s attitudes, behaviour or intentions to seek a higher education place?
In the following chapters, the report seeks to explore any statistical association between Aimhigher: Excellence Challenge-related inputs and young people’s attainment, attitudes and aspirations, taking into account their background characteristics, prior attainment and home and school circumstances, as well as their participation in Aimhigher-related activities.
33
The impact of Aimhigher: Excellence Challenge
4. The impact of Aimhigher: Excellence
Challenge
Emmerson et al. (forthcoming),34 in an overview of the estimated impact of Aimhigher: Excellence Challenge on young people pre-16, suggested that the implementation of the policy was associated with higher attainment in GCSE English (though not with higher overall GCSE attainment) and an increase in the proportion of young people aspiring to higher education.35 This chapter seeks to explore the extent to which there appears to be any statistical association between Aimhigher: Excellence Challenge inputs and the attainment and aspiration outcomes amongst young people in three different cohorts in the study, those in Year 11 in 2002, 2003 and 2004. It also explores the extent to which Aimhigher: Excellence Challenge, and any activities implemented under the policy, may have contributed to improved attainment levels or changes in aspirations amongst one longitudinal cohort of pupils – those who were in Year 9 in 2002 and in Year 11 in 2004.36
4.1 The
analysis
The approach that was adopted for this analysis reflected that which was adopted in earlier sweeps of this study. In order to explore the five questions outlined in Section 3.2, the study needed to examine a complex set of variables, to control for the variety of home and school backgrounds from which young people came, as well as their different academic abilities and prior attainment and the extent to which they had been exposed to a range of different educational experiences. These included, for some, different Aimhigher: Excellence Challenge activities. All of these could be expected to have an impact on their awareness of, and attitudes towards, higher education, as well as on their aspirations to a university education.
As in the first two annual analyses, therefore,37 a progressively focused approach was adopted. To begin with, within each cohort, young people’s responses to the surveys were combined (within year cohorts) to derive a
34
Emmerson, C., Frayne, C., McNally, S. and Silva, O. (forthcoming). An economic evaluation of the early impact of Aimhigher: Excellence Challenge on pre-16 outcomes: an update.
35
In an accompanying analysis, using data from the Labour Force Survey (LFS) for young people aged 16 to 20, they suggested that, while there were many caveats, the policy may have had an impact on those from the most disadvantaged backgrounds, with an increased probability of those from such backgrounds entering higher education. The current study focuses on younger cohorts, the majority of whom would not have reached the age for entry into higher education entry.
36
See data overview in Chapter 3.
37
series of measures relating to their attitudes and experiences. Since the questions were replicated in each survey, these measures were calculated in the same way for each of the various cohorts of students and facilitated the exploration of changes over time for particular items amongst the 2004 Year 11 cohort. A similar strategy was deployed for both the schools’ survey and the teachers’ survey, in order to develop a series of composite measures of provision and of teachers’ attitudes and perceptions of Aimhigher: Excellence Challenge.
Following data matching, a series of different statistical tests, including analyses of variance, multiple regression analyses and t-tests, were then used to identify the measures that were subsequently incorporated into the series of multilevel and logistic regression models developed to explore the impact of Aimhigher and the various activities that have been implemented under the initiative.38 Cross-sectional and longitudinal models were then constructed to look at a range of different ‘hard’ (attainment) and ‘soft’ (attitudes and aspirations) outcome measures. Background variables, at pupil and school level, were common to both the cross-sectional and longitudinal models, but the latter models, additionally, included measurements of change over time in pupils’ attitudes to school and to learning, for example, as well as exploring changes in their aspirations to higher education.
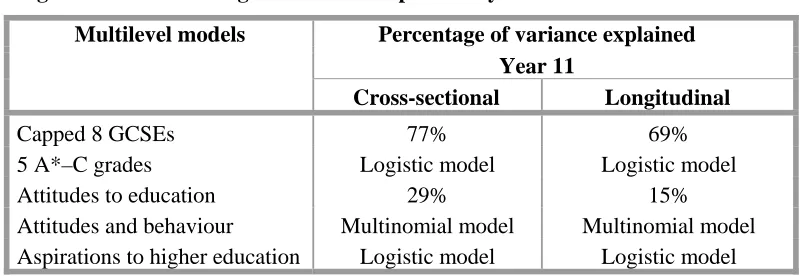
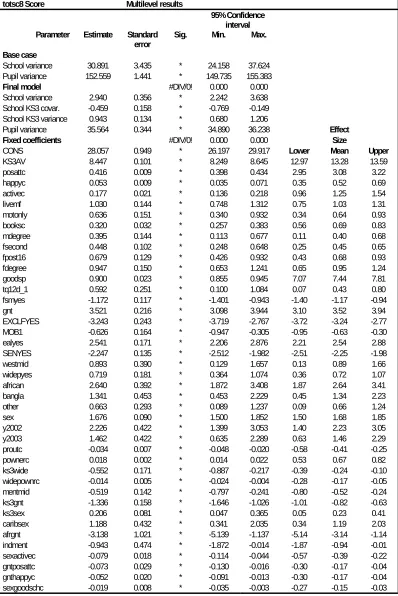
The explanatory power of the attainment models was very high, with the variance at pupil level (in other words the difference between GCSE point scores between the highest and lowest scoring pupils) reduced by between two thirds and three quarters, once background variables, prior attainment and pupil attitudes and Aimhigher: Excellence Challenge experiences were included (see Figure 4.1). The explanatory power of the attitudinal models was somewhat lower, even when prior attainment was included, since neither the available questionnaire data, nor the pupil data included in national pupil datasets provided all of the information needed to assess why young people adopt particular attitudes or modes of behaviour. Nonetheless, the reduction of variance of between one fifth (for the longitudinal model) and just under one third (for the cross-sectional model) suggest that a number of the observed variables had a significant impact on young people’s attitudes to learning and to changes in such attitudes over time.
38
The impact of Aimhigher: Excellence Challenge
Figure 4.1 Percentage of variance explained by multilevel models
Percentage of variance explained Multilevel models
Year 11
Cross-sectional Longitudinal
Capped 8 GCSEs 77% 69%
5 A*–C grades Logistic model Logistic model
Attitudes to education 29% 15%
Attitudes and behaviour Multinomial model Multinomial model Aspirations to higher education Logistic model Logistic model
4.2 The impact of Aimhigher: Excellence Challenge on
attainment
Both the current economic analysis (Emmerson et al., 2005) and the multilevel analysis that was undertaken in previous years (Morris, Rutt and Yeshanew, 2005) suggested that there may be some significant associations between policy-related interventions and ‘hard’ outcomes in terms of pupil attainment in Year 11. However, before exploring the findings from the final sets of analyses in more detail, it is worth summarising the key background factors that appear to be associated with GCSE performance, and particularly that which is associated with performance that is higher than would have been predicted from young people’s prior attainment, in order to ascertain the extent to which Aimhigher schools and partnerships might have the capacity to intervene to raise attainment further.
4.2.1 Impact of background factors on pupil attainment
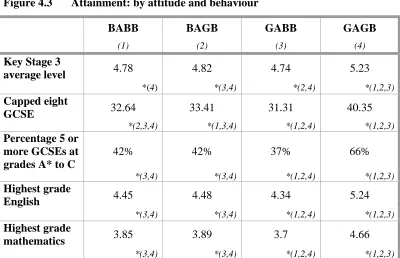
As in previous years, there were significant factors associated with attainment at pupil-level (both personal factors and those related to pupil home backgrounds), school-level factors and socio-economic factors (including those identified at neighbourhood level drawing on data from the 2001 Census data).39 Girls, young people from African and Bangladeshi backgrounds and young people who spoke a first language other than English tended to achieve more at GCSE than their peers with the same background characteristics and prior attainment, but who were boys or from different minority ethnic groups, for instance (see Figures 4.2 to 4.5, which provide a graphical representation of the outcomes of the cross-sectional and longitudinal modelling). In contrast, young people who from more disadvantaged backgrounds, or from neighbourhoods in which the majority of people were occupied in routine occupations, or were from families in which levels of parental education were low, tended to have lower levels of attainment than their peers with the same
39