Research Report DFE-RR121(a)
Parenting Early
Intervention Programme
Evaluation
Geoff Lindsay, Steve Strand, Mairi
Ann Cullen
,
Stephen Cullen, Sue
Band, Hilton Davis, Gavan Conlon,
Acknowledgements
We would like to thank all the parents who completed our questionnaires and those who gave their time to be interviewed: the local authority lead officers, facilitators and other colleagues for their time and assistance to make the evaluation successful; and the members of the steering group; and other LA colleagues who provided advice on the final reports. Finally, we would like to thank the CEDAR research secretaries who processed the substantial amounts of data necessary for this project.
AUTHORS
Geoff Lindsay1, Steve Strand1, Mairi Ann Cullen1, Stephen Cullen1, Sue Band1, Hilton Davis2, Gavan Conlon3, Jane Barlow4 and Ray Evans1
1
CEDAR, University of Warwick
2
Kings College, London
3
London Economics
4
Warwick Medical School
This research was commissioned before the new UK Government took office on 11 May 2010. As a result the content may not reflect current Government policy and may make reference to the Department for Children, Schools and Families (DCSF) which has now been replaced by the Department for Education (DFE). The views expressed in this
report are the authors’ and do not necessarily reflect those of the Department for Education
The views expressed in this report are the authors’ and do not necessarily reflect those
ACKNOWLEDGEMENTS 2
CONTENTS 3
EXECUTIVE SUMMARY 6
1. Introduction 13
1.1 The rationale for the PEIP 13
1.2 The efficacy of parenting programmes 14 1.3 The Parenting Early Intervention Programme (PEIP) 15
1.4 Aims and Methodology 16
1.5 The structure of the report 21
2. Impact of the PEIP 23
2.1 Introduction 23
2.2 Local authority activity and parent engagement 23
2.3 Parent characteristics 25
2.3.1 Parent demographics 25
2.3.2 Parent mental well-being and parenting skills 29
2.4 Child characteristics 31
2.4.1 Demographics 31
2.4.2 Child Behaviour (Strengths and Difficulties questionnaire) 33 2.5 Measuring Pre-course to Post-course change 35 2.5.1 Post-course booklet return rate 36 2.5.2 Do those responding to the post-course differ from Non-
responders?
37
2.5.3 Are there particular characteristics of those who dropped
out of the programme?
38
2.5.4 Return rate by programme 39
2.6 Did PEIP improve parent and child outcomes? 39 2.6.1 Overall effect averaged across programmes 40 2.7 Effects of parent background and programmes 44 2.7.1 Is PEIP effective for the full range of parents and children? 45 2.7.2 Difference in improvement between programmes 46 2.8 Post course evaluation – How was your group? 50
2.9 PEIP Follow Up 53
2.9.1 Introduction 53
2.9.2 Description of sample 53
2.9.3 Were those followed up representative of those completing Parenting programmes?
54
2.9.4 Findings 54
2.10 Qualitative evidence of impact 58
2.10.1 Outcomes for parents 59
2.10.2 Outcomes for children/young people 62 2.10.3 Outcomes for family relationships 66 2.10.4 Outcomes for parents’ relationships with schools 67 2.10.5 Outcomes for community relationships 69 2.10.6 Outcomes for practitioners as facilitators 70 2.10.7 Outcomes for professionals referring parents to
programmes
71
2.10.8 Conclusions 71
3. The Facilitators 73
3.1 Introduction 73
3.2 Facilitators’ demographics: Gender, age and ethnic group 73 3.3 Facilitators’ educational qualifications 74
3.4 Facilitators’ prior experience 76
3.5 Comparing facilitators’ qualifications and prior experience 78 3.6 Lead facilitator characteristics and parent outcomes 79 3.6.1 The matching process and achieved sample 79 3.6.2 Lead facilitator qualifications and experience in relation to
parent and child outcomes
80
4. Process factors underpinning effective outcomes 82
4.1 Programme factors 82
4.1.1 The programmes 82
4.1.2 The initial training 86
4.1.3 Further training and accreditation 88
4.1.4 Supervision requirements 89
4.2 Local infrastructure factors affecting effectiveness and implementation
90
4.2.1 Efficiency and effectiveness 90
4.2.2 Leadership and coordination across a local authority 91 4.2.3 Meshing PEIP into the local context 94
4.2.4 LA-wide delivery models 97
4.2.5 Recruitment, retention, support and supervision of facilitators
101
4.2.6 Recruitment, engagement and retention of parents 104
5. Cost effectiveness of the PEIP 109
51 Introduction 109
5.2 Cost effectiveness analysis 109
5.3 Findings 111
5.4 Disaggregation of expenditure 112
5.5 Costs of programme outputs 114
5.6 Costs of parenting outputs 117
5.7 Costs of child outputs 118
5.8 Conclusions 118
6. Discussion, Conclusions and Recommendations 120
6.1 Introduction 120
6.2 Was parenting training effective in the new sites? 120 6.3 Are the positive effects sustained after the post-intervention
period?
122
6.4 What were the characteristics of successful implementation of the PEIP?
122
6.5 Conclusions 124
6.6 Recommendations 125
References 127
Appendix 1 Methodology 129
Appendix 2 The five PEIP programmes
References for Appendix 2
Appendix 3 Statistical analysis for the four main PEIP programmes
136
160
163
Appendix 4 Summary reports for all eight PEIP programmes 165
EXECUTIVE SUMMARY
Behaviour problems during early and middle childhood are associated with antisocial behaviour during adolescence and increase the risk of negative outcomes in adulthood. Successful parenting is a key element in preventing children developing behavioural
difficulties. However, parents differ in the internal and external resources on which they can draw. Internal resources include their own mental well-being and resilience. External resources include poverty, social disadvantage and the absence of a support network.
The recent Allen Report (2011) stressed the need to use effective methods of early
interventions, including parenting programmes. There is now strong evidence from rigorous efficacy trials that parenting programmes can improve parenting skills and, as a result, reduce children’s behavioural difficulties. Evidence is also necessary to show their
effectiveness when programmes are implemented on a large scale, in community settings. This report presents the evidence for the effectiveness of the national roll out of parenting programmes in England.
The Parenting Early Intervention Programme (PEIP, 2008-11) provided government funding to all 150 local authorities (LAs) in England to deliver selected parenting programmes that already had evidence of their efficacy in improving parent outcomes and associated reductions in children’s behavioural difficulties1. This report examines the effectiveness in everyday use in community settings across England of five parenting programmes initially selected by the government for use in the PEIP; these were Families and Schools Together (FAST), Positive Parenting Program (Triple P), Strengthening Families Programme 10-14 (SFP 10-14), Strengthening Families, Strengthening Communities (SFSC), and The Incredible Years.
Key Findings
• The national roll-out of PEIP was successful in increasing the support available
for parents concerned about their child's behaviour.
• Outcomes were equally positive for the parents of older children (8-13 years, the
target age group for PEIP) as they were for parents of younger children. Parenting
1
http://webarchive.nationalarchives.gov.uk/20100202100514/dcsf.gov.uk/everychildmatters/strategy/parents/id91 askclient/localauthority/fundingforparents/ From June 2010, LAs were able to fund other programmes through PEIP.
programmes in the PEIP can therefore be effective interventions for a wide range of age groups.
• All four main parenting programme used by the PEIP (Triple P, Incredible Years,
Strengthening Families Programme 10-14 and Strengthening Families
Strengthening. Communities) were effective in improving outcomes for parents and children, and these outcomes were maintained one year on from the end of the programme.
• These programmes had a positive effect on parents’ mental well-being and style of
parenting, as well as on their children’s behaviour; these are all key protective factors for achieving positive long term child outcomes.
• The cost to local authorities of funding the delivery of parenting programmes should
be lower in future as infrastructure set up costs, especially the training of facilitators, have been met through PEIP.
Detailed findings
The parents and children:
• Local authorities used PEIP to target parents appropriately. Overall, the parents were
more disadvantaged than the general population. o 44% were living in single parent households. o 63% lived in rented accommodation.
o 69% had sought help from one or more professionals in the previous six months o 54% had educational qualifications below the level of 5 GCSE A* -C or equivalent o 75% scored below the national median for mental well-being.
• Compared with the national population the child about whom parents were most
concerned displayed the following characteristics:
o Four times more likely to have a statement of special educational need (11.8% v 2.7%).
o Three times more likely to be entitled to a free school meal (49% of children v 16%).
o Six times more likely to be classified as having serious behavioural difficulties. In addition:
o Nearly a third (31%) received additional support at school.
o Just over a half (54%) were in the PEIP target age range of 8-13 years (mean age 8.6 years: standard deviation 3.9 years).
Short term outcomes
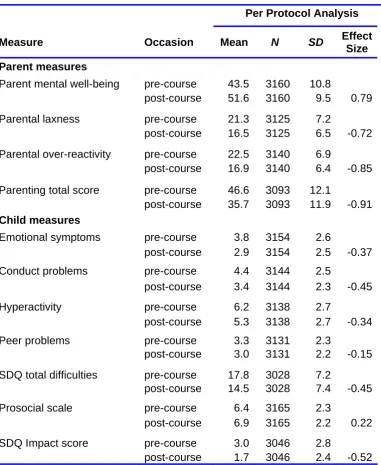
• Outcomes for parents on all four programmes were significantly improved after
programme completion:
o Overall, 79% of parents showed improvements in their mental well-being. o The average level of parental mental well-being increased from that of the
bottom 25th percent of the population to the national average.
• A considerable proportion of parents changed their parenting behaviour over the
course of the programme:
o 74% of parents reported reductions in their parenting laxness. o 77% of parents reported reductions in their over-reactivity.
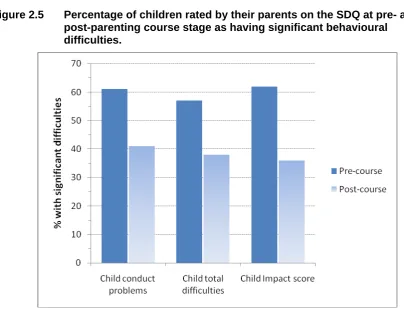
o The percentage of parents who reported that their child had serious conduct problems reduced by a third, from 59% to 40%.
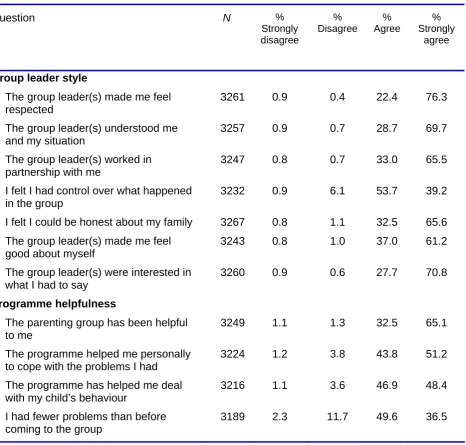
• Parents were highly positive about their experiences of the parenting groups they
attended:
o 98% reported that they had found the group helpful.
o 95% reported that the programme had helped them deal with their problems. o 95% reported that the programme had helped them to deal with their children’s
behaviour.
o 86% reported that they experienced fewer problems after completing the programme.
o Over 98% reported that the group leader, showed positive characteristics, including making them feel respected and working in partnership.
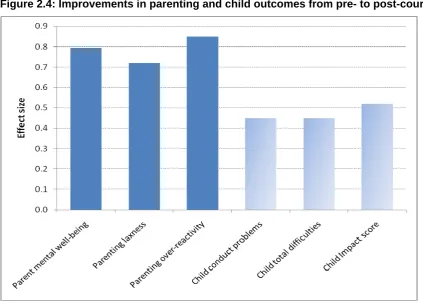
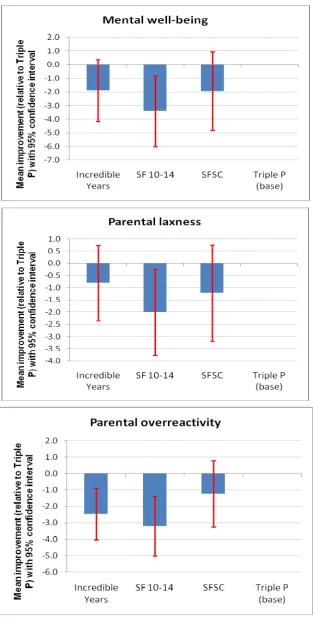
• There were differences in the effects on outcomes between the individual
programmes but these were relatively small compared to the overall improvements reported by parents.
One year follow up
• Improvements in parent laxness and over-reactivity were maintained. • Improvements in their children’s behaviour were also maintained.
• There was a small reduction in parents’ reported mental well-being but this remained
significantly higher than when they started their parenting programme.
Implementation effectiveness
• The number of parents supported through the programme varied substantially
between LAs, ranging from over 750 parents in one LA to 30 or fewer or others. • There was substantial variation between LAs in the cost-effectiveness of the PEIP.
• The proportion spent on management reduced over time as the PEIP became
established.
• The average cost of funding a parent who started a PEIP parenting programme was
approximately £1244; this increased to £1658 if the 75% completion rate found in the LAs providing data is taken into account.
• The lowest cost per parent, in one LA that had been operating for the full
three years of the programme, was only £534.
• Several models of local authority organisation for delivering the PEIP were effective,
including a core team, a multi-agency team, commissioning outside the authority, and hybrid models: the key was to match the model to local circumstances.
• Successful implementation was related to:
o Effective leadership and coordination of the PEIP.
o How well the PEIP was integrated into the LA context, including its parenting or Think Family strategy.
o Effective recruitment, retention, support and supervision of group facilitators. o Effective recruitment, engagement and retention of parents.
Conclusions
• Evidence-based parenting programmes can be effective when implemented under
variable local conditions.
• All four PEIP programmes were effective in improving parenting skills, parent mental
well-being and in reducing children’s behaviour difficulties for parents and children across the full range of demographic backgrounds, including children with SEN. • Outcomes were maintained one year on from the end of the programme. • Differences in outcomes between programmes were small.
• Positive outcomes in children’s behaviour and wellbeing would be expected to impact
positively on educational attainment.
• The cost of delivering parenting programmes reduced with time, as set up costs e.g.
infrastructure and training facilitators, are front loaded. Future costs should therefore be lower on average than those reported here.
Recommendations
• Local authorities should make parenting programmes available as part of their
prevention and intervention strategies to prevent the development or reduce the impact of behavioural difficulties in children.
• Provision of parenting programmes should be directed mainly at those in greatest
need; however, there are also benefits in recruiting a broader spectrum of parents in order to optimise group dynamics and achieve better outcomes.
• Differences in outcomes between programmes were small, therefore the choice of
evidence-based programmes for local use should be made in alignment with: local needs and priorities, how efficiently they use existing trained workforce, experience of delivery, and development of the local offer to parents.
• Effective implementation by a local authority requires strong leadership, effective day
to day management and organisation, as well as a clear parenting policy.
• Several organisational and delivery models work well; the key is to match the model
to local circumstances.
• A diverse workforce, including parents and non-graduates, can deliver parenting
programmes effectively when provided with appropriate training, support and supervision.
• Effective selection of facilitators should be based on their capacity to deliver
programmes, and the skills and personal qualities that enable them to engage with parents.
• Local authorities should ensure that the programmes are quality assured and
maintain fidelity to their evidence-based models of implementation as set out in the guidance2.
The evaluation
Aims and objectives
The aim of the study was to:
• Evaluate the impact and benefits of the national roll out of the Parenting Early
Intervention Programme.
2
http://webarchive.nationalarchives.gov.uk/20100202100514/dcsf.gov.uk/everychildmatters/strategy/p arents/id91askclient/localauthority/fundingforparents/
The objectives were to:
• Evaluate whether the positive impacts of parenting programmes demonstrated in
research are replicated when these programmes are rolled out on a larger scale under variable conditions in a range of community settings.
• Assess whether the positive effects of parenting programmes are sustained one year
after the short term evidence of the immediate impact of group training. • Consider how the PEIP fits with other local authority parenting provision (e.g.
parenting experts, Parent Support Advisors) and how far this provision provides a preventative approach to working with children and families at risk of negative outcomes.
Methods
PEIP enabled LAs to fund one or more of five evidence-based parenting programmes as approved by the National Academy of Parenting Practitioners (NAPP). These were:
• Families and Schools Together (FAST) • Incredible Years
• Strengthening Families Strengthening Communities (SFSC) • Strengthening Families Programme 10-14 (SFP10-14) • Triple P
All five parenting programmes have an evidence base for improving parent and child outcomes when tested in small scale, controlled trials. Our evaluation examined whether these outcomes could be maintained and replicated when the programmes were rolled out nationally and implemented in all LAs in England. To do so we collected information on:
• Reported changes in parenting styles, child behaviour and parent mental well-being
following the attendance of one of four of the NAPP approved parenting programmes (measure of impact)3
• The organisational factors that support effective implementation of PEIP and its roll
out
To assess the short term impact of the parenting programmes on parent and child outcomes, we provided parents with questionnaires to complete at the beginning and end of their
3
As there was insufficient data from parents attending FAST, impact could only be examined for the other four programmes. However, implementation effectiveness of all five programmes was
examined. For summary outcome data for 44 parents completing FAST see Appendix 4.
course and these scores were compared in order to measure change. We collected pre-course data from 6143 parents in 43 sample LAs and also obtained post-pre-course data from 3325 of them, who were representative of the total sample (overall response rate 54%)4.
To assess the sustainability of positive effects follow up questionnaires were obtained from 212 parents, who were representative of those who had completed the programmes, one year after they had finished their programme (response rate 30% providing data).
The measures of outcome used in the questionnaires completed by parents have been substantiated by and used in prior research, including the PEIP Pathfinder report. These measures assess parental mental well-being, parental laxness and over-reactivity in dealing with their child’s behaviour, and the parent’s view of the child’s behaviour, all of which are risk factors for child outcomes that are expected to be positively influenced by the parenting programmes.
As administrative data were not available, in order to assess cost effectiveness we provided LAs with a questionnaire to complete towards the end of the. Indicative findings are derived from 15 of the 43 LAs that also provided parent data.
To examine the organisational factors that support effective rollout of PEIP, 429 interviews were conducted with a sample of parents and professionals.
4
The non-response rate comprises both those parents that did not complete the programme and those for whom questionnaires were not returned to CEDAR despite programme completion (see section 2.5.1).
1. INTRODUCTION
1.1 The rationale for the PEIP
Many children and young people exhibit behavioural difficulties. A national study by Green et al. (2004) found prevalence rates of between 10-20 per cent within the UK. Furthermore, prevalence rates have increased since the mid 1970s (Maughan et al., 2008). Such difficulties have serious implications for children, their families and society as a whole. For example, at school age, 12% of children aged 4-10 years and 18% aged 11-15 years who have statements of special educational needs (SEN) have behavioural, emotional and social difficulties (BESD) (Department for Education, 2010). When pupils with statements and those at School Action Plus are combined, 30 per cent of pupils with SEN have BESD. Pupils with SEN at School Action Plus are 20 times more likely to receive a permanent exclusion than those with no SEN. Pupils with BESD were the most likely to be permanently excluded.
We also know that conduct problems during early and middle childhood are associated with antisocial behaviour during adolescence and put the young person at risk of criminal
behaviour. These enhanced risks persist: early behavioural difficulties are associated with adult mental health problems, crime, relationship and parenthood difficulties and substance dependence (Ferguson et al., 2009).
There are economic considerations as well as personal and social impacts of children
exhibiting behaviour problems. The SEN statistics above indicate the financial resources that are necessary to provide support for pupils with BESD if they are at School Action Plus, receiving support from a professional from outside the school or, even more so, if the pupil has a statement.
Parents are fundamental to their children’s development and so successful parenting is a key element in preventing children developing behavioural difficulties (Pugh, De’Arth & Smith, 1994). However, parents vary in their capabilities. All parents find parenting a
challenge at times but parents differ in the internal and external resources on which they can call. Internal resources include their own mental well-being and personal resilience. External factors include poverty, social disadvantage and the absence of supportive families and friends. These factors interact and multiple adverse factors may lead to a parent not
developing or not implementing effective parenting skills, in order to provide an appropriate environment for the development of their children.
Supporting parents to develop effective parenting skills has therefore been recognised as an important prevention and intervention strategy. As group methods offer the potential for greater cost-effectiveness, a variety of group training programmes have been developed and implemented, including the five main programmes examined in this evaluation (see below).
1.2 Efficacy and effectiveness
There is now good evidence for a number of parenting programmes, derived from carefully devised and implemented efficacy trials. The ‘gold standard’ approach is to run these as randomized controlled trials. These provide the best evidence of real effects by randomly allocating parents to either the parenting programme or a control group that does not receive it. These trials require care to implement the programme according to its specified guidance (typically set out in a manual), using well trained facilitators and appropriate measures of outcome. Ideally such trials should be replicated and preferably by independent researchers.
There is now extensive evidence that parenting programmes can have positive effects on both parent outcomes (e.g. improving parenting skills and parents well-being) and that these are associated with changes in their children (e.g. reduced behavioural problems).
Overviews of evidence are available from the United Nations Office on Drugs and Crime http://www.unodc.org/docs/youthnet/Compilation/10-50018_Ebook.pdf and from systematic reviews of studies (e.g. Barlow & Coren, 2000; Barlow & Stewart-Brown, 2000; National Institute for Health and Clinical Excellence, 2005). The research report from the Allen Inquiry into early intervention (Allen, 2011) also reviews parenting programmes and other methods of early intervention, providing useful indications of the quality of the evidence available for each programme.
Efficacy trials provide the basic evidence and are essential pre-requisites. However, it is also important to examine the implementation of evidence-based programmes in ‘real world’ settings as argued cogently by Weisz (e.g. 2004). Efficacy trials are typically very well resourced and carefully conducted in order to obtain results under optimal conditions. Such conditions do not match the circumstances found in everyday practice. Here the task is much more challenging. Practitioners, local authorities and health trusts are expected to provide services to meet public need not the rigours of research. It is important, therefore to examine both the efficacy of parenting programmes under ideal conditions and their
effectiveness in real life, community settings.
1.3 The Parenting Early Intervention Pathfinder (PEIP)
The previous government prioritised parenting support as a means of reducing antisocial behaviour among young people and preventing crime, thereby enhancing communities. The Respect Action Plan, a Home Office initiative, had a budget which included £52 million over two years to provide a number of parent support initiatives (Respect Task Force, 2006). The Parenting Early Intervention Pathfinder (2006-08) was funded in 18 LAs for £7.6 million. Its focus was on parents of children aged 8-13 exhibiting or at risk of behavioural problems as this age group was judged not to have the level of support available to younger and older children.
On the basis of a review of evidence by Moran, Ghate and van der Merwe (2004) three programmes were selected: Triple P, Incredible Years and Strengthening Families, Strengthening Communities. Eighteen LAs that were judged by the Department for
Education and Skills5 to have experience in parenting support were selected. The LAs were each allocated funding to implement one of the three programmes as determined by the DfES (6 per programme). The results of our evaluation (Lindsay, et al, 2008) were
sufficiently positive to encourage the Department for Children, Schools and Families to try to implement parenting support more widely.
The Parenting Early Intervention Programme (PEIP) was an initiative begun in 2008 to fund all 150 local authorities (LAs) in England to deliver evidence-based parenting programmes. Findings from our evaluation of the Pathfinder showed that there were substantial
improvements in parents’ mental well-being, parenting styles (reductions in over-reactivity and laxness) and improvements in their children’s behaviour as a result of attendance at parenting programmes. This evidence was then used to inform the Guidance6 that was issued to all LAs to help them set up and deliver PEIP, which was rolled out to a further 23 LAs (Wave 2) from 2008, and nationally from 2009 (Wave 3).
5
The Department for Education and Skills (DfES) was later replaced by Department for Children, Schools and Families (DCSF). This in turn was replaced by the Department for Education (DfE) by the Coalition Government in May 2010. We use the name of the department at the appropriate time throughout this report
6
http://webarchive.nationalarchives.gov.uk/20100202100514/dcsf.gov.uk/everychildmatters/strategy/p arents/id91askclient/localauthority/fundingforparents/ (Accessed 21.4.11) From June 2010, LAs were able to fund other parenting programmes through PEIP.
The PEIP operated within a new policy framework, Think Family7. This brought together several parenting support initiatives including the PEIP. Importantly, the policy allowed LAs greater freedom to vire Think Family grants across interventions, allowing them greater freedom of decision making. Local authorities were allowed to use funding through PEIP to implement any of five programmes approved by the DCSF on the advice of the newly created National Academy of Parenting Practitioners (NAPP); those used in the Pathfinder together with Strengthening Families Programme 10-14 and Families and Schools Together (FAST)8. From June 2010, LAs were able to fund other parenting programmes through PEIP.
During the early part of the PEIP, LAs were required to submit regular reports to the DCSF as our Pathfinder evaluation had identified a vast range in LA implementation and hence cost-effectiveness. This requirement was later rescinded. As a result of these changes there were no administrative data available. Consequently it was not possible to know how many groups were run, parents supported or the income and costs of implementation for each LA. This does not affect our study of the programmes’ impact or implementation of PEIP;
however we cannot assess overall effectiveness of the PEIP in terms of parent and group numbers. Furthermore, in the absence of systematic DfE data on funding and expenditure for each LA, we have used LAs’ own (unaudited) data collected by means of a survey.
1.4 Aims and Methodology
The evaluation adopted a combined methods approach, using both quantitative and qualitative methods to address the research questions. A summary of the methodology is presented here. We specify the aims and objectives of the study and describe the parenting programmes. We then set out details of the study: our samples of parents and the measures we used to evaluation impact and implementation of the PEIP.
7
http://education.gov.uk/publications/standard/publicationDetail/Page1/DCSF-00264-2010 (Accessed 8.3.2011)
8
Our final report on the Pathfinder recommended that LAs should be allowed to use funding to implement other programmes that had a good evidence base.
The aim of the study was to:
• Evaluate the impact and benefits of the national roll out of the Parenting Early
Intervention Programme.
The objectives were to:
• Evaluate whether the positive impacts of parenting programmes demonstrated in
research are replicated when these programmes are rolled out on a larger scale under new conditions.
o Measured by parents’ reports of their mental well-being, their laxness and over-reactivity, and their reports of their children’s behaviour.
• Assess whether the positive effects of parenting programmes are sustained beyond
the short term evidence of the immediate impact of group training.
o Examined by a one year follow up of parents who had completed parenting programmes
• Consider how the PEIP fits with other local authority parenting provision (e.g.
parenting experts, Parent Support Advisors) and how far this provision provides a preventative approach to working with children and families at risk of negative outcomes.
o Examined by interviews with parents and a range of LA staff.
These translated into three research questions: • Is parenting training effective in the new sites?
• Are the effects sustained after the post-intervention period?
• How does PEIP fit with other parenting provision and to what extent is it
preventative?
The study therefore had objectives that required examination of impact (benefits to parents and children) and the methods of implementation (processes).
The programmes
Five programmes were initially approved by the DCSF as eligible for funding through the PEIP on the advice of the National Academy of Parenting Practitioners (NAPP) – see Figure 1.1:
• Families and Schools Together (FAST) • Incredible Years
• Strengthening Families Strengthening Communities (SFSC)
• Strengthening Families Programme 10-14 (SFP10-14) • Triple P
All are designed to address parenting skills and children’s behaviour but there are differences in the theoretical bases, aims and structures. For example, length of programmes varies and SFP 10-14 and FAST also involve children in the programme. During the PEIP, guidance to LAs changed allowing use of the grant funding for other programmes. Consequently, our evaluation primarily focuses on these five but reference is also made to three others that LAs used. Details of the five main PEIP programmes and reference to the research that provides their evidence base is presented in Appendix 2. Summary outcome data for all eight programmes used in PEIP are given in Appendix 4.
Samples
The Pathfinder (2006-08) was retrospectively named Wave 1. These 18 LAs were not part of the study, except for interviews with LA lead officers on two occasions (see Appendix 1 Table A.1 for a full list of interviews). All 23 Wave 2 LAs and a sample of 24 Wave 3 were selected for study. The Wave 3 LA selection took into account the need for a sample that reflected geographic spread, urban/rural, and levels of socioeconomic disadvantage.
Overall, we collected pre-course data on 6143 parents that attended a parenting group and also obtained post-course data from a representative sample of 3325 of them. Follow-up questionnaires were also obtained from a representative sample of 212 one parents year after completing their parenting programme9. We also collected data from 429 interviews with parents and professionals (see Interviews below).
9
As the majority of parents attending parenting courses did so during the last year of PEIP, follow up was not possible during the period of the evaluation.
Figure 1.1
The five PEIP programmes (For full details, see Appendix 2)
FAST (Families and Schools Together) – originated in USA
Age range 3 -18 years
Core programme 8 weekly 2.5 hour evening sessions, school-based. Followed by two years of parent-led, school-supported, monthly booster sessions.
Session structure Family tables including meal; peer activity (parent group; child group); parent-child activity, closing tradition.
Participants Families with children in a year group in a school serving a multiple risk neighbourhood. 10 families per hub, with school running 4 to 6 hubs at a time. Facilitators Five per hub - professionals from multiple agencies and parents of children in an
older year group in the school; young people also in secondary schools. Example aim To increase protective factors for child [more aims in Appendix]
Incredible Years – originated in USA
Age range 8-13 years (for the PEIP programme)
Core programme Combines elements of the School Age BASIC program (12-16 sessions) with the ADVANCE parent Program (9 sessions) making 18-22 sessions of 2-2.5 hours. Session structure Set out in manual – includes group discussion, video and live modelling, role play
or small group rehearsal. Refreshments provided. Participants Group of 10-14 parents
Facilitators Two group leaders – ideally drawn from professionals with postgraduate qualifications in fields such as psychology, psychiatry, social work, nursing Example aim Treatment and prevention of child behaviour problems [more aims in Appendix]
Strengthening Families Programme 10-14(SFP 10-14) – originated in USA
Age range 10-14 years
Core programme Seven weekly 2 hour sessions. Followed by four optional booster sessions beginning 6-12 months afterwards.
Session structure Set out in manual – parallel groups for parents and young people, family activities. Includes refreshments and may include a meal.
Participants Up to 12 families
Facilitators At least three facilitators (one for parents, two for young people) – drawn from all professional groups and parents who have previously attended the course. Example aim To decrease alcohol and drug use during adolescence [more aims in Appendix]
Strengthening Families Strengthening Communities (SFSC) – originated in USA Age range 3-18 years
Core programme Thirteen weekly 3 hour sessions.
Session structure Set out in manual – includes facilitator modelling, role play, lectures, discussion. Participants Group of 8-15 parents
Facilitators Co-facilitation model – practitioners from any occupation, ideally with Level 3 qualifications and experience and expertise in working with parents
Example aim To promote protective factors for child [more aims in Appendix]
Triple P (Positive Parenting Program) – originated in Australia
Age range 0-16 years
Core programme For PEIP, typically Level 4 Group or Group Teen – eight sessions: five as 2-hour group sessions, three as 30 minute telephone calls.
Session structure Set out in manual – includes presentations, video demonstrations, discussion Participants 10-12 parents
Facilitators One facilitator required – basic professional training required - typically drawn from psychologists, social workers, teachers, family counsellors, nurses Example aim To enhance parents’ knowledge, skills, confidence [more aims in Appendix]
Measures
Parent questionnaires
Three instruments were administered by the group facilitator and completed by parents as they started their programme (pre-course), at the last session (post-course). Parents completed the same questionnaires sent by post one year after the programme finished. These are all well established self report measures and had been used for the Pathfinder evaluation. The measures assessed:
• Parent mental well-being
The Warwick-Edinburgh Mental Well-being Scale (WEMWBS) 10 examines how the parent feels, e.g. ‘I’ve been feeling useful’, and ‘I’ve been feeling good about myself’.
Two important dimensions of parenting style were measured by the Parenting Scale
• Parental laxness
This scale examines whether parents are too lax when dealing with their child: for example, whether a parent backs down and gives in if their child becomes upset after being told ‘no’.
• Parental over-reactivity
This scale examines parents’ over-reactions: for example, whether a parent raises their voice or yells when their child misbehaves as opposed to speaking to the child calmly.
Children’s behaviour was measured by the Strengths and Difficulties Questionnaire (SDQ)
• Children’s behaviour
Parents rated the behaviour of their ‘target child’, i.e. the child about whom they had most concern, on the SDQ. We report three measures: children’s conduct problems; an aggregate measure (total difficulties) of conduct problems, hyperactivity, peer problems and emotional symptoms; and the impact of the children’s behaviour problems.
In addition, parents provided demographic information about themselves and their target child in the family at pre-course. They also completed a questionnaire: ‘How was your group?’ at the end of their parenting programme in order to provide information on their
10
Full details of the measures are given in Appendix 1.
group experience, with particular reference to the effectiveness of the group facilitator’s style and the helpfulness of the programme.
Facilitator questionnaire
Facilitators (N = 1277) completed a form giving details of their qualifications and previous parenting programme experience. This enabled an analysis of the relationship of those factors with improvements shown on the parent-completed measures.
Cost effectiveness questionnaire
Fifteen of the 43 local authorities surveyed completed a questionnaire specifically designed for the PEIP and piloted in five LAs (one per main programme). This captured costs and number of parents supported and was used to examine cost-effectiveness of implementing the PEIP.
Interviews
A total of 429 interviews were held with LA strategic leads, operational leads, group
facilitators, school representatives and parents across our total sample of 47 Waves 2 and 3 LAs and 18 Wave 1 LAs (Appendix 1, Table A.1). These provided the opportunity to explore factors that supported or inhibited implementation. Semi-structured interviews administered face-to-face or by phone were used at appropriate stages of the study: strategic lead (73 interviews), operational leads (92), combined role lead (13), facilitator (77), other parenting support professionals (83) school representative (16), parent (75).
1.5 The structure of the report
The main focus of the report is the evaluation of the PEIP 2008-11, but this built upon the Pathfinder (Wave 1) evaluation 2006-08. Two interim reports were produced. The first (Lindsay et al, 2009) examined the first year of the PEIP (to summer 2009), reporting on its implementation and the training of facilitators. Data were presented on the first 714 parents that had started parenting programmes in Wave 2. We showed that the PEIP had been slow to get underway, especially considering the success of the Pathfinder. A key factor was the training of facilitators as this process went on for some considerable time, so delaying start up. There were also LA organisational factors. The 2nd Interim Report (Lindsay et al., 2010) examined the second year (to summer 2010). It included data on 3131 parents which suggested that the PEIP was addressing the needs of appropriate parents and children and was having a positive impact.
The present report focuses on evidence collected throughout the project including outcome data on all parents. It is structured as follows:
Section 2 presents the evidence on impact. This draws primarily on the data from the parents attending the groups. A separate subsection reports the one year follow-up data which examines whether gains made as a result of attending the groups are maintained. Interview data about the impact of PEIP programmes are also presented.
Section 3 presents data on the facilitators. The interest here concerns both the characteristics of facilitators and the extent to which facilitator characteristics are an important factor in programme impact, which is examined in the next section.
Section 4 examines the implementation of the PEIP. Drawing mainly on qualitative data, this explores programme and local authority organisation factors associated with successful implementation. Also included is a consideration of the impact of the facilitators.
Section 5 presents an analysis of the costs of implementing parenting programmes through PEIP and an analysis of the cost effectiveness of the parenting programmes delivered through PEIP.
Section 6 comprises a discussion of the findings, conclusions and recommendations.
Appendices provide additional information on the methodology, the five main parenting programmes and additional statistical analysis. A full technical report of the statistical analyses is available on the CEDAR website (http://www2.warwick.ac.uk/fac/soc/cedar/peip/).
2.
IMPACT OF THE PEIP
Main Findings
• The roll-out of evidence-based parenting programmes through the PEIP has
been successful on a national scale and has significantly increased support for a large number of parents.
• The parenting programmes have had positive effects on the parents’ mental
well-being and their style of parenting, as well as their children’s behaviour.
o The improvements in children’s behaviour are comparable to those found in recent UK small scale studies.
• Positive effects were maintained at follow up a year after the programme ended.
2.1 Introduction
This section focuses on the impact of the PEIP based on data from questionnaires
completed by parents attending parenting groups and interviews with a sample of parents. We present the following findings: engagement by the local authorities (LAs) and the use of the different programmes; characteristics of the parents who attended parenting
programmes; characteristics of their target child, about whom they were most concerned; the changes in parents and their children associated with attending their parenting group; the parents’ evaluations of their groups; the evidence from a follow up of parents one year after they finished their parenting programme; and interview data about impact. The main
questions we address are:
• How effective was the PEIP overall in improving parent and child outcomes? • Was the PEIP effective across the full range of parents and children?
• Were there differences in effectiveness between the parenting programmes? • Were improvements maintained one year later?
2.2 Local authority activity and parent engagement
• The sample comprised 6143 parents from 43 local authorities.
• Local authorities varied greatly in their responses, from 754 to just 2 parents.
Parent questionnaires were returned by 43 Local Authorities (LAs): 22 of the 23 Wave 2 and 21 of the 24 Wave 3 LAs in our sample. Data were available on 6,143 parents (4,223 Wave 2 and 1920 Wave 3). The single largest proportion of parents was from Greater London
(17%) and the South East regions (17%), but parents were drawn from across all regions of England.
The highest numbers of parents were not surprisingly from Wave 2 LAs (4223) with relatively fewer returns (1920) from Wave 3 LAs as they started a year later. Some LAs returned substantially more questionnaires than others. The largest return was from an LA with 754 parents representing 12% of the total sample and the smallest was just 2 parents, Appendix 1 Table A.2). Overall 10 LAs accounted for over half (52%) of all the parents. However 26 LAs provided reasonably large samples, returning more than 100 parents.
A total of eight programmes were being used in the PEIP with Triple P the most dominant (attended by 52% of all parents). However only four programmes (Triple P, Incredible Years, SFP 1014 and SFSC) were taken by significant numbers of parents. As shown in Table 2.1 together these four programmes account for 94% of all parents in the sample.
Table 2.1 Number of parents by programme
Programme Wave 2 Wave 3 Total parents % all parents
FAST 71 33 104 1.7%
SFP 1014 590 379 969 15.8%
Incredible Years 522 260 782 12.7%
SFSC 565 303 868 14.1%
Triple P 2390 781 3171 51.6%
Parent Power 85 19 104 1.7%
STOP 0 102 102 1.7%
Parents Plus 0 43 43 0.7%
Total 4223 1920 6143 100.0%
Twenty LAs were running a single programme. The remainder were running multiple programmes, with 11 LAs running two programmes, 10 running three programmes and 2 running four or more. However where multiple programmes were running it was usual for one programme to predominate (Appendix 1, Table A.2).
2.3 Parent characteristics
• Parents tended to be more socially disadvantaged than the general population. • Most parents attending a parenting programme were female (85%).
• As they started their group, parents generally had significantly lower mental
well-being and higher levels of parenting laxness and parenting over-reactivity than the general population. These are risk factors for negative child outcomes.
2.3.1 Parent demographics Relationship to child
The vast majority of those involved in the programme (91%) were the child’s biological parents (Table 2.2). The ‘other’ group (3%) was in almost all cases a grandparent.
Table 2.2 Parent relationship to child
Relationship to child Frequency %
Biological parent 5413 90.6
Step parent 147 2.5
Parent's partner (living together) 141 2.4
Adoptive parent 59 1.0
Foster parent 36 0.6
Other relationship 181 3.0
Total 5977
Note: 166 missing cases
Parent gender
The vast majority (85%) of parents involved in the programme were female (Table 2.3).
Table 2.3 Parent gender
Parent gender Frequency %
Male 888 14.6
Female 5207 85.4
Total 6095 100.0
Note: 48 missing cases.
Family structure
A high proportion of the parents (44%) were living in single parent households (Table 2.4). This is almost twice the national average of around 24% (Strand, 2010).
Table 2.4 Family structure
Family structure Frequency %
Single parent 2580 43.9
Living with partner or other adult 3299 56.1
Total 5879 100.0
Note: 264 missing cases.
Housing
A high proportion (63%) of parents was living in rented accommodation as opposed to owning their own property (Table 2.5). This is 2.5 times the national average of around 27% (Strand, 2010).
Table 2.5 Housing statistics
Housing status Frequency %
Own property 1873 32.1
Rented property 3653 62.6
Other 312 5.3
Total 5838 100.0
Note: 305 missing cases.
Parental health
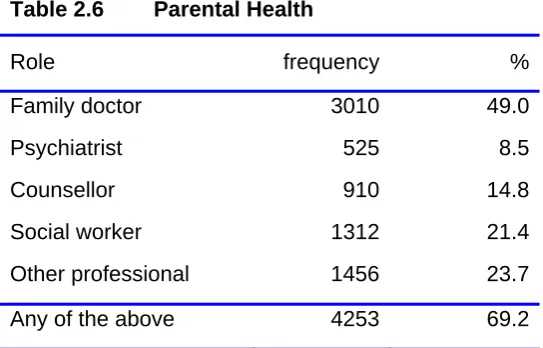
[image:26.595.67.339.545.719.2]Parents were asked if in the last six months whether they had sought help from a number of professionals. More than two-thirds of the parents (69%) had sought help from one or more professionals (Table 2.6). The most frequently cited professional was the family doctor (49%) followed by social worker (21%), counsellor (15%) and psychiatrist (9%).
Table 2.6 Parental Health
Role frequency %
Family doctor 3010 49.0
Psychiatrist 525 8.5
Counsellor 910 14.8
Social worker 1312 21.4
Other professional 1456 23.7
Any of the above 4253 69.2
The category ‘Other professionals’ included a wide and varied range, including teachers, health visitors, psychologists, community workers, community or school nurse, family support workers, occupational therapists, police and behaviour support teams.
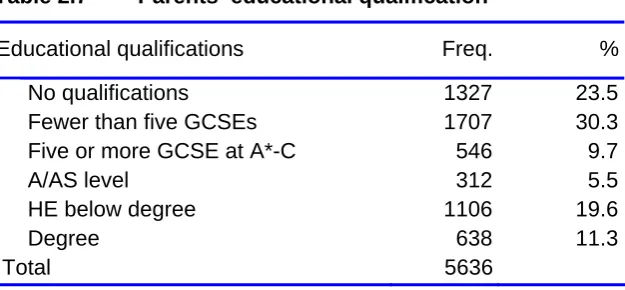
Parents’ highest level of education
[image:27.595.75.388.346.491.2]Just under one-quarter of parents (24%) reported they had no educational qualifications, and around one-third (30%) reported their highest educational qualifications were fewer than five GCSEs (Table 2.7). Relatively few parents reported their highest educational qualification as five or more GCSE at A*-C, or A/AS levels. The sample is therefore skewed to parents with low educational qualifications. However nearly one-third of parents (31%) reported being educated to higher education levels, including 11% who reported their highest educational qualification as a degree. There is clearly strong heterogeneity in the educational levels of the parents involved in the programmes.
Table 2.7 Parents’ educational qualification
Educational qualifications Freq. %
No qualifications 1327 23.5
Fewer than five GCSEs 1707 30.3
Five or more GCSE at A*-C 546 9.7
A/AS level 312 5.5
HE below degree 1106 19.6
Degree 638 11.3
Total 5636
Note: 507 missing cases
Parent ethnicity
The majority of parents (81%) were of White British ethnicity (Table 2.8). The largest minority groups were Asian groups (Indian, Pakistani, Bangladeshi, Other Asian) who constituted 8.2% of the sample and Black groups who constituted 4.3% of the sample.
Table 2.8 Parents’ ethnicity
Ethnic group Frequency % UK Census
2001
White 4992 83.3 92.1
White British 4840 80.7 na
White Irish 35 .6 na
Traveller-Irish Heritage 1 .0 na
Gypsy/Roma 9 .2 na
Any other white group 107 1.8 na
Mixed heritage 161 2.7 1.2
Mixed White and Black Caribbean 74 1.2 na
Mixed White and Black African 22 .4 na
Mixed White and Asian 30 .5 na
Any other mixed background 35 .6 na
Asian 491 8.2 4.0
Indian 138 2.3 1.8
Pakistani 182 3.0 1.3
Bangladeshi 131 2.2 0.5
Any other Asian group 40 .7 0.4
Black 256 4.3 2.0
Black Caribbean 100 1.7 1.0
Black African 148 2.5 0.8
Any other Black group 8 .1 0.2
Chinese 7 .1 0.4
Any other ethnic group 88 1.5 0.4
Total 5995 100.0 100.0
Note: 148 missing cases. na = not applicable
Relative to the UK 2001 census, minority ethnic groups are over-represented, constituting 19.3% of the sample but only 7.9% of the national population. However this is likely to reflect (i) the higher minority ethnic population among the younger generations, particular for those with young families, and (ii) the high proportion of the sample drawn from greater London where minority ethnic groups are particularly concentrated. For example it is notable that in the LA with the largest number of returns, minority ethnic parents constituted 84% of the sample.
2.3.2 Parent mental well-being and parenting skills
Parent mental well-being
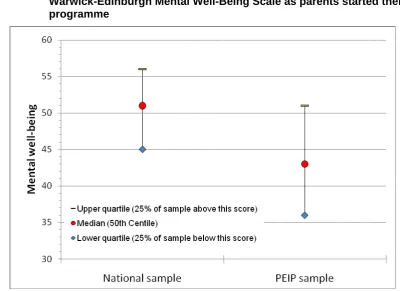
Parental mental well-being is a protective factor for child outcomes. The Warwick-Edinburgh Mental Well-Being Scale (WEMWBS) provides an indication of the mental well-being of the parents as they started their parenting group. It comprises 14 items scored from 1 (none of the time) through to 5 (all of the time). Examples are: ‘I’ve been feeling good about myself’; ‘I’ve been feeling useful’. A WEMWBS score was calculated where at least 12 of the 14 items were completed. The measure was highly reliable with a Cronbach’s alpha of 0.9311. High scores represent greater mental well-being. Normative data are available from Tennant et al. (2007) based on 1,749 respondents in the September 2006 wave of the Scottish Health Education Population Survey (HEPS) and the 2006 “Well? What do you think?” Scottish survey on attitudes to mental health, mental well being and mental health problems.
The PEIP sample scored significantly below the national population norms as they started their parenting programme (Figure 2.1). For the PEIP sample the median score was 43 (inter-quartile range 36 to 51) while for the national standardisation the median score was 51 (inter-quartile range 45-56)12. Thus approximately 75% of the PEIP parents score below the national median on mental well-being, a substantial difference.
11
Cronbach’s alpha is a measure of the internal consistency of the scale.
12
. The mean WEMWBS score for the PEIP sample was 43.1, SD=10.9, n=5916. The median and inter-quartile range are reported in the text because this is how the national norms are reported.
Figure 2.1: Comparison of median and inter-quartile range for scores on the Warwick-Edinburgh Mental Well-Being Scale as parents started their programme
Parenting laxness and parental over-reactivity
Parenting style is a predictor of child outcomes. The Parenting Scale (Irvine, Biglan,
Smolkowski & Ary, 1999) was used to identify parenting style. Two dimensions of parenting, parental laxness and parental over-reactivity, are identified with each measured by six items on a 7-point scale, range 6-42. For example, a parent responds to this laxness item ‘If my child gets upset when I say “No”’, by choosing on a 7 point scale from ‘I back down and give into my child’ to ‘I stick to what I said’. The thirteenth item on monitoring the child’s activities does not contribute to these two dimensions but is included in the total score range 13-91).
Scale scores were created where there were responses to at least five of the six items. Both measures were of good reliability with a Cronbach’s alpha of 0.78 for the Parenting Laxness scale and 0.74 for the Parental over-reactivity scale. Consistent with the original scale, items are scored so that high scores indicate less effective disciplinary practices. The correlation between the parenting laxness score and the parenting over-reactivity scores was significant but of a relatively small magnitude (r = .33, n = 5770, p < .0005). The two scales are
therefore measuring different aspects of parenting style. The pre-course mean scores on the parenting measures are given in Table 2.9.
[image:30.595.95.496.90.381.2]Table 2.9 PEIP pre-course parenting scores
Parenting Measure Mean SD13 N
Parenting Laxness score 21.6 7.2 5,869 Parenting Over-reactivity score 22.4 6.9 5,856 Parenting total score 46.9 12.1 5,818
2.4 Child characteristics
• The children about whom their parent had most concern were:
o mainly boys (61%: 39%), of mean age 8.6 years.
o over four times more likely than national average to have a statement of special educational needs
o six times more likely to have significant behavioural difficulties than the national population.
2.4.1 Demographics
Child gender
Parents were asked the gender of the child about whom they were most concerned. A majority (3539 or 61.3%) were boys compared to 2234 (38.7%) girls.
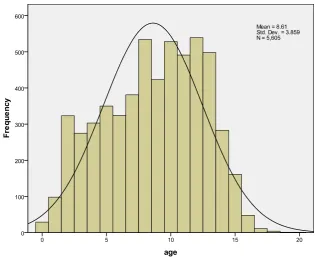
Child age
Child’s age was missing for quite a large proportion (8.8%) of the sample. For those parents who did report the child’s age, the mean age was 8.6 years (SD 3.9 years). However only just over half (54%) were in the PEIP target 8-13 age range. Relatively few were aged 14 or above (9%) but over one-third (37%) were aged 7 or below (Table 2.10). This indicates that LAs prioritised the PEIP target age range but also included younger children.
Table 2.10 Child age
Age range Frequency %
0-7 years 2083 37.2
8-13 years 3013 53.8
14+ years 509 9.1
Total 5605 100.0
Missing cases 538.
13
SD: standard deviation, a measure of distribution of the scores
Figure 2.2: Age distribution of target child
Special Educational Needs
Over 1 in 10 parents (11.5%) reported that their child had a statement of special educational needs SEN (Table 2.11). This compares to a national figure of 2.7% (DfE, 2010).
Table 2.11 Prevalence of special educational needs
SEN Frequency %
No 5435 88.5
Yes 708 11.5
Total 6143 100.0
Educational support
[image:32.595.140.456.89.346.2]Nearly one-third (32%) of parents reported that their child was receiving extra support (Table 2.12).
Table 2.12 Prevalence of additional educational support
Educational support Frequency %
No 4198 68.3
Yes 1945 31.7
Total 6143 100.0
In answer to an open-ended question to specify the extra support, a wide range of support was mentioned: teaching assistants, one-to-one support in the classroom/school, anger
management, booster classes, counselling, dyslexia / dyscalculia, home tutoring, learning mentors/support and nurture classes / groups.
Entitlement to a Free School Meal (FSM)
Just under half (49%) of the children were entitled to a free school meal, more than three times the national average of 16% (Strand, 2010).
Table 2.13 Entitlement to free school meals (FSM)
FSM status Frequency %
Not entitled FSM 3141 51.1
Entitled FSM 3002 48.9
Total 6143 100.0
2.4.2 Child Behaviour (Strengths and Difficulties Questionnaire)
The parents rated the behaviour of their target child on the Strengths and Difficulties Questionnaire (SDQ). The SDQ provides four scales representing separate problems: Emotional symptoms; Conduct Problems; Hyperactivity and Peer Problems. These four scales are summed to provide a Total Difficulties score. In addition there is a five item Prosocial scale that measures positive behaviours and an Impact scale which measures the extent of the impact of the child’s difficulties on the family, school and wider community.
A mean score for each SDQ scale was calculated where at least four of the five items had been completed for a case. The SDQ total difficulties score was created by summing the four problem scales where four valid scores existed. SDQ scores could be calculated from the ratings of 5702 of the 6143 parents. Of the parents where scores could not be
calculated, around one-third had not completed any of the SDQ questions and the rest had completed fewer than 20 of the 25 SDQ items.
Reliability estimates were calculated using Cronbach’s alpha. Peer problems had lower reliability (.62) but all other scales were at least 0.70 or above. These indicate high reliability given they are short scales with only five items per scale. The Total Difficulties scale has the greatest reliability (0.83) and this measure should be preferred in any modelling of change or improvement, where measurement reliability is an important concern. The SDQ Total
Difficulties score was also normally distributed, making it particularly robust for parametric statistical analysis.
Comparison to national norms
Mean SDQ problem scale scores for the PEIP sample were significantly higher than the national average, and the prosocial score was significantly below the national average (Table 2.14). Not only were these differences statistically significant they were also
extremely large. The last column expresses the difference in mean score between the PEIP sample and the national average in terms of the standard deviation of the national sample. The PEIP sample differed by well over a whole standard deviation from the national average in all cases and substantially more for conduct problems (1.7 SD) and the Impact of the child’s difficulties (2.4 SD).
Table 2.14 Comparison of PEIP sample against the national average: SDQ mean scores
PEIP National
average
SDQ scale N Mean SD Mean SD
Difference (SD Units)
Emotional Symptoms 5,871 3.8 2.6 1.9 2.0 1.0 Conduct problems 5,856 4.5 2.5 1.6 1.7 1.7
Hyperactivity 5,840 6.3 2.7 3.5 2.6 1.1
Peer problems 5,851 3.3 2.3 1.5 1.7 1.1
Prosocial scale 5,891 6.4 2.3 8.6 1.6 -1.4 Total Difficulties 5,702 17.9 7.3 8.4 5.8 1.6
Impact score 5,778 3.0 2.9 0.4 1.1 2.4
Notes: National norms are drawn from interviews with the parents of a nationally representative sample of 10,298 pupils aged 5-15 (see Meltzer et al., 2000)
SDQ classifications
Another way of comparing the PEIP sample to national averages is by classifying the SDQ continuous scores as normal, borderline and abnormal, using the published cut scores (available from http://www.sdqinfo.com/b1.html). The results for the PEIP sample are given in Table 2.15 alongside the national averages and in Figure 2.3 for the three main child measures: SDQ Conduct problems, Total Difficulties and Impact.
Approximately 57% of PEIP children had substantial behaviour problems (classified as
‘abnormal’ on the SDQ Total Difficulties scale), compared with the national average of just under 10%. A similar pattern of over-representation was observed for all four problem
scales.
Table 2.15 Comparison of PEIP sample against the national average: SDQ classifications
% Normal % Borderline % Abnormal SDQ measure National PEIP National PEIP National PEIP Emotional symptoms 80.8 48.8 7.8 12.7 11.4 38.5
Conduct problems 76.4 23.0 10.9 14.8 12.7 62.2
Hyperactivity 77.9 39.0 7.4 12.6 14.7 48.4
Peer problems 78.0 40.0 10.2 15.7 11.7 44.3
SDQ Total Difficulties 82.1 28.8 8.2 14.5 9.8 56.7
Prosocial scale 95.0 65.1 2.7 15.5 2.3 19.4
SDQ Impact 83.4 27.6 7.8 11.2 8.8 61.2
Note: For sample size see Table 2.14.
Figure 2.3 Comparison of PEIP sample against the national average: SDQ
‘abnormal’ scores
0
10
20
30
40
50
60
70
Conduct
problems Total
Difficulties
Impact
National
PEIP
2.5 Measuring pre-course to post-course change
• 53.5% of parents completed post-course questionnaires
• Non-responders did not differ substantially from those that did respond in terms of
pre-course scores
• Parents who did not complete their programme were more likely to be single parents,
to have lower mental well-being and higher parenting laxness, as they started their programme.
In order to measure the impact of the programmes we need to measure changes on our measures between pre- and post-course. This is complicated by parents dropping out of their programme. The question arises – are these parents different from those who completed? If there are significant differences there is a danger of over- (or under-) estimating the effects of the programmes.
As with the Pathfinder, we know that we did not receive all post-course questionnaires, for several reasons: some parents left the programme but in other cases there were
administrative problems, e.g. the parents completed the programme but were not given the questionnaire or we did not receive their responses.
In this section we examine the overall response rate and that for each programme. We then go on to explore reasons for non-responses. We examine whether the non-responders (for whatever reason) differ from the responders and also compare those parents we know dropped out from those that responded.
2.5.1 Post-course booklet return rate
Of the 6143 parents who completed pre-course booklets, 3325 (53.5%) returned post-course booklets (Table 2.16). Facilitators were asked to report on the reason for parent non-
completion of post-course booklets and for 16% of parents the facilitator provided a reason. These included (a) the parent did not complete the programme or only completed a limited number of sessions (12%) (b) the parent completed the programme but declined to complete the booklets (1%) or (c) the parent did not complete the booklet for some other reason (2%) (e.g. transferred to another group, moved away from the area, parent ill health, sick child or got job).
For a large proportion of parents (31%) there was no facilitator’s report from the group, so reasons for non-completion are not known. However it seems likely that this reflects issues of administration at the group level, rather than individual parent non-response. We can get an indication of this by analysing the group level data. Pre-course data were drawn from a total of 860 PEIP groups (average group size was 7.2, SD = 3.3, range 1-22). Post-course booklets were received for all parents in 132 groups and from one or more parents in 547 groups. However there were 181 groups where no post-course booklets at all and no facilitator form were returned.
This suggests a substantial proportion of the non-response (19%) is due to administrative problems at the group level rather than parent drop-out (Table 2.16). It is important to note,
therefore, that ‘drop out’ cannot be calculated simply as those who did not respond, i.e. 100% - 53.5% which gives 46.5%. We know 12% dropped out but there are likely to be drop outs from the groups where facilitators did not supply a reason or there was no response at all from a group (Table 2.16). The data from LAs reported in Section 5 indicate a reasonable estimate is a drop out of about a quarter, as the 15 LAs in the cost effectiveness study report an average of 73% completion rate.
Table 2.16 Pattern of response at post-course
Post-course response Frequency %
Responded 3325 53.5
Did not complete programme 722 11.8
Declined booklet 84 1.4
Other reason 126 2.1
Facilitator did not specify reason 748 12.2
Whole group non-response 1138 18.5
Total 6143 100.0
In terms of valid post-course data, 3319 parents (52% of the pre-course sample) provided useable data for at least one or more of the scales. The actual number of valid cases varied across the measures, from 3199 (SDQ Total Difficulties) to 3265 (Parent Mental Well-Being).
2.5.2 Do those responding to the post-course differ from non-responders?14
In this section we compare the responders against all the 46.5% of parents who were non-responders at post-course. In the next section we compare non-responders with those parents known to have dropped out.
There were some significant differences between post-course non-responders and
responders in demographic characteristics. Those who did not respond at post-course were more likely to be socio-economically disadvantaged than responders: specifically they were more likely to have no educational qualifications (28% vs . 20%, p < .001) less likely to own their own property (28% vs. 35%, p < .001), more likely to have a child entitled to FSM (52% vs. 47%, p < .001), and more likely to be from single parent families (47% vs 42%, p < .001). There were no significant differences in terms of parent gender or ethnicity, or child age, gender or SEN.
14
We use the term ‘non-responders’ to describe parents for whom we received pre-course
questionnaires but no post-course questionnaires. As explained in the previous section, this group comprises those who actually dropped out and those where there was an administrative error.