NATIVE MILK FAT GLOBULE
MEMBRANE DAMAGE
-MEASUREMENT AND EFFECT OF
MECHANICAL FACTORS IN MILK
POWDER PROCESSING
OPERATIONS
A thesis presented in partial fulfilment of the requirements for the
degree of Doctor of Philosophy in Food Technology at Massey
University
Mark Downey
"Trust in the LORD with all your heart
and lean not on your own understanding;
in all your ways acknowledge him,
and he will make your paths straight.
"
The Bible: Proverbs, chapter 3 verses 5-6
Abstract
The goal of this work was to measure native milk fat globule membrane (NMFGM) damage in a number of processing operations within the milk powder manufacturing process.
Analysis of the literature showed that NMFGM damage was not well understood, particularly as caused by processing operations within factories. Reliable methods of measuring NMFGM damage were not available; current methods had limited scope or were qualitative in nature. In the highly mechanised dairy industry, damage to the NMFGM can lead to serious quality and financial losses owing to consequences such as lipolysis and creaming. The aims of this work were to develop new techniques for measuring NMFGM damage, and to use these in assessing the effects of a number of operations within the milk powder process.
The majority of time was spent on developing two new tests, the selective lipolysis (SLl) test and the particle size zoning (PSZ) test. The SLl test measures a chemical consequence ofNMFGM damage, that is the production of free fatty acids (FFAs). The PSZ test measures a physical consequence ofNMFGM damage, that is the change in the fat globule size distribution.
Controlled experiments were used to measure NMFGM damage in process operations including pumping, agitation, preheating and evaporation. For these operations, variables such as shear, time, temperature, air inclusion and cavitation were investigated. Surveys of two industrial milk powder plants were also conducted.
The results showed that the SLl and PSZ tests were reproducible, sensitive enough to detect NMFGM damage in a number of process operations, and, together, could give a reasonably comprehensive picture of NMFGM damage. The results of pumping and agitation experiments were consistent with previous research, but were more comprehensive. The effects on measured NMFGM damage of the presence of separated fat in foam or as churned fat have hardly been described by previous workers. Results for the effects of preheating and evaporation on NMFGM damage are new, and challenged the findings of previous research.
The need to improve the flexibility and practicality of the SLI and PSZ tests, so they can be used as widely as possible to gain a comprehensive picture ofNMFGM damage across many dairy processes, was identified. Studies should be made to connect the results of the particle size zoning and selective lipolysis tests with product quality and process efficiency data from industrial sites.
Acknowledgements
I would like to thank my chief supervisor, Dr Tuoc Trinh, for his tenacious and committed input into this work. In particular his assistance in organising my research findings and in the preparation of this manuscript were invaluable. Thanks go to my co-supervisor, Dr Owen McCarthy for his encouragement, practical advice and in helping me improve my writing style. I would also like to thank my co-supervisors, Dr Conan Fee and Mr Brent Prankerd, for their advice and assistance in the early stages of this research.
The first two years of this thesis were largely spent at the Waitoa Dairy Factory. My
thanks to the analytical chemistry team and the milk powder shift crews who helped me with equipment, and information about the milk powder factory.
At Massey University, I am most indebted to these technical and academic staff:
*
Mr Byron McKillop, who helped build all of my experimental equipment.*
*
*
*
* * *
Mr Garry Radford, who helped me with equipment and ordering of milk.
Mrs Wibah Desai, Mrs Geedha Sivalingam-Reid and Mr Steve Glasgow, chemistry lab technicians who assisted me with the chemicals, and other equipment.
Mr Mark Dorsey, m w1rmg and computation of the Massey University milk processing pilot plant.
Mr Peter Jeffery, Mr Matt Levin and Mr Grant Musgrave who provided computer support, and advice with photographs.
Mr Duncan Hedderley and Mr Alasdair Noble who gave statistical advice. Mr Mike Sahayam and Mr John Palmer for help with microbiology work. Associate Professor Kathy Kitson, for her advice on enzymes.
The staff at Fonterra, Palmerston North were most helpful in the training and provision of equipment with the Malvern Mastersizer, including: Angela Veale, Giao Truong and Amy Yang
A number of postgraduate colleagues helped with the experimental work, including: *
*
* *
*
Richard Croy, who assisted with free fatty acid analysis and experiments at the Pahiatua Dairy Factory.
Hayden Bennett and Andrew Hinton, who helped build the Massey University milk processing pilot plant.
Binh Trinh, who helped with the running of pilot plant. Carol Ma, who helped develop the PSZ test protocol.
Preyas Anantpure and Jun Ji, two postgraduate diploma students who I supervised in carrying out experiments as part of this work.
I am grateful to Mainland products for disrupting their process to provide the raw material for this work, and to the Foundation for Research, Science and Technology for a scholarship.
My special thanks to Mr David Robins and his family for their friendship and support in helping me get to know a new town. David's father, Norm passed away during the course of this thesis, and I wish to honour his memory.
This thesis would not have been completed without the prayers and encouragement from the above mentioned, colleagues, staff and friends in Morrinsville, Palmerston North and Japan, and also my family. Thank you all.
Table of Contents
ABSTRACT ....... ill
ACKNOWLEDGEMENTS ... V
TABLE OF CONTENTS ... VD
LIST OF FIGURES ... XII
LIST OF TABLES ... :x.x::rv
LIST OF ABBREVIATIONS ... XXVDI
1.0 INTRODUCTION ... 1
2.0 LITERATURE REVIEW ....... 5
2.1 INTRODUCTION ... 5
2.2 MEASUREMENT OF NMFGM DAMAGE ... 6
2.2.1 Direct measurement of NMFGM damage ....... 7
2.2.2 Consequences of NMFGM damage ................. 8
2.2.3 Tests based on chemical consequences of NMFGM damage ... I 2 2.2.4 Tests based on physical consequences of NMFGM damage ... 21
2.3 FACTORS AFFECTING NMFGM DAMAGE ... 25
2. 3. I Enzymatic Factors ................................................ 2 5 2. 3. 2 Compositional and structural factors ....... 3 I 2.3.3 Process-related factors ............... 32
2.3.4 Chemical and physical/actors ............. 35
2.4 PROCESS OPERATIONS WHJCHAFFECTNMFGMDAMAGE ... 36
2.4.1 Pumping ......................................................... 36
2.4.2 Agitation ........... 39
2.4.3 Homogenisation ....................... 43
2.4.4 Impact of temperature history ................... 44
2.5 lNDUSlRJAL DAIRY APPLICATIONS INVOLVING MILK FAT GLOBULE MEMBRANE DAMAGE ... 44
2. 5. I Milk handling ................................ 45
2.5.2 Milking ..................................................... 46
2.5.3 Milk heating ........ 50
2.5.4 Homogenisation ................................... 50
2.6 CONSEQUENCES TO TI-IE FINAL PRODUCT ... 51
2.6.1 Milk and Cream .............................................. 51
2.6.2 Other Dairy Products ......................... 53
2.7 CONCLUSION ... 54
3.0 MATERIALS AND METHODS ... 57
3 .1 MEASUREMENT OF THE CHEMICAL CONSEQUENCES OF NMFGM DAMAGE ... 5 7 3. 1. 1 Terminology ................................. 58
3.1.2 A new testfor measuringfreefatty acids from UPF ................. 61
3. 1.3 Protocol for measuring fatty acids from UPF ...... 66
3. 1 .4 Experiments to develop the selective lipolysis test ......... 72
3.2 MEASUREMENT OF THE PHYSICAL CONSEQUENCES OF NMFGM DAMAGE ... 79
3.2.1 Background .............................................. 79
3.2.2 Protocol of the PSZ test .................... 82
3.2.3 Experiment on sample handling in the PSZ test ............... 87
3.3 VALIDATION OF TI-IE SELECTIVE LIPOLYSIS AND PSZ TESTS ... 87
3.4 ASSESSMENT OF MECHANICAL FACTORS AFFECTING NMFGM DAMAGE ... 89
3. 4.1 RaH1 material ...................... 91
3. 4. 2 Agitation rig ... 9 2 3.4.3 Large-volume pumping rig. .... 97
3.4.4 Contribution of the pump to NMFGM damage ................. 102
3.4.5 Contribution of the pipeline to NMFGM damage ................ 104
3.4.6 Contribution of valves to NMFGM damage ............................... 106
3. 4. 7 Contribution of direct and indirect heaters to NMFGM damage ............ 108 3.4.8 Contribution of evaporation to NMFGM damage ................ 114
3.5 INDUSTRIAL SURVEY ... 115
4.0 MEASUREMENT OF NMFGM DAMAGE ... 121
4 .1 SELECTIVE LIPOL YSIS TEST ... 121
4. 1 .1 Variables measured .................... 121
4. 1 .2 Uncertainties of measurement ..................................... 123
4.1.3 SLFA as a measurement ofNMFGM damage ....... 128
4. 1 .4 Sensitivity of the selective lipolysis test .................... 130
4.1. 5 Effect of preservatives on the FF A tests ... 131
4.1. 6 Effect of microbial contamination on the measurement of FF As ..... 135
4.1. 7 Limitations of the selective lipolysis test .................... 13 7 4.2 PARTICLE SIZE ZONING TEST ... 140
4. 2.1 Uncertainties of measurement ................................. 14 2 4.3 SAMPLE HANDLING ... 145
4. 3.1 Damage during sampling ................................... 145
4.3.2 Creaming of the sample during storage ............................. 146
4.3.3 Representative sampling ......................................... 149
4.4 DEVELOPMENT OF THE SL2 TEST ... 160
4.5 COMPARISON BETWEEN DIFFERENT TEST MEASUREMENTS OF N1v1FGM DAMAGE ... 162
4.6 CONCLUSION ... 166
5.0 MECHANICAL FACTORS AFFECTING NMFGM DAMAGE ... 168
5 .1 PUMPING EXPERIMENTS ....... 169
5.1.1 Re-circulation of Farmhouse milk with and without air inclusion and splashing ................................. 169
5.1.2 Effect of pumping temperature .............................. 176 5.1. 3 Effect of pump speed ....................... 182 5.1.4 Effect of shear rate ... 185 5.1. 5 Effect of valve cavitation ........................ 188
5 .2 HEATING EXPERIMENTS ... 194
5.2.1 Changes in FFAs upon heating ............... 195
5.2.2 Changes in particle size distribution upon heating ....... 199
5.3 AGITATION EXPERIMENTS ... 203
5.4 EVAPORATION EXPERIMENTS ... 218
5.5 CONCLUSION ... 221
6.0 INDUSTRIAL SURVEY OF NMFGM DAMAGE IN MILK POWDER PLANTS ... 223
6.1 INTRODUCTION ... 223
6.2 RESULTS ... 224
6.3 CONCLUSION ... 233
7.0 CONCLUSIONS ... 235
7.1 MEASUREMENT OF NMFGM DAMAGE ... 235
7.2 MECHANICAL FACTORS AFFECTING NMFGM DAMAGE ... 237
7.3 INDUSTRIAL SURVEY OF NMFGM DAMAGE IN MILK POWDER PLANTS ... 238
7.4 STRENGTHS AND LL1\1ITATIONS OF PRESENT WORK ... 239
7.5 FURTHER STUDIES ... 239
REFERENCES ... 241
APPENDICES ... 258
APPENDIX A-PROCEDURES ... 258
Al Mojonnier Total Fat Test - (AACC 30-10) ... 258
A2 Solvent Extraction Free Fat Test - based on Fang (1998), used in runs T06-09 ... ... 260
A3 Solvent Extraction Free Fat Test - Fang (1998), used in runs T28-30, C97-106 ... 261
A4 Lipolysable Free Fat test - based on Fang (]998) ... 262
APPENDIX B - REAGENTS AND EQUIPMENT USED ... 263
Bl Technical Characteristics of Pig Pancreatic Lipase ... 263
B2 Walstra Solution A preparation method (Walstra, 1965) ... 264
BJ Bro no pol preservative specifications ... 265
B4 Sodium Azide preservative ,specifications ... 266
B5 Pilot plant direct steam injection unit (cross section) ... 267
APPENDIX C SAMPLE CALCULATIONS ... 268
CJ Sample calculationfor the selective lipolysis test ... 268
C2 Sample calculation for adjusting basis of selective lipolysis test (e.g. for concentrated milk samples) ... 270
CJ Sample calculation for combining liquid and churned fat/foam phase portions measured by the selective lipolysis test ... 27 3 C4 Sample calculation for combining liquid and churned fat/foam phase portions measured by the free fat test ... 2 7 6 C5 Sample calculation for converting the total churnedfat(foam phase into FF As ... 278
C6 Sample particle size distribution analysis from Mastersizer E ... 280
C7 Sample calculationfor particle size zoning (PSZ) test ............ 281
C8 Sample spreadsheet for PSZ test .... 285 C9 Reproducibility of pumping rigs - Repeated measures analysis of
variance ....................................................................................... 287
APPENDIX D-EXPERIMENTAL RUNS ... 288
List of Figures
Figure Figure Description Page
2.1 Generalised description of emulsion stability in milk; highly schematic.
After Walstra et al. (1999). 10 2.2 Confocal microscope slide showing coalescence (A) and flocculation
(B, C) of milk fat globules after unhomogenised, pasteurised, 4% fat
milk was passed through a cavitating centrifugal pump (Fang, 1998). 11 2.3 Diagram illustrating concept of "free fat" in forming a "clump" of
diameter d2 by linkages of free fat between individual fat globules.
From Fink & Kessler (1983). 21 2.4 Diagram of molecular conversion of a triacylglycerol molecule into
FFAs. The subscripts 1,2 and 3 represent the sn-1, sn-2 and sn-3 fatty
acid chains. Adapted from Chen et al. (2003). 26
2.5 Variations of the basic scheme for lipolysis. Symbols: E, enzyme in
solution; Ect, denatured enzyme; E*, activated enzyme; Ea, adsorbed enzyme; C, protein cofactor; Ca, adsorbed protein cofactor; S, substrate;
P, products. Adapted from Brockman (1984). 27
2.6 Interactions between an oil droplet (0) and the air-water (AW)
interface, as a function of the spreading pressure, Ps, (y
=
interfacialtension). Interfacial adsorption layers ( e.g. NMFGM) are shown by the heavy lines. The bottom row shows a fat globule approaching a newly
formed plasma-air interface. From Mulder & Walstra (1974). 34 2.7 Schematic of pipeline milking system. Reproduced from Woolford
(1993). 47
3.1 Three measurements ofFFAs from a pasteurised, unhomogenised milk sample: Fresh sample (OF A), sample incubated at 3 7°C for 6 hours
(IF A) and sample with a selective enzyme (pig pancreatic lipase, PPL)
added and then incubated at 37°C for 6 hours (SLFA). 66
3.2 Example ofVacutainer system used in the New Zealand dairy industry. 73
Figure Figure Description Page 3.3 Typical particle size distribution for pasteurised, unhomogenised
standardised 4% fat milk (undamaged), and a distribution showing
evidence of native milk fat globule membrane damage (damaged). The
Malvern Mastersizer E, particle sizing machine was used to obtain this
data. 81
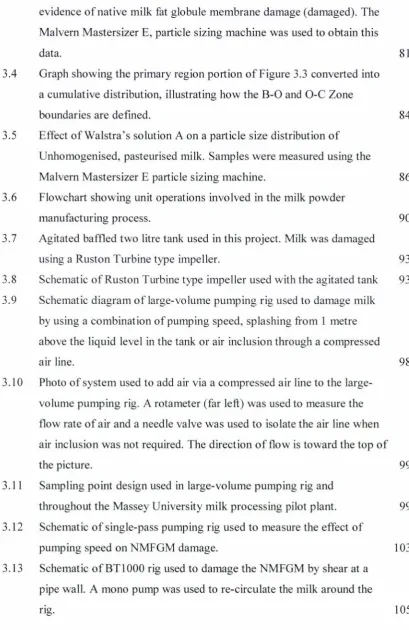
3.4 Graph showing the primary region portion of Figure 3.3 converted into
a cumulative distribution, illustrating how the B-O and O-C Zone
boundaries are defined. 84
3.5 Effect ofWalstra's solution A on a particle size distribution of
Unhomogenised, pasteurised milk. Samples were measured using the
Malvern Mastersizer E particle sizing machine. 86
3.6 Flowchart showing unit operations involved in the milk powder
manufacturing process. 90
3.7 Agitated baffled two litre tank used in this project. Milk was damaged
using a Ruston Turbine type impeller. 93
3.8 Schematic of Ruston Turbine type impeller used with the agitated tank 93
3.9 Schematic diagram of large-volume pumping rig used to damage milk
by using a combination of pumping speed, splashing from 1 metre
above the liquid level in the tank or air inclusion through a compressed
air line. 98
3.10 Photo of system used to add air via a compressed air line to the
large-volume pumping rig. A rotameter (far left) was used to measure the
flow rate of air and a needle valve was used to isolate the air line when
air inclusion was not required. The direction of flow is toward the top of
the picture. 99
3.11 Sampling point design used in large-volume pumping rig and
throughout the Massey University milk processing pilot plant. 99
3.12 Schematic of single-pass pumping rig used to measure the effect of
pumping speed on NMFGM damage. 103
3.13 Schematic ofBTl000 rig used to damage the NMFGM by shear at a
pipe wall. A mono pump was used to re-circulate the milk around the
ng. 105
Figure Figure Description Page
3.14 Schematic of small-volume re-circulation rig used to test the effect of
valve cavitation on NMFGM damage. 107
3.15 The Massey University milk processing pilot plant. (Bennett, 2000;
Croy, 2000). 110
3.16 Schematic of Massey University 3-effect falling film evaporator used in
runs C71-73. 115
3.17 Schematic of evaporator in Powder 1 at the Pahiatua dairy factory, a
5-effect thermal vapour recompression evaporator. Each letter refers to a
sample point used in this work (Table 3.21). 118
3.18 Schematic of evaporator in Powder 2 at the Pahiatua dairy factory, a
2-effect mechanical vapour recompression evaporator. Each letter refers
to a sample point used in this work (Table 3.21). 119
4.1 Example of typical FFA values obtained using the SLl test. Run (T29)
with commercially pasteurised, unhomogenised, standardised 4% fat
(Farmhouse) milk re-circulated around a pumping rig with a 2800 rpm
Fristam centrifugal pump. Error bars indicate the uncertainty in
duplicate samples. 122
4.2 Example of typical original fatty acid (OF A), incubation fatty acid
(IF A) and selective lipolysis fatty acid (SLF A) values. Run (T28) with
the same experimental conditions as described in Figure 4.1. 123
4.3 Reproducibility of FF A tests used in this work. Columns show the
median and average absolute uncertainty in the measurement. Results
were calculated from sample populations (from left to right) of 92
(LFF), 73 (SLl ), 23 (IF A) and 18 (OFA) averages of duplicate samples. 125
4.4 Reproducibility of the LFF and SLl tests. Columns show the k-th
percentile absolute uncertainty in the each measurement technique.
Values were calculated from sample populations of 92 and 73 averages
of duplicate samples, respectively. 126
4.5 Reproducibility of FF A tests used in this work. Columns show the
median and average percentage uncertainty in the measurement. Results
were calculated from sample populations (from left to right) of 92
(LFF), 73 (SLl), 23 (IFA) and 18 (OFA) averages of duplicate samples. 127
Figure Figure Description Page
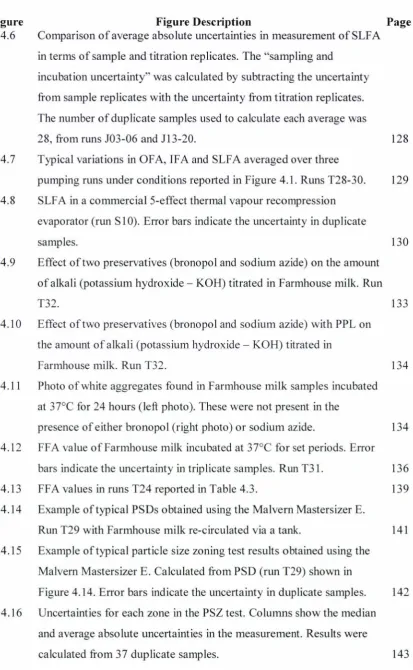
4.6 Comparison of average absolute uncertainties in measurement of SLF A in terms of sample and titration replicates. The "sampling and
incubation uncertainty" was calculated by subtracting the uncertainty from sample replicates with the uncertainty from titration replicates. The number of duplicate samples used to calculate each average was
28, from runs 103-06 and 113-20. 128 4.7 Typical variations in OF A, IF A and SLF A averaged over three
pumping runs under conditions reported in Figure 4.1. Runs T28-30. 129 4.8 SLF A in a commercial 5-effect thermal vapour recompression
evaporator (run S 10). Error bars indicate the uncertainty in duplicate
samples. 130
4.9 Effect of two preservatives (bronopol and sodium azide) on the amount of alkali (potassium hydroxide - KOH) titrated in Farmhouse milk. Run
T32. 133
4.10 Effect of two preservatives (bronopol and sodium azide) with PPL on the amount of alkali (potassium hydroxide - KOH) titrated in
Farmhouse milk. Run T32. 134 4.11 Photo of white aggregates found in Farmhouse milk samples incubated
at 3 7°C for 24 hours (left photo). These were not present in the
presence of either bronopol (right photo) or sodium azide. 134 4.12 FFA value of Farmhouse milk incubated at 37°C for set periods. Error
bars indicate the uncertainty in triplicate samples. Run T31. 136 4.13 FFA values in runs T24 reported in Table 4.3. 139 4.14 Example of typical PSDs obtained using the Malvern Mastersizer E.
Run T29 with Farmhouse milk re-circulated via a tank. 141 4.15 Example of typical particle size zoning test results obtained using the
Malvern Mastersizer E. Calculated from PSD (run T29) shown in
Figure 4.14. Error bars indicate the uncertainty in duplicate samples. 142 4.16 Uncertainties for each zone in the PSZ test. Columns show the median
and average absolute uncertainties in the measurement. Results were
calculated from 37 duplicate samples. 143
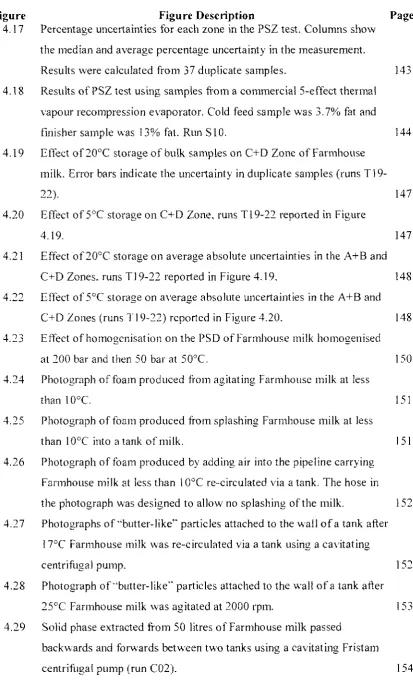
Figure Figure Description Page 4.17 Percentage uncertainties for each zone in the PSZ test. Columns show
the median and average percentage uncertainty in the measurement.
Results were calculated from 37 duplicate samples. 143
4.18 Results of PSZ test using samples from a commercial 5-effect thermal
vapour recompression evaporator. Cold feed sample was 3. 7% fat and
finisher sample was 13% fat. Run S10. 144
4.19 Effect of20°C storage of bulk samples on C+D Zone of Farmhouse
milk. Error bars indicate the uncertainty in duplicate samples (runs
Tl9-22). 147
4.20 Effect of 5°C storage on C+D Zone, runs Tl9-22 reported in Figure
4.19. 147
4.21 Effect of 20°C storage on average absolute uncertainties in the A+B and
C+D Zones, runs Tl 9-22 reported in Figure 4.19. 148
4.22 Effect of 5°C storage on average absolute uncertainties in the A+B and
C+D Zones (runs Tl9-22) reported in Figure 4.20. 148
4.23 Effect of homogenisation on the PSD of Farmhouse milk homogenised
at 200 bar and then 50 bar at 50°C. 150
4.24 Photograph of foam produced from agitating Farmhouse milk at less
than 10°C. 151
4.25 Photograph of foam produced from splashing Farmhouse milk at less
than l 0°C into a tank of milk. 151
4.26 Photograph of foam produced by adding air into the pipeline carrying
Farmhouse milk at less than 10°C re-circulated via a tank. The hose in
the photograph was designed to allow no splashing of the milk. 152
4.27 Photographs of "butter-like" particles attached to the wall of a tank after
17°C Farmhouse milk was re-circulated via a tank using a cavitating
centrifugal pump. 152
4.28 Photograph of "butter-like" particles attached to the wall of a tank after
25°C Farmhouse milk was agitated at 2000 rpm. 153
4.29 Solid phase extracted from 50 litres of Farmhouse milk passed
backwards and forwards between two tanks using a cavitating Fristam
centrifugal pump (run CO2). 154
Figure Figure Description Page
4.30 PSDs of damaged Farmhouse milk producing churned fat. Run CO2. 155
4.31 FF A values using the LFF test from run CO2 reported in Figure 4.30. 156
4.32 Illustration of C+D Zone of milk and foam produced from 10°C
Farmhouse milk. Run T30. 157
4.33 Diagram of the structure of butter at room temperature. From Mulder &
Walstra (1974). Note - membrane thickness has been exaggerated. 159
4.34 Liquid milk sample incubated at 37°C for 6 hours. Note, yellow layer is
liquid fat. 161
4.35 Liquid milk sample shown in Figure 4.34 after homogenisation for 15
seconds. 162
4.36 Comparison between the SLl and SL2 test when measuring liquid milk
samples from Farmhouse milk agitated at various temperatures for 4
minutes at 2000 rpm. SLl data from runs C85-90 and SL2 data from
runs C97-102. 162
4.37 Comparison ofSLFA and FF results for Farmhouse milk subjected to
different durations of re-circulation with a 2800 rpm Fristam centrifugal
pump (runs T28-30). Trend lines show second-order polynomial fits. 164
4.38 Particle size zoning test, C+D Zone results from runs T28-30 reported
in Figure 4.37. Trend line shows a second-order polynomial fit. 165
5.1 Effect of re-circulation of Farmhouse milk using a Fristam centrifugal
pump running at 2800 rpm on the C+D zone. Runs C64, C65, C68 and
C70. Error bars reflect the uncertainty in duplicate samples. 0 time
value averaged for all runs (3 measurements) was 17.1 volume%. 170
5.2 Effect of2800 rpm pumping on the A+B Zone from runs C64, C65,
C68 and C70, reported in Figure 5 .1. Error bars reflect the uncertainty
in duplicate samples. 0 time value averaged for all runs (3
measurements) was 48.7 volume%. 170
5.3 Effect of 1960 rpm pumping on the C+D zone from runs C63, C66, C67
and C69 in the experiment reported in Figure 5.1. Error bars reflect the
uncertainty in duplicate samples. 0 time value averaged for all runs (3
measurements) was 17.1 volume%. 171
Figure Figure Description Page
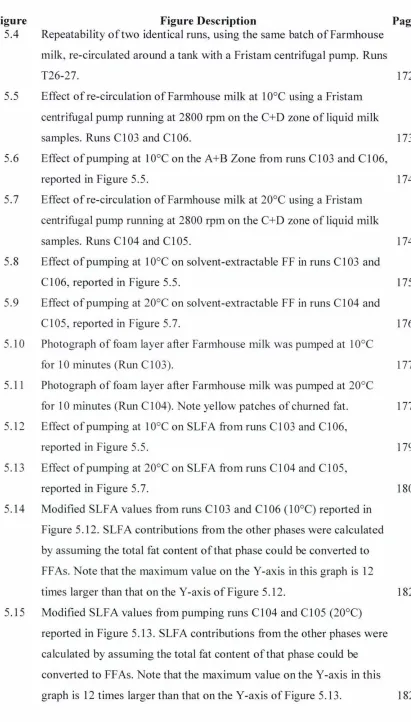
5.4 Repeatability of two identical runs, using the same batch of Farmhouse
milk, re-circulated around a tank with a Fristam centrifugal pump. Runs
T26-27. 172
5.5 Effect ofre-circulation of Farmhouse milk at l 0°C using a Fristam
centrifugal pump running at 2800 rpm on the C+D zone of liquid milk
samples. Runs Cl03 and C106. 173
5.6 Effect of pumping at 10°C on the A+B Zone from runs C103 and Cl 06,
reported in Figure 5.5. 174
5.7 Effect of re-circulation of Farmhouse milk at 20°C using a Fristam
centrifugal pump running at 2800 rpm on the C+D zone of liquid milk
samples. Runs C104 and Cl05. 174
5.8 Effect of pumping at 10°C on solvent-extractable FF in runs Cl 03 and
Cl06, reported in Figure 5.5. 175
5.9 Effect of pumping at 20°C on solvent-extractable FF in runs C 104 and
Cl 05, reported in Figure 5.7. 176
5.10 Photograph of foam layer after Farmhouse milk was pumped at l 0°C
for 10 minutes (Run CI 03). 177
5.11 Photograph of foam layer after Farmhouse milk was pumped at 20°C
for l O minutes (Run C 104). Note yellow patches of churned fat. 177
5.12 Effect of pumping at 10°C on SLFA from runs Cl03 and C106,
reported in Figure 5.5. 179
5.13 Effect of pumping at 20°C on SLFA from runs Cl 04 and C105,
reported in Figure 5.7. 180
5.14 Modified SLFA values from runs C103 and Cl06 (10°C) reported in
Figure 5.12. SLFA contributions from the other phases were calculated
by assuming the total fat content of that phase could be converted to
FF As. Note that the maximum value on the Y-axis in this graph is 12
times larger than that on the Y-axis of Figure 5.12. 182
5.15 Modified SLFA values from pumping runs Cl 04 and Cl05 (20°C)
reported in Figure 5.13. SLFA contributions from the other phases were
calculated by assuming the total fat content of that phase could be
converted to Ff As. Note that the maximum value on the Y-axis in this
graph is 12 times larger than that on the Y-axis of Figure 5.13. 182
Figure Figure Description Page 5.16 Change in PSD due to pump speed of an Anema-Sneek centrifugal
pump (run 102). Control values of A+B and C+D Zone were 49 and 18
volume%, respectively. 184
5.17 Increase in SLF A in run 102, reported in Figure 5.16. Error bars show
the uncertainty in triplicate measurements. Control value was an
average of 0.86 mmol/L. 185
5.18 Increase in SLF A value as a function of shear rate in the BTl 000
pumping rig (runs 108-12). Error bars show the uncertainty in triplicate
measurements. Control SLFA values (mmol/L) of milk not passed
through the rig for each run were 0.86 (550 s·1), 1.24 (1040 s"1), 1.15
(4700 s"1), 1.13 (10100 s·1) and 0.61 (41400 s·1). 187
5.19 PSD changes owing to shear rate in runs 108-12, reported in Figure
5.18. Control values for the A+B Zone were (from left to right for 550,
1040, 4700 and 41400 s·1) 48.6, 47.5, 47.8 and 47.9 volume%,
respectively. Control values for C+D Zone were (from left to right)
17.5, 17.8, 17.6 and 17.5 volume%, respectively. 188
5.20 Cavitation conditions as a function of inlet and outlet pressures for a
valve. Source: (Ross Valve Manufacturing Company Incorporated,
2004). 190
5.21 SLF A values for liquid milk samples of Farmhouse milk re-circulated
around a pumping rig under non-cavitating conditions. Runs PO 1-02.
Cavitation index was 1.9 and 3.9 for the needle and globe valve,
respectively. Error bars indicate the uncertainty in triplicate
measurements. 191
5.22 PSZ test values from runs POl-02, reported in Figure 5.21. 192
5.23 PSZ test values from liquid milk samples of Farmhouse milk
re-circulated around a pumping rig under cavitating conditions. Runs
P03-04. Cavitation index was 0.03 and 0.26 for the needle and globe valve,
respectively. 192
5.24 SLF A values from runs P03-04, reported in Figure 5.23. Error bars
indicate the uncertainty in triplicate measurements. 193
5.25 PSD comparison between samples of liquid milk and foam from runs
P03-04, reported in Figure 5.23. 193
Figure Figure Description Page
5.26 SLF A contribution from liquid and foam samples from runs P03-04,
reported in Figure 5.24. Error bars indicate the uncertainty in triplicate
titrations. 194
5.27 Effect of direct heating with a DSI unit on lipolysable FF (LFF) content
of Farmhouse milk. Runs C08-I I. Vertical error bars indicate the
uncertainty in triplicate titrations. Horizontal error bars indicate random
fluctuations in the controlled temperatures. 195
5.28 Evolution of SLFA with temperature of Farmhouse milk in direct steam
injection heating experiments. Runs C80-84. Error bars show the
uncertainty in duplicate samples. 196
5.29 Effect of heating with a plate heat exchanger on SLFA, IF A and OFA
values ( run T24) in Farmhouse milk. Values in bold show the difference
between the SLF A and IF A value. Error bars indicate the uncertainty in
duplicate samples. 197
5.30 Effect of indirect heating using a plate heat exchanger on A+B and
C+D Zones of PSZ test. Runs C75-84. All inlet milk samples were at
10°C (shown as an average). Error bars show the uncertainty in
duplicate samples. 200
5.31 Effect of direct heating using a direct steam injection unit on A+B and
C+D Zones of PSZ test. Temperatures were measured close to the
sample points. Runs C75-84 reported in Figure 5.27. Error bars show
the uncertainty in duplicate samples. 200
5.32 Effect of pressure difference between the steam line and milk line in
two direct steam injection units on the A+B Zone of Farmhouse milk.
Runs C21-38. Control samples for DSI 1 and 2 were 46.2±0.5 and
45.2±0.3 volume% respectively. Error bars indicate the uncertainty in
duplicate samples. 202
5.33 Effect of milk temperature increase across DSI units on A+B Zone from
runs C21-38, reported in Figure 5.32. Error bars indicate the uncertainty
in duplicate samples. 202
5.34 Effect of agitation time at two temperatures on the A+B Zone of
Farmhouse milk. Runs Tl 9-22 and C54-56. 204
Figure Figure Description
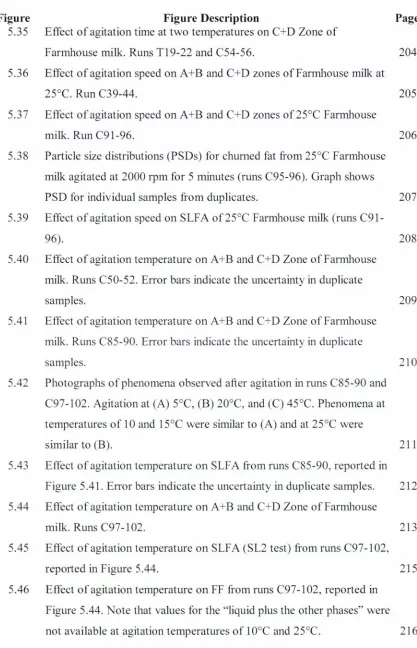
5.35 Effect of agitation time at two temperatures on C+D Zone of
Farmhouse milk. Runs Tl9-22 and C54-56.
5.36 Effect of agitation speed on A+B and C+D zones of Farmhouse milk at
25°C. Run C39-44.
5.37 Effect of agitation speed on A+B and C+D zones of 25°C Famlhouse
milk. Run C91-96.
5.38 Particle size distributions (PSDs) for churned fat from 25°C Farmhouse
milk agitated at 2000 rpm for 5 minutes (nms C95-96). Graph shows
PSD for individual samples from duplicates.
5.39 Effect of agitation speed on SLFA of25°C Farmhouse milk (runs
C91-96).
5.40 Effect of agitation temperature on A+B and C+D Zone of Farmhouse
milk. Runs C50-52. Error bars indicate the uncertainty in duplicate
samples.
5.41 Effect of agitation temperature on A+B and C+D Zone of Farmhouse
milk. Runs C85-90. Error bars indicate the uncertainty in duplicate
samples.
5.42 Photographs of phenomena observed after agitation in runs C85-90 and
C97-102. Agitation at (A) 5°C, (B) 20°C, and (C) 45°C. Phenomena at
temperatures of 10 and l 5°C were similar to (A) and at 25°C were
similar to (B).
5.43 Effect of agitation temperature on SLF A from runs C85-90, reported in
Figure 5.41. Error bars indicate the uncertainty in duplicate samples.
5.44 Effect of agitation temperature on A+B and C+D Zone of Farmhouse
milk. Runs C97-102.
5 .45 Effect of agitation temperature on SLF A (SL2 test) from runs C97- I 02,
reported in Figure 5.44.
5.46 Effect of agitation temperature on FF from runs C97-102, reported in
Figure 5.44. Note that values for the "liquid plus the other phases" were
not available at agitation temperatures of l 0°C and 25°C.
[image:22.556.79.497.52.701.2]Figure Figure Description Page
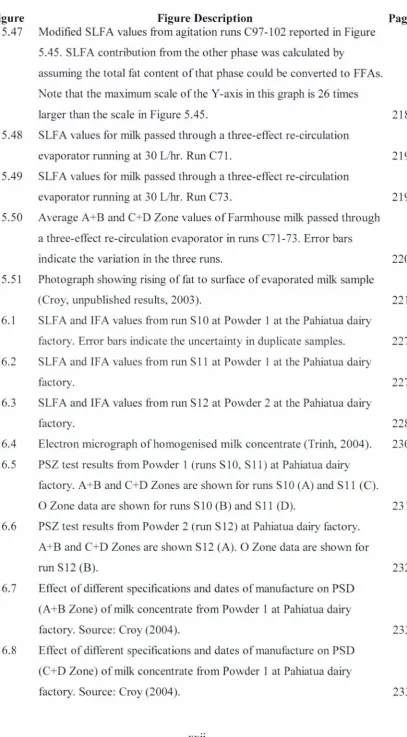
5.47 Modified SLF A values from agitation runs C97-102 reported in Figure
5 .45. SLF A contribution from the other phase was calculated by
assuming the total fat content of that phase could be converted to FF As.
Note that the maximum scale of the Y-axis in this graph is 26 times
larger than the scale in Figure 5.45. 218
5.48 SLF A values for milk passed through a three-effect re-circulation
evaporator running at 30 L/hr. Run C7 I. 219
5.49 SLF A values for milk passed through a three-effect re-circulation
evaporator running at 30 L/hr. Run C73. 219
5.50 Average A+B and C+D Zone values of Farmhouse milk passed through
a three-effect re-circulation evaporator in runs C71-73. Error bars
indicate the variation in the three runs. 220
5.51 Photograph showing rising of fat to surface of evaporated milk sample
(Croy, unpublished results, 2003). 221
6.1 SLF A and IF A values from run S 10 at Powder 1 at the Pahiatua dairy
factory. Error bars indicate the uncertainty in duplicate samples. 227
6.2 SLF A and IF A values from run S 1 I at Powder 1 at the Pahiatua dairy
factory. 227
6.3 SLF A and IF A values from run S 12 at Powder 2 at the Pahiatua dairy
factory. 228
6.4 Electron micrograph of homogenised milk concentrate (Trinh, 2004). 230
6.5 PSZ test results from Powder 1 (runs S 10, S 11) at Pahiatua dairy
factory. A+B and C+D Zones are shown for runs Sl0 (A) and Sl 1 (C).
0 Zone data are shown for runs S 10 (B) and S 11 (D). 231
6.6 PSZ test results from Powder 2 (run S 12) at Pahiatua dairy factory.
A+B and C+D Zones are shown S12 (A). 0 Zone data are shown for
run S12 (B). 232
6.7 Effect of different specifications and dates of manufacture on PSD
(A+B Zone) of milk concentrate from Powder 1 at Pahiatua dairy
factory. Source: Croy (2004). 233
6.8 Effect of different specifications and dates of manufacture on PSD
(C+D Zone) of milk concentrate from Powder 1 at Pahiatua dairy
factory. Source: Croy (2004 ). 233
[image:23.554.85.493.51.789.2]Figure B.1
C.1
C.2
Figure Description
Direct steam injection unit specifications for Massey University milk
processing pilot plant. From Bennett (2000).
Typical output from the Mastersizer E. A control sample (run T29).
Damaged sample output from Mastersizer E (run T29).
XXlll
Page
267
280
Table
2.1
2.2
2.3
2.4
3.1
3.2
3.3
3.4
3.5
3.6
3.7
List of Tables
Table Description
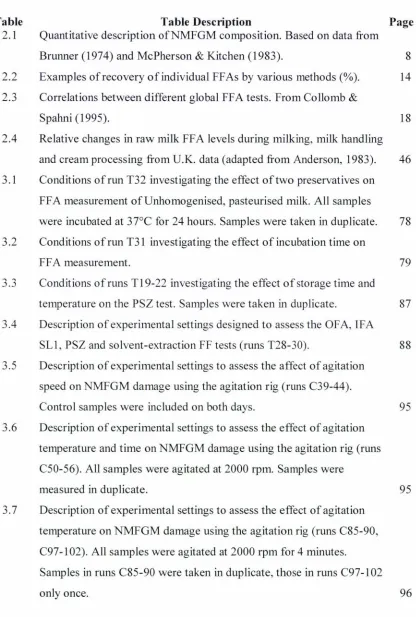
Quantitative description ofNMFGM composition. Based on data from
Brunner (1974) and McPherson & Kitchen (1983).
Examples ofrecovery of individual FF As by various methods(%).
Correlations between different global FF A tests. From Collomb &
Spahni (1995).
Relative changes in raw milk FF A levels during milking, milk handling
and cream processing from U.K. data (adapted from Anderson, 1983).
Conditions of run T32 investigating the effect of two preservatives on
FF A measurement of Unhomogenised, pasteurised milk. All samples
were incubated at 37°C for 24 hours. Samples were taken in duplicate.
Conditions of run T31 investigating the effect of incubation time on
FF A measurement.
Conditions of runs T19-22 investigating the effect of storage time and
temperature on the PSZ test. Samples were taken in duplicate.
Description of experimental settings designed to assess the OF A, IF A
SL 1, PSZ and solvent-extraction FF tests (runs T28-30).
Description of experimental settings to assess the affect of agitation
speed on NMFGM damage using the agitation rig (runs C39-44).
Control samples were included on both days.
Description of experimental settings to assess the effect of agitation
temperature and time on NMFGM damage using the agitation rig (runs
C50-56). All samples were agitated at 2000 rpm. Samples were
measured in duplicate.
Description of experimental settings to assess the effect of agitation
temperature on NMFGM damage using the agitation rig (runs C85-90,
C97- l 02). All samples were agitated at 2000 rpm for 4 minutes.
Samples in runs C85-90 were taken in duplicate, those in runs C97-102
only once.
[image:25.553.84.500.91.708.2]Table Table Description Page
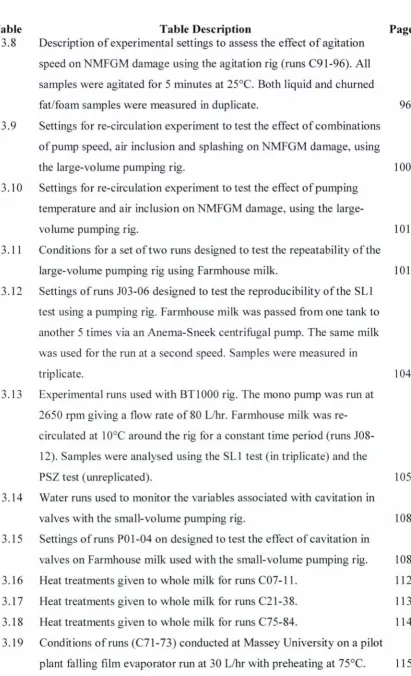
3.8 Description of experimental settings to assess the effect of agitation
speed on NMFGM damage using the agitation rig (runs C91-96). All
samples were agitated for 5 minutes at 25°C. Both liquid and churned
fat/foam samples were measured in duplicate. 96
3.9 Settings for re-circulation experiment to test the effect of combinations
of pump speed, air inclusion and splashing on NMFGM damage, using
the large-volume pumping rig. 100
3.10 Settings for re-circulation experiment to test the effect of pumping
temperature and air inclusion on NMFGM damage, using the large
-volume pumping rig. 101
3.11 Conditions for a set of two runs designed to test the repeatability of the
large-volume pumping rig using Farmhouse milk. 101
3.12 Settings of runs 103-06 designed to test the reproducibility of the SL 1
test using a pumping rig. Farmhouse milk was passed from one tank to
another 5 tin1es via an Anema-Sneek centrifugal pump. The same milk
was used for the run at a second speed. Samples were measured in
triplicate. 104
3.13 Experimenta I runs used with BT 1000 rig. The mono pump was run at
2650 rpm giving a flow rate of 80 L/hr. Farmhouse milk was re
-circulated at l 0°C around the rig for a constant time period (runs
108-12). Samples were analysed using the SLl test (in triplicate) and the
PSZ test (unreplicated). 105
3.14 Water runs used to monitor the variables associated with cavitation in
valves with the small-volume pumping rig. 108
3.15 Settings of runs PO 1-04 on designed to test the effect of cavitation in
valves on Farmhouse milk used with the small-volume pumping rig. 108
3.16 Heat treatments given to whole milk for runs C07-1 l. 112
3.17 Heat treatments given to whole milk for runs C21-38. 113
3.18 Heat treatments given to whole milk for runs C75-84. 114
3.19 Conditions of runs (C71-73) conducted at Massey University on a pilot
plant falling film evaporator run at 30 L/hr with preheating at 75°C. 115
[image:26.555.86.498.43.720.2]Table Table Description Page
3.20 Physical locations of samples taken from the evaporators of Powder 1
and 2 at the Pahiatua dairy factory. Reference numbers are located on
Figures 3.17 (Powder 1) and 3.18 (Powder 2). Sample points were
always located after the pump. 119
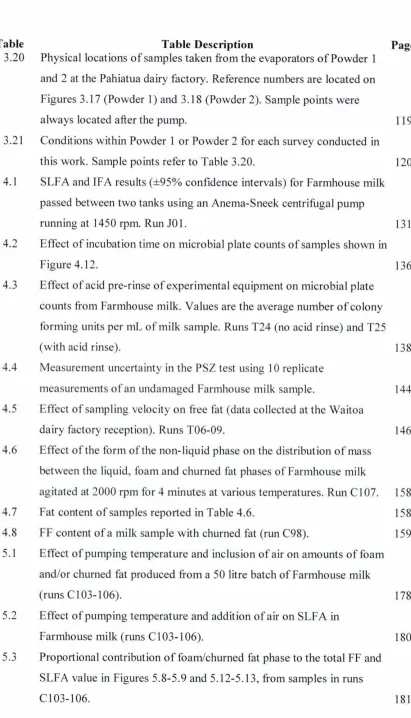
3.21 Conditions within Powder 1 or Powder 2 for each survey conducted in
this work. Sample points refer to Table 3.20. 120
4.1 SLF A and IF A results (±95% confidence intervals) for Farmhouse milk
passed between two tanks using an Anema-Sneek centrifugal pump
running at 1450 rpm. Run JOI. 131
4.2 Effect of incubation time on microbial plate counts of samples shown in
Figure 4.12. 136
4.3 Effect of acid pre-rinse of experimental equipment on microbial plate
counts from Farmhouse milk. Values are the average number of colony
forming units per mL of milk sample. Runs T24 (no acid rinse) and T25
(with acid rinse). 138
4.4 Measurement uncertainty in the PSZ test using IO replicate
measurements of an undamaged Farmhouse milk sample. 144
4.5 Effect of sampling velocity on free fat (data collected at the Waitoa
dairy factory reception). Runs T06-09. 146
4.6 Effect of the form of the non-liquid phase on the distribution of mass
between the liquid, foam and churned fat phases of Farmhouse milk
agitated at 2000 rpm for 4 minutes at various temperatures. Run Cl 07. 158
4.7 Fat content of samples reported in Table 4.6. 158
4.8 FF content of a milk sample with churned fat (run C98). 159
5.1 Effect of pumping temperature and inclusion of air on amounts of foam
and/or churned fat produced from a 50 litre batch of Farmhouse milk
(runs C 103-106). 178
5.2 Effect of pumping temperature and addition of air on SLF A in
Farmhouse milk (runs C103-106). 180
5.3 Proportional contribution of foam/churned fat phase to the total FF and
SLFA value in Figures 5.8-5.9 and 5.12-5.13, from samples in runs
C103-106. 181
[image:27.553.84.495.27.745.2]Table
5.4
5.5
Table Description
Reproducibility of results obtained using the single-pass pumping rig
with Farmhouse milk passed between two tanks using an Anema-Sneek
centrifugal pump (runs 103-06). Samples were analysed using the SLl
test.
The flow rates measured in run 102 (Anema-Sneek centrifugal pump).
5.6 Replication uncertainty in the BT 1000 pumping rig with Farmhouse
milk re-circulated with a Dressler monopump. Two pairs of
experiments were carried out. Samples were taken from the same batch
of milk (runs Jl3-20).
5.7 Illustration of different conditions of valve cavitation achieved using
sma1l-volurne pumping rig. Vapour pressure of water was taken as
0.338 psia at 20°C (Perry et al.. 1997).
5.8 Effect of agitation speed on amount of foam and/or churned fat
Page
184
185
186
189
produced from a 400 mL batch of Farmhouse milk (runs C94-96). 208
5.9 Effect of agitation temperature on amount of foam and/or churned fat
produced from a 400 mL batch of Farmhouse milk (runs C85-90). 212
5.10 Effect of agitation temperature on amount of foam and/or churned fat
produced from a 400 mL batch of Farmhouse milk (runs C97-102). 214
C.1 Primary region portion of PSD result from a control sample (run T29.
Figure C. l. page Appendix C6) analysed with the Mastersizer E. A
cumulative PSD was also calculated. The primary region summed to
75.41 volume%. Border and shading indicates size range where linear
interpolation was carried out.
C.2 Primary region portion of PSD result from a damaged sample (run T29.
Figure C.2. Appendix C6) analysed with the Mastersizer E. A
cumulative PSD was also calculated. The primary region summed to
Tl.35 volume%. Shaded rows indicate size range where linear
interpolation was carried out.
XXVll
282
List of Abbreviations
Abbreviation
IFA
OFA
ADVCIP
CL
DSIFAPF
FAUPF
FF
FFA(s)
GLC
KOH LPL P.R. PF PHEPLC
PPL PSD(s) SLl test SL2 testSLFA
UHT
UPF
Definition
incubation fatty acids original fatty acids acid degree value clean( ed)-in-place calf lipase
direct steam injection
fatty acids from protected fat fatty acids from unprotected fat free fat
free fatty acid(s)
gas-liquid chromatography potassium hydroxide lipoprotein lipase
. .
pnmary region protected fat
plate heat exchanger
programmable logic controller pig pancreatic lipase
particle size distribution(s)
selective lipolysis test - version 1
selective lipolysis test - version 2
selective lipolysis fatty acids ultra high temperature unprotected fat
Chapter 1
Introduction
Virtually all of the fat in milk is found in the form of spherical globules, the disperse
phase of an emulsion in milk plasma. Each globule is surrounded by a native milk fat
globule membrane (NMFGM) composed of mostly surface-active lipids and proteins.
The NMFGM constitutes approximately 2% of fat globule mass and therefore less than
I% of the total solids in milk but has an essential role in the stability of the emulsion.
The NMFGM acts as a barrier between the core fat and the milk plasma. This barrier
resists such phenomena as:
• Linkages between, or coalescence of, fat globules, and consequent changes in milk
fat globule size distribution.
• Enzymes that attack milk fat to convert them into free fatty acids (FF As).
The composition of the NMFGM is very different from the two phases it separates
-globular fat and milk plasma (Mulder & Walstra, 1974). Most globular fat is in the form
oftriacylglycerols. NMFGM fat consists mostly of phospholipids. Milk plasma includes
proteins in the form of casein micelles, colloidally dispersed serum (whey) proteins and
enzyme, but the NMFGM is largely unique. The NMFGM protein has an amino acid
pattern similar to that of the apical cell-membrane of the lactating cell (Keenan et al.,
1970).
The unique composition of the NMFGM makes it a significant component. Its function
however, makes it a critical component! If the NMFGM is breached (i.e. if NMFGM
damage has occurred) the above mentioned phenomena result, and the quality of the
milk is reduced. McPherson & Kitchen (1983) asserted that "Thus many current
problems of the dairy industry are directly related to an understanding of this unique
membrane system."
The NMFGM is easily damaged during handling operations such as milking, storage at
the farm and transportation. Even the simple process of chilling the milk can lead to
changes in the NMFGM such as loss of phospholipids (Anderson et al., 1972) and
Introduction
alterations to the protein composition (Thompson et al., 1961). Breaches of the
NMFGM can lead to physical changes such as disruption of fat globules, with
subsequent difficulties in separation into cream and skim milk, and chemical changes
such as lipolysis, with consequent formation of off-flavours. Any uncovered fat globule
surface resulting from damage to the NMFGM is almost instantly covered by serum
proteins and casein micelles (Walstra et al., 1999). It is therefore useful to differentiate
between the NMFGM, which consists mainly of phospholipids and proteins derived
from the apical membranes of secretory cells of the cow, and the milk fat globule
membrane found in processed milk, which also contains serum proteins and casein
micelles.
In New Zealand, around 13 billion litres of milk are processed each season at 29
manufacturing sites (http:/ /www. fon terra. com/content/a boutfonterra/factsand figures/default. jsp,
March 2004). This equates to an average of over 2 million litres processed at each site
in New Zealand every day of the season. This high throughput, coupled with the
tendency for milk to lose its quality rapidly over time, means that even small delays in
production can result in significant financial loss to the industry.
The New Zealand dairy industry has put considerable effort into making itself as cos
t-effective, and its products as attractive to customers, as possible, including efforts to:
• Maximise milk quality entering factories.
• Reduce microbial contamination in factories.
• Minimise product losses through the reprocessing of waste streams and fine
particulates.
• Maximise the sizes of factories and therefore reduce capital costs.
• Minimise transportation costs.
This has made the New Zealand dairy industry highly mechanised.
Evidence of this mechanisation can be seen in many parts of the New Zealand dairy
industry. On farms, it is typified by the universal use of pipeline milking machines, and
storage of milk in large silos, often of up to 28,000 litres in the case of farms with large
herds. Milk tankers transport the milk from the farm and can carry up to 27,000 litres at
one time (http://meadowfresh.net.nz/about milk/from moo to vou.php, 2004). However, in some
Introduction
parts of the country, the milk is transported very long distances by train, from
intermediate storage sites to the factories. New Zealand dairy factories are among the
largest in the world, many having multiple storage silos in excess of 250,000 litres
individual capacity, with considerable use of pumps to transport the milk around the
factory.
With the push for mechanisation and larger factories, potentially significant financial
losses may be created through loss of product quality resulting from rough handling of
the milk. While the handling of raw milk on dairy farms has been studied to some
extent, very little attention has been paid to raw and pasteurised milk in factory
processing steps following farm handling. Such processes include, in addition to
pasteurisation, storage, pumping, separation, and thermal processes such as preheating
and evaporation.
Various authors have highlighted the potentially harmful effects of poor milk handling,
during process operations, that damages the milk fat. Such effects include fouling of
heat exchangers, poor cream separation and flavour defects. These effects result in loss
of product and poor milk and cream quality. While no formal cost analysis has been
applied to these effects, it is clear they do cost money, and given the size of the New
Zealand dairy industry must be taken seriously. Damage to the NMFGM in process
operations within factories was the focus of the present work.
The work began with the aim of usmg existing NMFGM damage measurement
techniques to assess NMFGM damage in milk powder manufacturing processes,
because milk powders constitute over 30% of all New Zealand dairy products.
(http://www.fonterra.com/content/aboutfonterra/factsandfigures/default.jsp, 2004 ), and very little research has been conducted on the impact of milk powder manufacturing operations on
the milk powders. It was hypothesised that incremental increases in NMFGM damage in
individual operations within the milk powder manufacturing process would contribute
to an overall loss of milk powder quality.
However, it became clear over time that the NMFGM damage measurement tests based
on the measurement of lipolysis, which were initially chosen, were not reliable enough
Introduction
to allow a valuable survey ofNMFGM damage in some situations. Hence, much of the
early work could only highlight the weaknesses of the existing tests.
Therefore, the first objective of this project was to develop a technique for the
measurement ofNMFGM damage.
A second objective was to identify and analyse the factors that affect damage to the
NMFGM using the measurement techniques devised.
The final objective was to make case studies of the damage occurring in a number of
key operations or equipment found in milk powder plants where the factors identified in
reaching the second objective could be found.
Therefore, this thesis is an account of an ongoing journey that began with concepts on NMFGM damage that ultimately had to be redeveloped before the original aim of the
work could be pursued.