Compressive behaviour of the soil in buffer zones under different management practices in Finland
13
0
0
Full text
(2) AGRICULTURAL AND FOOD SCIENCE Vol. 19 (2010): 160–172.. Introduction Vegetated buffer zones (BZs) have been successful in removing suspended solids and particle-bound nutrients from agricultural surface runoff in the Nordic climate (Syversen and Borch 2005, Uusi-Kämppä 2005). From a hydrological standpoint, the efficiency of the vegetated BZs is mainly based on the decrease in the amount and velocity of surface flow and the enhancement of infiltration (Dorioz et al. 2006), and hence proper soil structure is important for the successful functioning of BZs in terms of erosion and nutrient transportation by surface runoff water. Soil compression and shearing are widely recognized risks for structural deformation when heavy machinery is used in agriculture (e.g. Håkansson et al. 1988, Alakukku 1996a, 1996b, Peth et al. 2006) and in forestry (Horn et al. 2004). Similar problems were also attributed to trampling by wild ruminants in pasture-based forest ecosystems in Canada (Donkor et al. 2002), by cattle in intensive rotational grazing systems in the USA (Warren et al. 1986) or by cattle in pastures and vegetated BZs in Finland (Pietola et al. 2005, 2006). Owing to the reduction in volume of large pores and pore continuity, soil deformation reduces air permeability and hydraulic conductivity and therefore has an adverse impact on the functioning of pores for water and gas transport. It is not the textural pore space, i.e. matrix porosity, but the structural pore space that is susceptible to compaction (Richard et al. 2001). Mechanical disturbance of pore structure may accentuate soil erosion, leaching of nutrients by surface runoff, and organic matter loss, as well as restrict plant productivity (Horn et al. 1995). As a consequence, the critical function of BZs in minimizing nutrient inputs to surface water will diminish. Soil deformation can be used as a collective term including compaction (air squeezed out of the soil), consolidation (water also squeezed out) and compression (combination of the former and soil movement, i.e. displacement) (Earl 1997). The corresponding effect can also be defined by the soil resilience, which is referred to as the soil’s capacity to recover its functional and structural integrity, and quantified as the rate or the extent of recovery. 161. after external stresses (Seybold et al. 1999). When soil is loaded, it is compressed, i.e. a decrease in total volume often occurs due to the movement of gas and water and the rearrangement of particles. This also implies a change in pore functioning. However, the extent of compression-induced soil structure deformation is dependent on both the internal (e.g. texture, structure, water content and interparticle bonds) and external properties such as the type of loading, loading time and frequency. Generally, fine-textured clay soils are more compressible than the coarser-textured silt soils under applied mechanical stress, and the soil strength increases with increasing degree of aggregation (Baumgartl and Horn 1991). The internal strength of soil, i.e. the resistance to external forces, can be quantified by the precompression stress. It is determined as the stress value that divides the compression curve into a portion of small, elastic and reversible soil deformation (the recompression line) and a portion of large, plastic and therefore irreversible deformation (the virgin compression line, VCL). Precompression stress is dependent on the maximum drying intensity and wetting and drying frequency, bulk density, clay content (i.e. soil texture) and time of loading (Lebert and Horn 1991, Alexandrou and Earl 1998, Keller et al. 2004, Peng et al. 2004, Fazekas and Horn 2005). However, Arvidsson and Keller (2004) provided evidence that precompression stress was not related to some of these properties. The chemical properties of runoff water are traditionally used as the criteria for BZ effectiveness. Despite the fact that soil structure has an essential influence on the infiltration of water and solutes in BZs, the physical and mechanical properties of soil in the functioning of BZs have received substantially less attention. In the present study, the management-related differences in surface soil physical and mechanical properties in variously managed BZ areas were investigated to assess the impacts of BZ management practices on soil structure. The risk of surface soil deterioration resulting especially from grazing of clay soil was estimated, a practice that is allowed in BZ areas in Finland. Few mechanical measurements have been performed in Finnish agricultural soils (e.g. Pietola et al. 2005), and this is the first study in Finland in which compressive.
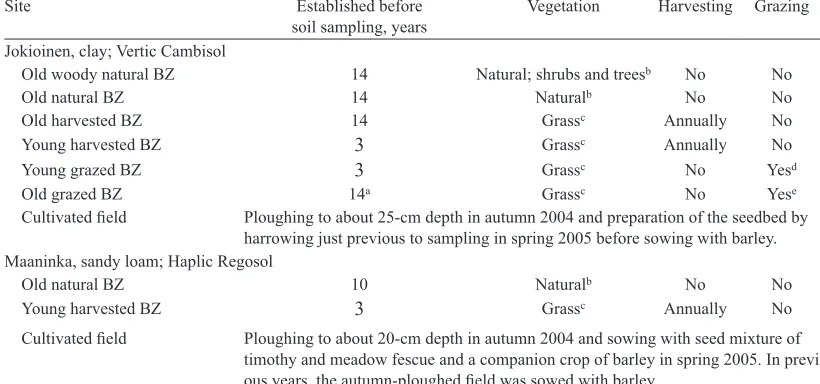
(3) AGRICULTURAL AND FOOD SCIENCE Räty, M. et al. Compressive behaviour of the soil in buffer zones properties have been documented throughout the soil profiles, providing information on the depthrelated properties of agricultural clay (Vertic Cambisol) and sandy loam (Haplic Regosol) soils.. Material and methods Experimental soils and soil sampling Soil samples were taken from Jokioinen in southwestern Finland (60º48’N, 23º28’E) and from Maaninka in central Finland (63º08’N, 27º19’E). The experimental soils were classified as a Vertic Cambisol at Jokioinen and as a Haplic Regosol at Maaninka, according to the World Reference Base for Soil Resources (WRB) system (Food and Agriculture Organization, FAO 2006). Based on the U.S. Department of Agriculture (USDA) texture. classification system, the Jokioinen topsoil was silty clay and the subsoil was clay. At Maaninka the topsoil was loamy and the subsoil consisted of sandy loam. The long-term (1971–2000) mean annual temperature was 4.3 °C at Jokioinen and 2.8 °C at Maaninka, and the mean temperatures of the coldest (February) and warmest (July) months were –6.5 and 16.1 °C, and –9.6 and 16.5 °C, respectively. The mean annual precipitation was 607 mm at Jokioinen and 609 mm at Maaninka (Drebs et al. 2002). In winter 1998−1999, the average duration of the snow cover at Jokioinen was 148 d and at Kuopio Airport, close to Maaninka, 155 d (Finnish Meteorological Institute 2000). Evaporation makes up more than half of the precipitation in southern Finland and 30–40% in northern Finland. For the Jokioinen clay soil and the Maaninka sandy loam soil, the experimental treatments of contiguous vegetated BZs (18 m × 10 m) with the cultivation techniques for arable soils adjacent to the BZs are given in Table 1. The BZs were established. Table 1. Ages of the vegetated BZs before soil sampling, types of vegetation, treatments of BZs and cultivation techniques for arable soils. Site Established before Vegetation Harvesting Grazing soil sampling, years Jokioinen, clay; Vertic Cambisol Old woody natural BZ 14 Natural; shrubs and treesb No No Old natural BZ 14 Naturalb No No Old harvested BZ 14 Grassc Annually No Grassc Annually No Young harvested BZ 3 Grassc No Yesd Young grazed BZ 3 Old grazed BZ 14a Grassc No Yese Cultivated field Ploughing to about 25-cm depth in autumn 2004 and preparation of the seedbed by harrowing just previous to sampling in spring 2005 before sowing with barley. Maaninka, sandy loam; Haplic Regosol Old natural BZ 10 Naturalb No No Grassc Annually No Young harvested BZ 3 Cultivated field. Ploughing to about 20-cm depth in autumn 2004 and sowing with seed mixture of timothy and meadow fescue and a companion crop of barley in spring 2005. In previous years, the autumn-ploughed field was sowed with barley.. a BZ. established in 1991 with grass species that were mostly cut but not always removed until grazed by cattle since 2001. communities of wild hays and flowers (e.g. common bent Agrostis capillaries L., meadow vetchling Lathyrus pratensis L., dandelion Taraxacum officinale F.H. Wigg.), and also a thin stand of shrubs and hardwood trees (e.g. mountain currant Ribes alpinum L., guelder-rose Viburnum opulus L., small rowans Sorbus aucuparia L. and birches Betula L.) in the old woody BZ. c Mainly timothy (Phleum pratense L.) and meadow fescue (Festuca pratensis Huds.). d 72, 234 and 128 cow grazing days ha-1 yr-1 in 2003, 2004 and 2005, respectively. e An accurate stocking rate is unknown, but is probably comparable with the young grazed BZ. b Multispecies. 162.
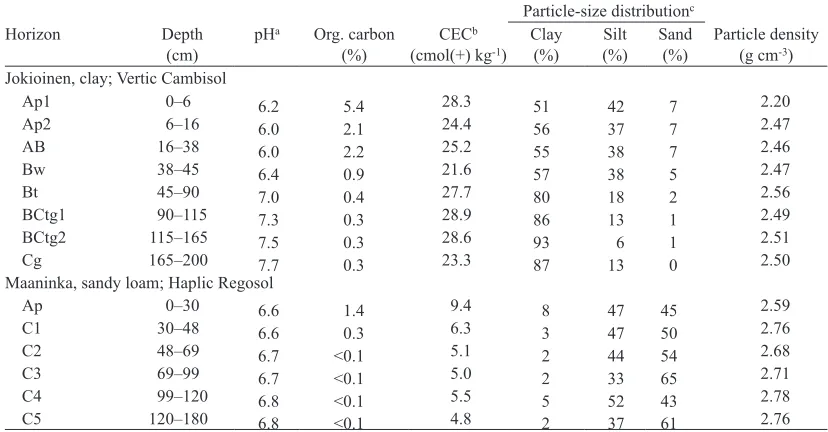
(4) AGRICULTURAL AND FOOD SCIENCE Vol. 19 (2010): 160–172. in 2002 or 1991 (i.e. 3 or 14 years before soil sampling) between cultivated fields and main ditches receiving agricultural surface runoff and have been harvested by (i) grazing, (ii) cutting the grass and subsequently removing the residue or (iii) by not removing the vegetation. In general, all the BZ sites in question were utilized as cultivated fields for several years/decades prior to their establishment as BZs, with applications of nitrogen-phosphorus-potassium (NPK) compound fertilization, ploughing to a depth of about 20 cm in autumn and sowing with cereals (mainly barley Hordium vulgare L. and oat Avena sativa L.) in spring. Cultivation of soil was extended until the BZs were established, after which the sites were neither cultivated nor fertilized. For determination of the air permeability and compression behaviour, undisturbed soil samples were taken from the surface layers of BZs and cultivated fields at depths of 0−3 cm, using a steel cylinder (240 cm3, height 30 mm, diameter 100 mm). The sampling line was set 2 m from the upper end of the sites subdivided into regular segments. In the Jokioinen clay soil, six replicate cores were taken on May 2, 2005, before vegetative growth and sow-. ing. At the surface soil layer (0–11 cm), the mean soil moisture content, measured with time-domain reflectometry (TDR), varied from 26% to 37% for the driest cultivated field and the wettest old woody natural BZ soil, respectively. In the Maaninka sandy loam soil with mean moisture content of 33%, measured with TDR, five replicate cores were taken after emergence of vegetation on June 13, 2005. For the analysis of general soil properties, three replicate bulk soil samples were also taken from the surfaces of experimental soils (0–2.5 cm) in the BZs and cultivated fields. Close to the experimental area covered with natural grass vegetation, a 200-cm-deep soil pit was excavated at Jokioinen (May 2, 2005) and eight horizons were identified. At Maaninka (June 13, 2005), there were six horizons in a 180-cm-deep soil pit that was close to the experimental area and also under natural grass vegetation. After morphological description and classification, the undisturbed soil samples (240 cm3) were taken from the middle of each genetic horizon with four (sandy loam, Haplic Regosol) or five (clay, Vertic Cambisol) replicates, as well as disturbed soil samples. Selected properties of the pedons are presented in Table 2.. Table 2. Selected chemical and physical properties of the studied soils. Horizon. Depth pHa (cm) Jokioinen, clay; Vertic Cambisol Ap1 0–6 6.2 Ap2 6–16 6.0 AB 16–38 6.0 Bw 38–45 6.4 Bt 45–90 7.0 BCtg1 90–115 7.3 BCtg2 115–165 7.5 Cg 165–200 7.7 Maaninka, sandy loam; Haplic Regosol Ap 0–30 6.6 C1 30–48 6.6 C2 48–69 6.7 C3 69–99 6.7 C4 99–120 6.8 C5 120–180 6.8 a pH. Org. carbon CECb (%) (cmol(+) kg-1). Particle-size distributionc Clay Silt Sand (%) (%) (%). Particle density (g cm-3). 5.4 2.1 2.2 0.9 0.4 0.3 0.3 0.3. 28.3 24.4 25.2 21.6 27.7 28.9 28.6 23.3. 51 56 55 57 80 86 93 87. 42 37 38 38 18 13 6 13. 7 7 7 5 2 1 1 0. 2.20 2.47 2.46 2.47 2.56 2.49 2.51 2.50. 1.4 0.3 <0.1 <0.1 <0.1 <0.1. 9.4 6.3 5.1 5.0 5.5 4.8. 8 3 2 2 5 2. 47 47 44 33 52 37. 45 50 54 65 43 61. 2.59 2.76 2.68 2.71 2.78 2.76. measured in H2O suspension. b CEC: cation exchange capacity at pH 7.0. texture system: clay < 0.002 mm; silt 0.002–0.05 mm; sand > 0.05 mm.. c USDA. 163.
(5) AGRICULTURAL AND FOOD SCIENCE Räty, M. et al. Compressive behaviour of the soil in buffer zones. Laboratory measurements The bulk soil samples were dried at 37 °C and passed through a 2-mm sieve. The particle-size distribution was determined with the pipette method (Elonen 1971), particle density with a stoppered bottle pycnometer method, total organic carbon content with a Leco® CHN 900 induction furnace, and soil pH measured in a deionized water suspension (1:2.5 soil-to-solution ratio). For the determination of cation exchange capacity (CEC), the Ca2+, Mg2+, K+ and Na+ and H++Al3+ were extracted with 1 M CH3COONH4 (pH 7) at a soil-to-solution ratio of 1:5. The bottoms of the undisturbed soil cores were sealed with two filter papers one upon another (Schleicher & Schuell MicroScience 595). Thereafter, the cores were saturated from the bottom and equilibrated to a –6-kPa matric potential in sand boxes. Prior to the compression, the air permeability was determined by the apparatus illustrated in Horn et al. (2004). The air permeability kl (m s-1) was calculated by the equation kl = ρl × g × [(DV × l) / (Dt × Dp × A)], where ρl is the air density (1.204 kg m-3 at 20 °C), g the gravitational acceleration (9.81 m s-2), DV/ Dt the amount of air passed through the sample per time (m3 s-1), l the height of the cylinder (m), Dp the applied air pressure (hPa) and A the surface area of the sample (m2). The samples were stressed statically with 20, 40, 70, 100, 200 and 400 kPa for 7 hours, using the confined compression device. The compaction-dependent soil vertical displacements or settlement (displacement sensor) and the changes in pore-water pressure (ceramic microtensiometer) were recorded automatically with a resolution of 0.001 mm and 0.001 hPa during loading (compression) and unloading (rebound or resilience) for 1 h. At each experimental site, four to six single data points from the confined compression test were linked with the compression curve, and a second-order polynomial curve was fitted to describe the relationship between the soil vertical displacement (mm) on the normal scale and the applied. stress (kPa) on the logarithmic scale. The precompression stress was estimated, using a graphical procedure of Casagrande’s method (1936). Shortly, the stress-displacement curve was subdivided into the recompression curve in the lower stress range of the upper portion of the curve and the VCL at the higher stress level, after which the precompression value was derived from the curve. The initial dry bulk density as well as the volumetric water content was calculated after drying at 105 °C for 48 h. The total porosity was estimated from the dry bulk density and the particle density. The means and the standard deviations (± SD) were calculated from the replicates taken within the nonreplicated treatments or nonreplicated horizons. Statistically significant differences between the treatments or horizons were tested with analysis of variance using the SAS 9.1 program. The standard error of the mean (SE), the standard error of the difference (SED) and the Student’s T-test least significant difference (LSD) at the p < 0.05 level of significance were calculated separately over the treatments or horizons according to each soil type, enabling the reader to estimate the statistically significant differences.. Results The pedons The bulk densities were substantially greater in the horizons of the Maaninka sandy loam soil (Haplic Regosol) than those of the Jokioinen clay soil (Vertic Cambisol) (Table 3). In the clay soil, the bulk density gradually increased with depth down to the Bt horizon (45–90 cm) and then decreased again. For the sandy loam, the bulk density was greatest in the two uppermost horizons, attaining maximal levels at depths of 30–48 cm in the C1 horizon. The total porosity was determined from the bulk density and thus the coarser-textured sandy loam horizons tended to be less porous than the finer-textured clay horizons. In the horizons closer to the surface, the air permeability values were substantially greater in. 164.
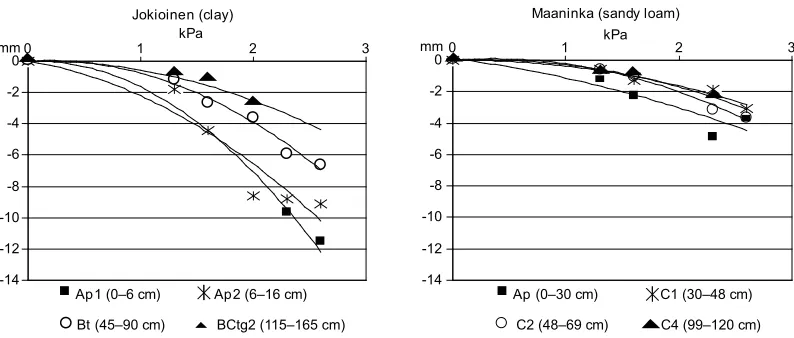
(6) AGRICULTURAL AND FOOD SCIENCE Vol. 19 (2010): 160–172. Table 3. Initial bulk density, volumetric water content, total porosity and air permeability (mean ± SD) for the genetic soil horizons at a matric potential of –6 kPa. The SE, SED and LSD are presented separately over the horizons, according to the soil type (n = 5 for clay and n = 4 for sandy loam). Horizon. Depth Bulk density (cm) (g cm-3) Jokioinen, clay; Vertic Cambisol (n = 5). Water content (cm3 cm-3). Total porosity (cm3 cm-3). Air permeability (10-5 m s-1). Ap1. 0–6. 0.98 ± 0.16. 0.41 ± 0.03. 0.55 ± 0.07. 35.0 ± 12.6. Ap2. 6–16. 1.14 ± 0.06. 0.36 ± 0.02. 0.54 ± 0.02. 52.1 ± 14.0 *. AB. 16–38. 1.25 ± 0.07. 0.38 ± 0.02. 0.49 ± 0.03. 28.4 ± 13.1 *. Bw. 38–45. 1.34 ± 0.08. 0.39 ± 0.03. 0.46 ± 0.03. 9.7 ± 7.2 *. Bt. 45–90. 1.38 ± 0.04. 0.44 ± 0.01. 0.46 ± 0.01. 9.3 ± 17.1. BCtg1. 90–115. 1.19 ± 0.01 *. 0.52 ± 0.02 *. 0.54 ± 0.00 *. 0.3 ± 0.1 *. BCtg2. 115–165. 0.98 ± 0.04. 0.57 ± 0.03. 0.61 ± 0.01. 0.3 ± 0.2. Cg. 165–200. 1.06 ± 0.10. 0.55 ± 0.02. 0.58 ± 0.04. 0.9 ± 1.4. SE 0.04. SE 0.01. SE 0.02. SE 4.8. SED 0.06. SED 0.01. SED 0.02. SED 6.7. LSD 0.11. LSD 0.03. LSD 0.05. LSD 14.3. Maaninka, sandy loam; Haplic Regosol (n = 4) Ap. 0–30. 1.56 ± 0.07. 0.40 ± 0.02. 0.42 ± 0.03. 1.0 ± 1.3. C1. 30–48. 1.63 ± 0.09. 0.39 ± 0.02. 0.41 ± 0.03. 1.7 ± 1.6. C2. 48–69. 1.32 ± 0.01. 0.46 ± 0.03. 0.51 ± 0.00. 0.2 ± 0.2. C3. 69–99. 1.48 ± 0.03. 0.39 ± 0.03. 0.46 ± 0.01. 0.1 ± 0.1. C4. 99–120. 1.45 ± 0.04. 0.40 ± 0.02. 0.48 ± 0.01. 0.2 ± 0.1. C5. 120–180. 1.39 ± 0.04. 0.36 ± 0.03. 0.50 ± 0.02. 0.6 ± 0.2. SE 0.03. SE 0.01. SE 0.01. SE 0.4. SED 0.04. SED 0.02. SED 0.01. SED 0.6. LSD 0.08. LSD 0.04. LSD 0.03. LSD 1.3. SE = standard error of the mean, SED = standard error of the difference; LSD = Student’s T-test least significant difference (p < 0.05); * The mean with different n is not included in the SE, SED or LSD.. the clay soil than in the sandy loam soil. In the clay soil, there was a sharp decline in air permeability at depths of 38–45 cm in the Bw horizon and another decline to as low as 0.3 × 10⁻⁵ m s-1 at 90–115 cm (the BCtg1 horizon), whereas there was a relatively smaller drop to 0.2 × 10⁻⁵ m s-1 at 48–69-cm depths (the C2 horizon) in the sandy loam soil. Figure 1 shows the response of the soils to the applied stresses expressed as (semi)log stressdisplacement curves for the horizons of the Jokioinen clay soil and the Maaninka sandy loam at a matric potential of –6 kPa. Even though the average vertical displacement over the applied stresses generally decreased from top to bottom throughout. 165. the soil profiles, the clay soil and the sandy loam exhibited very different compression behaviours. The amount of vertical displacement and rebound, measured at the end of the loading and unloading step, were more pronounced for the horizons of the clay soil than for those of the sandy loam. The relationship of the rebound to the original displacement, however, was very similar, being 11–41% for the clay soil and 18–44% for the sandy loam over the applied stresses. For the soil horizons, the estimates of the precompression stresses on the basis of Casagrande’s method were generally lower for the clay soil (< 60 kPa) than for the sandy loam (< 110 kPa) (data not shown)..
(7) AGRICULTURAL AND FOOD SCIENCE Räty, M. et al. Compressive behaviour of the soil in buffer zones. mm 0 0. Jokioinen (clay) kPa 1. Maaninka (sandy loam) 2. mm 0 0. 3. -2. -2. -4. -4. -6. -6. -8. -8. -10. -10. -12. -12. -14. Ap1 (0–6 cm). Ap2 (6–16 cm). Bt (45–90 cm). BCtg2 (115–165 cm). -14. 1. kPa. 2. Ap (0–30 cm). C1 (30–48 cm). C2 (48–69 cm). C4 (99–120 cm). 3. Fig. 1. Examples of vertical displacement (mm) as a function of the logarithm of the applied stress (kPa) in the soil horizons of the Vertic Cambisol (Jokioinen, clay) and the Haplic Regosol (Maaninka, sandy loam) at a matric potential of –6 kPa. A second-order polynomial curve was fitted and the precompression stress was estimated, using Casagrande’s procedure.. The surface soil In the surface layer (0–2.5 cm) of the clay soil, where multiple management practices where used in the BZs, the level of organic carbon ranged from 2.8% (± 0.1%, SD) to 7.0% (± 1.9%), increasing with the age of the grassy vegetation due to continued litter accumulation on the soil surface, and was markedly higher than in the cultivated field (1.8% ± 0.2%) (data not shown in detail). The particle density decreased from 2.47 (± 0.04) to 2.25 (± 0.08) g cm-3 with the increase in organic carbon. In the sandy loam soil with particle densities of 2.56 (± 0.04) – 2.64 (± 0.05) g cm-3, the organic carbon was higher in the soil under natural vegetation (5.5% ± 0.4%) than under young grass (2.1% ± 0.0%) or in the cultivated field (1.8% ± 0.0%). In the clay soil at depths of 0–3 cm, the initial dry bulk density was significantly higher in the young grazed BZ than in the old grazed and old natural BZs, and in the mechanically loosened cultivated field (Table 4). In the sandy loam soil, the bulk density was greatest in the cultivated field. For both soils, the air permeability values varied by the same order of magnitude from a minimum of 2.2 × 10⁻⁵ m s-1 in the cultivated sandy loam field to a maximum of 29 × 10-5 m s-1 in the cultivated. clay. In the clay soil, the grazed BZ sites showed considerably lower air permeability levels than the other sites. At 0–3-cm depths, the compression curves of the variously managed surface soils were remarkably comparable for the Jokioinen clay soil and the Maaninka sandy loam, at a matric potential of –6 kPa (Fig. 2). In the stress-displacement curves, there were no clear transitions from the small and elastic (i.e. reversible) to the larger and plastic (i.e. irreversible) deformations. The values of the precompression stresses ranged from 40 to 60 kPa for both soils, regardless of the management practices (data not shown in detail). For example, at an applied stress of 200 kPa, the vertical displacement (7.9–9.3 mm) with the rebound (1.0–1.7 mm) was greatest for the old natural BZ and least for the cultivated field in the sandy loam. For the clay soil, the displacement varied from a minimum of 6.3 mm with a 1.3-mm rebound for the young grazed BZ to a maximum of 9.6 mm with a 2.3-mm rebound for the old grazed BZ. Generally, the extent of the displacement and rebound was greater for the older BZ sites of lower bulk densities and higher organic carbon contents (Fig.. 166.
(8) AGRICULTURAL AND FOOD SCIENCE Vol. 19 (2010): 160–172. Table 4. Initial bulk density, volumetric water content, total porosity and air permeability (mean ± SD) for the surface soils (0–3 cm) of vegetated BZs and cultivated fields at a matric potential of –6 kPa. The SE, SED and LSD are presented separately over the treatments, according to the soil type (n = 6 for clay and n = 5 for sandy loam). Site. Bulk density (g cm-3) Jokioinen, clay; Vertic Cambisol (n = 6) Old woody natural BZ 1.06 ± 0.14 Old natural BZ 0.95 ± 0.07 Old harvested BZ 1.04 ± 0.10 Old grazed BZ 0.97 ± 0.09 Young grazed BZ 1.17 ± 0.09 Young harvested BZ 1.08 ± 0.06 Cultivated field 0.94 ± 0.03 * SE 0.04 SED 0.05 LSD 0.11 Maaninka, sandy loam; Haplic Regosol (n = 5) Old natural BZ 0.88 ± 0.12 Young harvested BZ 1.11 ± 0.13 Cultivated field 1.24 ± 0.08 SE 0.05 SED 0.07 LSD 0.15. Water content (cm3 cm-3). Total porosity (cm3 cm-3). Air permeability (10-5 m s-1). 0.42 ± 0.04 0.45 ± 0.04 0.43 ± 0.04 0.44 ± 0.03 0.45 ± 0.03 0.40 ± 0.03 0.33 ± 0.01 * SE 0.01 SED 0.02 LSD 0.04. 0.53 ± 0.06 0.60 ± 0.03 0.56 ± 0.04 0.59 ± 0.04 0.51 ± 0.04 0.56 ± 0.02 0.61 ± 0.01 * SE 0.02 SED 0.02 LSD 0.05. 22.1 ± 23.7 * 15.0 ± 18.6 * 24.7 ± 11.4 * 5.1 ± 3.1 2.7 ± 2.4 24.1 ± 16.7 28.7 ± 13.6 SE 4.5 SED 6.3 LSD 13.2. 0.41 ± 0.04 0.39 ± 0.04 0.35 ± 0.02 SE 0.01 SED 0.02 LSD 0.04. 0.66 ± 0.05 0.58 ± 0.05 0.51 ± 0.03 SE 0.02 SED 0.03 LSD 0.06. 25.0 ± 13.0 28.2 ± 21.7 2.2 ± 1.3 SE 6.5 SED 9.2 LSD 20.1. SE = standard error of the mean, SED = standard error of the difference; LSD = Student’s T-test least significant difference (p < 0.05). * The mean with different n is not included in the SE, SED and LSD.. Jokioinen (clay) mm 0. 1. kPa. Maaninka (sandy loam) 2. 3. 0. mm 0 0. -2. -2. -4. -4. -6. -6. -8. -8. -10. -10. -12. -12. -14. -14. 1. kPa. Young grazed BZ. Old grazed BZ. Cultivated field. Old natural BZ. Cultivated field. Young harvested BZ. 2. 3. Old natural BZ. Fig. 2. Examples of vertical displacement (mm) as a function of the logarithm of the applied stress (kPa) for the differently managed surface soils (0–3 cm) of the Jokioinen clay and Maaninka sandy loam at a matric potential of –6 kPa. A second-order polynomial curve was fitted and the precompression stress was estimated, using Casagrande’s procedure.. 167.
(9) AGRICULTURAL AND FOOD SCIENCE Räty, M. et al. Compressive behaviour of the soil in buffer zones Jokioinen (clay) kPa 1 2. mm 0 0. 3. mm 0 0. -2. -2. -4. -4. -6. -6. -8. -8. -10. -10. -12. -12. -14. Maaninka (sandy loam) kPa 1 2. Old grazed BZ:. Cultivated field:. Old natural BZ:. Cultivated field:. Compression. Compression. Compression. Compression. Rebound. Rebound. Rebound. Rebound. -14. 3. Fig. 3. Maximum and minimum rebound (mm) subsequent to the compression (mm) measured at the end of the loading (7 h) and unloading (1 h) step as a function of the logarithm of the applied stress (kPa) for the differently managed surface soils (0–3 cm) of the Jokioinen clay and Maaninka sandy loam at a matric potential of –6 kPa. Compression = thick line, filled symbol; Rebound = thin line, unfilled symbol.. Discussion Depth-related characteristics 3). The vertical displacement also resulted in a decrease in the sample volume or an increase in bulk density. An applied stress of 200 kPa caused decreases of 21–32% and 26–31% in the sample volume for the clay and sandy loam soils, respectively, whereas following the stress removal, the final changes were 16–26% and 23–26%, respectively. As a result of the elastic rebound, the surface soils of both textures recovered 0.01–0.16 g cm-3 from the build-up of the bulk density over the applied stresses and management practices; however, the final changes varied from 0.07 to 0.46 g cm-3. Generally, the susceptibility to compression at clay soil depths of 0–3 cm decreased with decreasing air-filled porosity in the following order: cultivated field > old grazed BZ > old natural BZ > old harvested BZ > young harvested BZ > old woody natural BZ > young grazed BZ. For the sandy loam soil, the susceptibility to compression was as follows: old natural BZ > young harvested BZ > cultivated field.. In the Jokioinen (Vertic Cambisol) and Maaninka (Haplic Regosol) pedons, the parent material consisted of fine-textured, postglacial sediments mainly deposited in brackish water during the Yoldia Sea stage (11,600–10,800 years B.P.). The fine clay fraction was mostly composed of illite, chlorite, vermiculite and amorphous material, whereas the contents of the feldspar and quartz increased with increasing particle size (Sippola 1974), predominantly in the sandy loam. Consistent with the concept of general compressive behaviour for different soil textures under applied mechanical stresses, the horizons of the fine-textured Jokioinen clay soil were more compressible than those of the coarser-textured Maaninka sandy loam soil, probably due to soil texture rather than to management practices. The topmost horizons were mechanically loosened to a normal ploughing depth of about 20 cm. The soil was strongest below the plough layer due to the presence of a denser plough pan that has persisted as long as 10 years in the originally ploughed Maaninka sandy loam. In. 168.
(10) AGRICULTURAL AND FOOD SCIENCE Vol. 19 (2010): 160–172. the Jokioinen clay soil, the plough pan was not as clearly distinguishable after 14 years. Our findings that the uppermost horizons with a looser structure were more compressible than the deeper horizons with a prismatic and blocky structure supported those of Baumgartl and Horn (1991). Despite the increasing clay content, soil compressibility or resistance to volume decrease under an externally applied load substantially increased with depth, although without corresponding changes in the precompression stress values. This was inconsistent with the results summarized by Horn et al. (1995) that the C horizons of three soil types were weakest and may be partly attributable to prevention of further compression resulting from the decrease in pore volume and the retardation in drainage of excess water by inadequate hydraulic conductivity, pore continuity and hydraulic gradients (Baumgartl and Horn 1991). The high soil compressibility was also caused by the relatively high water contents at a matric potential of –6 kPa. In the deepest horizons, lower values of air permeability, especially in the clay soil, indicate the absence of macropores and lack of connectivity created by faunal and root activity. The low bulk density and high total porosity, despite the very low organic carbon content, showed that a massive and weakly aggregated card-house structure, inherited from the sediment parent material, still prevailed below 90 cm. Even if the clay mineralogy and high clay content of up to 93% potentially contributed to crack formation as a result of swelling and shrinking through the wetting and drying cycles, the deepest horizons below the depth of the subsurface drainage pipes (about 1 m) probably would remain wet throughout the year. Therefore, these horizons have weakly developed structures and the soil is still unripe.. Management-related differences of buffer zones The internal strength of soils and soil profiles can be quantified by precompression stress, which is determined by pedogenic processes, anthropogenic. 169. effects and hydraulic site-specific conditions (Horn et al. 2004). In Sweden, the precompression stress values for arable soils generally classified as Eutric Cambisols (6−86% clay) were 106 and 139 kPa in the topsoil (0–30 cm) and 129 and 179 kPa in the subsoil (30–60 cm) at matric potential values of –0.5 kPa and more intensively dried conditions of –60 kPa, respectively (Arvidsson and Keller 2004). These values are greater than those of the present study. Our sampling time reflects the conditions prevailing after winter when the surface soil structure is weakest, and hence the soil strength is very low as suggested by Rasa et al. (2009). However, the accuracy of the precompression stress values determined according to the Casagrande method is inadequate, due to the limitations in the designed experiment. In the grazed BZs, the internal soil strength was considerably lower than the external stress caused by single hoof pressure of about 500 kPa divided equally among hoofs (125 kPa), based on a body weight of 500 kg and hoof contact area of 100 cm2. Consequently, trampling by cattle did not result in additional increases in soil strength, which is in accordance with Horn et al. (2004), who found no notable effects of trampling by horses (650 kg) on precompression stress in their forest-harvesting experiment. However, soil strength may increase due to compaction, or on the other hand, decrease due to destruction of the existing aggregation by shearing (Horn et al. 1995). Stone and Larson (1980) measured a decrease of < 0.05 g cm-3 in the bulk density along with a release in mechanical stresses (0.1–1.0 MPa). Despite the relatively small differences in bulk density, Larson and Gupta (1980) hypothesized that remarkable changes in pore structure may occur due to distinctive changes in pore-water pressure. We found greater rebound of up to 0.16 g cm-3 (20–400 kPa), which indicates that these surface soils are extremely susceptible to structural deformation. Furthermore, the soils were not strong enough to withstand applied stresses, and thus we noted considerable plastic deformations, even under the lowest applied stress of 20 kPa. However, these findings can be partly explained by the early sampling times and equilibration of the samples at a matric potential of –6 kPa, similar to the field ca-.
(11) AGRICULTURAL AND FOOD SCIENCE Räty, M. et al. Compressive behaviour of the soil in buffer zones pacity. Wetter soils increasingly lower the stability, and subsequently the proportion of elastic to plastic deformation may be more pronounced. The BZ sites under vegetation cover showed substantially higher resilience capacity than the cultivated fields. The old grazed BZ of relatively low resistance displayed a higher degree of elastic rebound than the young grazed BZ of high resistance. McBride and Watson (1990) also observed the largest degree of rebound (0.018−0.075 g cm-3) upon stress removal (1.0 MPa) for structured unsaturated soil of the highest measured organic matter content and the lowest dry bulk density. Kuan et al. (2007), on the other hand, noted that repacked soils in Scotland (0–31% clay) with the greatest organic carbon levels (1.7–30%) possessed poor resistance to but good recovery from compressive stress. This trend also occurred for the BZ surface soils in the present study. We observed here that a much larger amount of partially decomposed organic material accumulated on our old grazed BZ soil surface, resulting from the management practice of no vegetation removal and from cattle dung. The beneficial effect of organic matter was confirmed by Zhang et al. (2005), who found that the rebound increased with the addition of particulate peat (0–50 g kg-1), stating that organic matter acted as a mechanical spring, and hence the decrease in soil resistance to stresses is compensated by the improvement in physical resilience after stress release. Therefore, organic residues of low density and high elasticity may protect the soil surface and improve its recovery potential. Consequently, BZs should not be grazed before the organic cover has developed on the soil surface. Due to the higher capacity of soil to recover from occasional compactive disturbances, as opposed to frequent disturbances such as livestock trampling (Seybold et al. 1999), regular grazing may pose a higher risk for the structural deterioration of soil. On the other hand, recovery of the soil structure subsequent to the period of no trampling may be promoted in clay soil of higher shrinking and swelling capacity by the wet-dry and freeze-thaw cycles compared with sandy loam soil. Despite the differences in the initial bulk densities, the minimum values of air permeability were. measured for both of the grazed BZs, probably resulting from soil deformation and disturbance of the pore system by shearing rather than vertical compaction. Air permeability is used as an indicator of pore continuity (Dexter 1997) and is considered very sensitive to soil structural changes resulting from management practices and biological activity (Blackwell et al. 1990). In addition, Iversen et al. (2001) pointed out the close relationship between air permeability and saturated hydraulic conductivity. Accordingly, the reduced air permeability measured for grazed sites indicates changes in the soil structure and lack of a continuous network of air-filled pores and is conducive to reduced hydraulic conductivity. For the same experimental clay soil sites, the preliminary results of Pietola et al. (2006) showed that trampling decreased the flow rate of water after a 15-min infiltration to 10–20 cm h-1, compared with that of 40 cm h-1 for the old woody natural BZ and 60 cm h-1 for the old harvested BZ measured in situ in early May 2005 under unsaturated conditions. Furthermore, Pietola et al. (2005) showed that the steady-state infiltration rate decreased from 7.2 to 1.0 cm h-1 with increasing trampling damage in heavy clay soil. If the infiltration capacity decreases, water accumulation on the soil surface may also expose the soil to further trampling damage.. Conclusions The lowest values of air permeability for the grazed buffer zones (0–3 cm) indicated the reduction in connectivity of the pore network and thus also in the hydraulic conductivity. Data from the confined compression test showed that the precompression stress values were rather low throughout the soils, probably due to the sampling which was done after winter when the soil structure is weak. Trampling by cattle did not result in additional increases in the precompression stress values; however, the soil compressive behaviour differed substantially between the two grazed sites. The old grazed buffer zone that had the low initial bulk density tended to. 170.
(12) AGRICULTURAL AND FOOD SCIENCE Vol. 19 (2010): 160–172. be easily compressed compared with the younger ones. However, the old grazed buffer zone was able to recover more elastically subsequent to stress removal than the young grazed buffer zone of higher bulk density, due to the organic matter accumulated on the soil surface. Thus, we emphasize the importance of preserving surface soil and soil structure without disturbances under vegetation and recommend grazing only after the organic cover has developed on the soil surface of buffer zones. Under undisturbed conditions with no grazing, the surface soil of the buffers zones probably exhibited a better rearrangement of particles, pore sizes and systems, and consequently the management-related changes were not as clearly distinguishable. This study was the first in Finland to document the mechanical properties of arable soils, which are necessary for determining stress limits and assess the susceptibility of different soil types to compaction and irreversible soil deformation. The trends found here need to be verified, using different soils with several replicates to result in more accurate recommendations for sustainable management strategies of buffer zones. Further studies will therefore need to focus on determination of the compression behaviour and precompression stresses under dynamic, cyclic loading conditions, like those caused by animal trampling. Acknowledgements.This work was financially supported by the Finnish Cultural Foundation, the Finnish Ministry of Agriculture and Forestry, the Maj and Tor Nessling Foundation and Maa- ja vesitekniikan tuki ry. The authors thank Mr Stefan Becker for his technical support and Mrs Jaana Uusi-Kämppä from MTT Agrifood Research Finland for the opportunity to sample the experimental BZs.. References Alakukku, L. 1996a. Persistence of soil compaction due to high axle load traffic. I. Short-term effects on the properties of clay and organic soils. Soil & Tillage Research 37: 211−222. Alakukku, L. 1996b. Persistence of soil compaction due to high axle load traffic. II. Long-term effects on the properties of fine-textured and organic soils. Soil & Tillage Research 37: 223−238.. 171. Alexandrou, A. & Earl, R. 1998. The relationship among the pre-compaction stress, volumetric water content and initial dry bulk density of soil. Journal of Agricultural Engineering Research 71: 75–80. Arvidsson, J. & Keller, T. 2004. Soil precompression stress I. A survey of Swedish arable soils. Soil & Tillage Research 77: 85−95. Baumgartl, Th. & Horn, R. 1991. Effect of aggregate stability on soil compaction. Soil & Tillage Research 19: 203–213. Blackwell, P.S., Ringrose-Voase, A.J., Jayawardane, N.S., Olsson, K.A., McKenzie, D.C. & Mason, W.K. 1990. The use of air-filled porosity and intrinsic permeability to air to characterize structure of macropore space and saturated hydraulic conductivity of clay soils. Journal of Soil Science 41: 215–228. Casagrande, A. 1936. The determination of the pre-consolidation load and its practical significance. In: Proceedings of the International Conference of Soil Mechanics and Foundation Engineering, 22–26 June, Harvard University. Cambridge, USA. 3: 60–64. Dexter, A.R. 1997. Physical properties of tilled soils. Soil & Tillage Research 43: 41–63. Donkor, N.T., Gedir, J.V., Hudson, R.J., Bork, E.W., Chanasyk, D.S. & Naeth, M.A. 2002. Impacts of grazing systems on soil compaction and pasture production in Alberta. Canadian Journal of Soil Science 82: 1–8. Dorioz, J.M., Wang, D., Poulenard, J. & Trévisan, D. 2006. The effect of grass buffer strips on phosphorus dynamics - A critical review and synthesis as a basis for application in agricultural landscapes in France. Agriculture, Ecosystems and Environment 117: 4–21. Drebs, A., Nordlund, A., Karlsson, P., Helminen, J. & Rissanen, P. 2002. Climatological statistics of Finland 1971–2000. Finnish Meteorological Institute 2002:1. Helsinki. 99 p. Earl, R. 1997. Assessment of the behaviour of field soils during compression. Journal of Agricultural Engineering Research 68: 147–157. Elonen, P. 1971. Particle-size analysis of soil. Acta Agralia Fennica 122: 1−122. FAO 2006. World reference base for soil resources 2006. World soil resources reports 103. Rome, Italy. 128 p. Fazekas, O. & Horn, R. 2005. Interaction between mechanically and hydraulically affected soil strength depending on time of loading (in German, with English abstract). Journal of Plant Nutrition and Soil Science-Zeitschrift für Pflanzenernährung und Bodenkunde 168: 60–67. Finnish Meteorological Institute (FMI) 2000. Meteorological yearbook of Finland 1999. Helsinki. 78 p. Horn, R., Domżał, H., Słowińska-Jurkiewicz, A. & van Ouwerkerk, C. 1995. Soil compaction processes and their effects on the structure of arable soils and environment. Soil & Tillage Research 35: 23–36. Horn, R., Vossbrink, J. & Becker, S. 2004. Modern forestry vehicles and their impacts on soil physical properties. Soil & Tillage Research 79: 207–219. Håkansson, I., Voorhees, W.B. & Riley, H. 1988. Vehicle and wheel factors influencing soil compaction and crop response in different traffic regimes. Soil & Tillage Research 11: 239–282. Iversen, B.V., Moldrup, P., Schjǿnning, P. & Loll, P. 2001. Air and water permeability in differently textured soils at.
(13) AGRICULTURAL AND FOOD SCIENCE Räty, M. et al. Compressive behaviour of the soil in buffer zones two measurements scales. Soil Science 166: 643–659. Keller, T., Arvidsson, J., Dawidowski, J.B. & Koolen, A.J. 2004. Soil precompression stress II. A comparison of different compaction test and stress-displacement behaviour of the soil during wheeling. Soil & Tillage Research 77: 97–108. Kuan, H.L., Hallett, P.D., Griffiths, B.S., Gregory, A.S., Watts, C.W. & Whitmore, A.P. 2007. The biological and physical stability and resilience of a selection of Scottish soils to stresses. European Journal of Soil Science 58: 811–821. Larson, W.E. & Gupta, S.C. 1980. Estimating critical stress in unsaturated soils from changes in pore water pressure during confined compression. Soil Science Society of America Journal 44: 1127–1132. Lebert. M. & Horn. R. 1991. A method to predict the mechanical strength of agricultural soils. Soil & Tillage Research 19: 275−286. McBride, R.A. & Watson, G.C. 1990. An investigation of the re-expansion of unsaturated, structured soils during cyclic static loading. Soil & Tillage Research 17: 241−253. Peng, X.H., Horn, R., Zhang, B. & Zhao, Q.G. 2004. Mechanisms of soil vulnerability to compaction of homogenized and recompacted Ultisols. Soil & Tillage Research 76: 125−137. Peth, S., Horn, R., Fazekas, O. & Richards, B.G. 2006. Heavy soil loading and its consequence for soil structure, strength, and deformation of arable soils. Journal of Plant Nutrition and Soil Science 169: 775–783. Pietola, L., Horn. R. & Yli-Halla, M. 2005. Effects of trampling by cattle on the hydraulic and mechanical properties of soil. Soil & Tillage Research 82: 99–108. Pietola, L., Rasa, K., Räty, M., Uusi-Kämppä, J., Yli-Halla, M., Horn, R. & Tippkötter, R. 2006.Management-in-. duced changes of soil physical properties in vegetated buffer zones. In: Horn, R., Fleide, H., Peth, S. & Peng, X. (eds.). Soil management for sustainability. Advances in GeoEcology 38. p. 301–307. Rasa, K., Horn, R., Räty, M., Yli-Halla, M. & Pietola, L. 2009. Shrinkage properties of differently managed clay soils in Finland. Soil Use and Management 25: 175–182. Richard, G., Cousin, I., Sillon, J.F., Bruand, A. & Guérif, J. 2001. Effect of compaction on the porosity of a silty soil: influence on unsaturated hydraulic properties. European Journal of Soil Science 52: 49–58. Seybold, C.A., Herrick, J.E. & Brejda, J.J. 1999. Soil resilience: A fundamental component of soil quality. Soil Science 164: 224–234. Sippola, J. 1974. Mineral composition and its relation to texture and to some chemical properties in Finnish subsoils. Annales Agriculturae Fenniae 13: 169–234. Stone, J.A. & Larson, W.E. 1980. Rebound of five onedimensionally compressed unsaturated granular soils. Soil Science Society of America Journal 44: 819–822. Syversen, N. & Borch, H. 2005. Retention of soil particle fractions and phosphorus in cold climate buffer zones. Ecological Engineering 25: 382–394. Uusi-Kämppä, J. 2005. Phosphorus purification in buffer zones in cold climates. Ecological Engineering 24: 491−502. Warren, S.D., Nevill, M.B., Blackburn, W.H. & Garza, N.E. 1986. Soil response to trampling under intensive rotation grazing. Soil Science Society of America Journal 50: 1336–1341. Zhang, B., Horn, R. & Hallett, P.D. 2005. Mechanical resilience of degraded soil amended with organic matter. Soil Science Society of America Journal 69: 864–871.. 172.
(14)
Figure

+3


Related documents
The proposed administration is a public institution,which is resolved to take charge o-f seamen's interests and the shipping industry. It shall make provisions -for healthy,
The structure of the work should include roles for project sponsor, technical experts, qualities assurance for deliverables, project manager (yourself initially and,
In relation to their study of the Korean hotel industry, Choi and Kim (2012, p. 1023) proposed that establishments invest more in “flexible work schedules, regular working hours,
However, if you plan on attending graduate school (e.g. or Master’s degree in an academic discipline), the most related experience you can gain is through actual scholarship; in
to volume on a specific price level.The trading costs of filled limit trades would always be 0 because of our assumption that the execution price of the filled limit order is
Effect of formaldehyde on some properties of magnesium oxysulphate cement was studied by incorporating it in different amounts in the dry –mix (1:2 dry mix was prepared by weight
Among the lignocellulosic wastes tested, pineapple peels (PP) was found to be the best substrate for cellulase production followed by brewer’s spent grain (BSG), equal
