A Modified Weibull Distribution
C. D. Lai, Min Xie, Senior Member, IEEE, and D. N. P. Murthy, Member, IEEE
Abstract—A new lifetime distribution capable of modeling a
bathtub-shaped hazard-rate function is proposed. The proposed model is derived as a limiting case of the Beta Integrated Model and has both the Weibull distribution and Type I extreme value dis-tribution as special cases. The model can be considered as another useful 3-parameter generalization of the Weibull distribution. An advantage of the model is that the model parameters can be esti-mated easily based on a Weibull probability paper (WPP) plot that serves as a tool for model identification. Model characterization based on the WPP plot is studied. A numerical example is provided and comparison with another Weibull extension, the exponentiated Weibull, is also discussed. The proposed model compares well with other competing models to fit data that exhibits a bathtub-shaped hazard-rate function.
Index Terms—Bathtub shape, hazard-rate function, modeling
data, parameter estimation, Weibull distribution, Weibull proba-bility plot.
ACRONYMS1
Cdf cumulative distribution function
hrf hazard-rate function
MLE maximum likelihood estimate
NMWD new modified Weibull distribution pdf probability density function s- implies the statistical meaning
Sf survival function
WPP Weibull probability paper.
NOTATION
NMWD parameters, ,
hrf
cumulative hrf time
change point of
Weibull shape parameter, Weibull scale parameter, .
Manuscript received November 1, 1999; revised March 22, 2000, April 30, and October 1, 2001. Responsible Editor: J. A. Nachlas.
C. D. Lai is with the Institute for Information Sciences and Tech-nology, Massey University, Palmerston North, New Zealand (e-mail: [email protected]).
M. Xie is with the Department of Industrial and Systems Engineering, Na-tional University of Singapore, Kent Ridge Crescent 119260, Singapore (e-mail: [email protected]).
D. N. P. Murthy is with the Department of Mechanical Engineering, The Uni-versity of Queensland Q4072, Australia (e-mail: [email protected]).
Digital Object Identifier 10.1109/TR.2002.805788
1The singular and plural of an acronym are always spelled the same.
I. INTRODUCTION
M
ANY lifetime distributions have bathtub-shapedhrf and many real-life data exhibit this property. A state-of-the-art survey on the class of such distributions is in [9]. This paper studies NMWD that generalizes the traditional Weibull distribution.
The usual 2-parameter Weibull distribution can be specified through its Sf:
(1)
This usual distribution does not have a bathtub hrf. However, several distributions derived from the basic Weibull distribution have bathtub-shaped hrf. Two of these are: i) the exponentiated Weibull distribution proposed in [10]; ii) the competing risk and sectional models involving 2 Weibull distributions, such as those discussed in [5].
This paper examines the statistical inference aspects and the modeling of a given data-set by the NMWD.
• Section II gives the details and some properties of NMWD. • Section III discusses the relationship of NMWD to other well-known distributions.
• Section IV looks at the issue of determining when a given data-set can be modeled by NMWD. The question of applica-bility is resolved by using WPP plots.
• Section V estimates the parameters of NMWD.
• Section VI gives an illustrative example where the data are modeled by NMWD.
II. THENEWMODIFIEDWEIBULLMODEL
The lifetime distribution for NMWD arises from taking ap-propriate limits on the Beta integrated distributions from [8]. The Sf is
(2)
with parameters , , and .
The pdf and hrf are:
(3)
(4)
A. Characterization of
The shape of depends only on because of the factor, , and because the remaining 2 parameters have no influence. Cases i and ii are considered:
Case i: : Equation (4) shows that:
1) is increasing in , implying an increasing hrf.
2) if ; if .
34 IEEE TRANSACTIONS ON RELIABILITY, VOL. 52, NO. 1, MARCH 2003
Fig. 1. hrf for the NMWD [(1)b = 1:4, a = 1, (2) b = 1, a = 2, (3) b = 0:8,
a = 5, (4) b = 0:4, a = 10].
3) as .
Case ii: : Thus:
1) initially decreases and then increases in , implying a bathtub shape for it.
2) as , and as .
3) The derivative of intersects the axis only once, at
for . is decreasing for , and is increasing for
which is given by
(5)
The interesting feature is that decreases as increases. This is interpreted as follows. The for the Weibull distribution can be constant, increasing, or decreasing. The for the new model differs from that, due to additional factor which can be viewed as an acceleration factor increasing in both and
. As a result, decreases as increases.
Fig. 1 plots for 4 combinations of and , with .
The values of , are selected to indicate the 2 possible different shapes (increasing and bathtub) for .
III. RELATIONSHIP TOOTHERDISTRIBUTIONS
NMWD is related to the following well-known distributions.
A. Weibull Distribution
For in (2), NMWD reduces to
(6)
which is a common 2-parameter Weibull distribution.
B. Extreme-Value Distribution
For in (2), NMWD reduces to
(7)
This is a type I extreme-value distribution and is also known as a gamma distribution [7]. Sometimes it is referred to as a log-Weibull. Unfortunately, the type-1 extreme-value distribution is not useful as a model for life distributions, because its support spreads over the whole real line.
C. Beta-Integrated Model
The beta-integrated model was first introduced in [8]. The model’s cumulative hrf and Sf are:
(8)
(9)
Set . , For ,
and this yields,
(10)
which is the cumulative hrf for NMWD.
Relation to the Hjorth Model [3]: An earlier, but important bathtub-shaped failure model was proposed in [3]. The model is essentially a competing risk model involving 2 sub-popula-tions with one having an increasing hrf and the other having a decreasing hrf. As a result, the hrf for this Hjorth model is
(11)
On the other hand, the hrf of NMWD is given by (4).
For , NMWD becomes a Weibull model. If in
addition to , NMWD reduces to the Rayleigh distribution. Thus NMWD is not directly related to the Hjorth model (11) except when for which case, (11) becomes the hrf for the Rayleigh distribution.
Reference [3] obtained asymptotic results for the MLE of sur-vival probabilities, and when possible compared them with the MLE based on the Weibull, Rayleigh, and exponential distri-butions. In contrast, the main emphasis in this paper is on the graphical aspects of the model, such as the WPP plot.
IV. MODELING ADATASET
This section discusses the problem of determining whether a given data set can be adequately modeled by NMWD. There are basically 2 approaches to determining if a given data-set can be adequately modeled by a given distribution:
1) Graphical 2) Statistical.
This section confines attention to the graphical approach. Be-cause NMWD is related to the Weibull distribution, the appro-priate graphical method is the WPP plot.
A. WPP Plot for NMWD
The WPP plot involves plotting the variable versus an-other variable , where these are related to the Cdf and by the Weibull transformation:
and
Let denote this plot. If the Cdf is given by (6), then the plot is a straight line. If not, it is a curve. Reference [4] deals with the WPP plots for a mixture of 2 Weibull distributions; [5] deals with WPP plots for the competing-risk and sectional models; and [6] deals with the WPP plot for the exponentiated Weibull distribution. The for NMWD is:
(12)
Fig. 2. A typical WPP plot for the NMWD.
Characterization of : 1) The curve is convex: the line segment that joins any 2 points on the curve does not lie below the curve.
2) The asymptotes of are:
• As (or ), an approximation to (12) is the
straight line .
• As (or ), an approximation to (12) is
.
3) Let and denote the coordinates of intersecting
the (corresponding to ) and (corresponding to )
axes. Then,
(13)
Either and or vice versa, and . These
are important in parameter estimation as shown in Section V.
B. An Alternative Plot
An alternative plot, (not a WPP plot) is:
and (14)
(15)
This is again a nonlinear relationship.
Characterization of : 1) The curve is concave.
2) The asymptotes of C2 are: • As (or ),
(15) can be approximated by .
• As (or ). Equation (15) can be
approxi-mated by .
The shape of (for small and large ) is different from that
for .
C. Modeling Data Set
Given a data set, the first problem is to determine if NMWD is appropriate or not to model the data set. The WPP plot (based on the data) is useful for this purpose. This depends on the type of failure-data available for modeling.
This paper is limited to where the data-set available for
mod-eling is the set of failure times . The
extensions to other data-set types is discussed in the Comments at the end of this section.
The WPP plot can be obtained by plotting
versus
for
and is the set obtained by ordering of
the original data. One can use other forms (e.g.,
), instead of to compute the empirical Cdf. For more on this, see [11].
If a smooth fit, based on visual assessment, to the plotted WPP plot has a shape similar to , then the data can be mod-eled by the new distribution. If not, the new model is not appro-priate for modeling the given data set.
Comments: 1) Alternatively, one can plot for and then compare the smooth fit to the data plot with to decide on the appropriateness of the model for the given data set.
2) In the graphical approach, one often uses visual eval-uation as the basis to decide whether the plotted WPP has a shape similar to one of the typical shapes for the model under consideration. This is a crude approach and one needs to follow it up with more refined methods (based on rigorous statistical tests) to make the final decision whether the model under consideration is appropriate or not. There are several well-known goodness-of-fit measures, e.g., Chi-squared and Kolmorgorov–Smirnov tests, which are based on the empirical distribution function. Because the distribution function for this model is very simple, both of these two tests are recommended. Because this distribution is related to an extreme value distri-bution, the goodness of fit tests in [7, chapter 22, section 13] would apply.
36 IEEE TRANSACTIONS ON RELIABILITY, VOL. 52, NO. 1, MARCH 2003
V. PARAMETERESTIMATION
As for any traditional lifetime distribution, the model param-eters must be estimated based on actual data. Several methods can be used and are discussed here.
A. Based on WPP Plot
Step 1) Fit a smooth curve to the transformed data.
Step 2) Estimate from the slope of the straight line asymp-tote.
Step 3) Estimate the remaining 2 parameters from the 2 in-tercepts given by (13).
A possible approach is simple regression analysis using (12) and estimating the parameters by least-squares fit.
An alternate is a multiple linear regression using and so that the WPP plot can be represented as the linear equation:
(16)
to estimate the parameters, noting that and are not s-independent.
B. Method of Percentiles
It is not possible to use the method of moments to estimate the parameters of the distribution because expressions for the mo-ments are analytically intractable. Although the expressions for the percentiles are analytically tractable, suggesting that using the estimates of the 2 quartiles and median, one can obtain the parameter estimates easily. In general, the estimates based on percentiles or moments are not very efficient when compared with of the MLE.
C. MLE Method
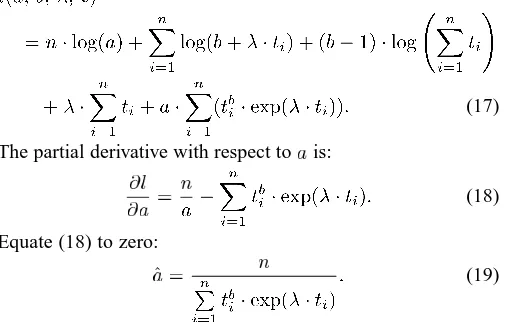
The likelihood function is easy to derive, and for complete data, the log likelihood is:
(17)
The partial derivative with respect to is:
(18)
Equate (18) to zero:
(19)
By taking the partial derivatives and equating them to zero, the log likelihood function yields the estimates for and from (20) and (21)
(20)
TABLE I
FAILURE-TIMEDATAFROMAARSET[1]
TABLE II
PARAMETERESTIMATION ANDTEST OFs-SIGNIFICANCE
(21)
These equations need to be solved numerically to estimate and .
VI. ANILLUSTRATIVEEXAMPLE
This section uses the data set (representing failure times and shown in Table I) from [1] to illustrate the modeling and esti-mation procedure.
As the first step for modeling and analysis, a WPP is pro-duced, and as anticipated, a straight-line fitting is not good. Hence, the Weibull distribution is not a good model for this data set; and thus other models should be used. The shape of the Weibull plot has the same as that in Fig. 2.
The smooth fit in the plot of Weibull transformed data indi-cates that the new Weibull distribution is an appropriate model. The parameter estimates are obtained using a regression proce-dure. The estimated model is
(22)
The .
[image:4.612.41.294.490.651.2]Table II shows the results of regression analysis for param-eter estimation. These results are compared with [9] in which another interesting extension of Weibull distribution (the expo-nentiated Weibull) is used for the same data set.
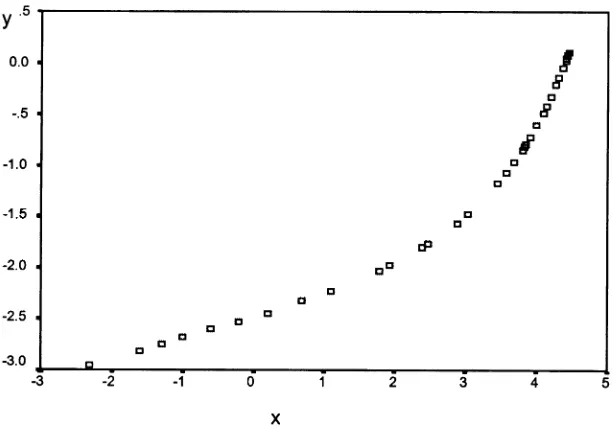
Fig. 3 shows:
• the Weibull plots for the new model, based on (22), • the exponentiated Weibull model, based on the parameter estimates from [10],
• the plot of the transformed data.
Fig. 3. Comparison of NMWD and the exponentiated Weibull for the data set from [1].
TABLE III
COMPARISON OFNMWDANDEXPONENTIATED DISTRIBUTIONS FORDATAFROM[1]
ACKNOWLEDGMENT
The authors would like to thank the Associate Editor, Dr. Nachlas, for his valuable comments on an earlier version of the paper.
REFERENCES
[1] M. V. Aarset, “How to identify bathtub hazard rate,” IEEE Trans. Rel., vol. R-36, no. 1, pp. 106–108, Apr. 1987.
[2] R. C. Gupta, R. L. Gupta, and R. D. Gupta, “Modeling failure time data by Lehman alternatives,” Communications in Statistics—Theory
and Methods, vol. 27, pp. 887–904, 1997.
[3] U. Hjorth, “A reliability distribution with increasing, decreasing, con-stant and bathtub-shaped failure rates,” Technometrics, vol. 22, no. 1, pp. 99–107, Feb. 1980.
[4] R. Jiang and D. N. P. Murthy, “Graphical representation of two mixed Weibull distributions,” IEEE Trans. Rel., vol. R-44, no. 2, pp. 477–488, June 1995.
[5] , “Reliability modeling involving two Weibull distributions,”
Re-liab. Eng. Syst. Safety, vol. 47, pp. 187–198, 1995.
[6] , “Exponentiated Weibull family: A graphical approach,” IEEE
Trans. Rel., vol. R-48, no. 1, pp. 68–72, Mar. 1999.
[7] N. L. Johnson, S. Kotz, and N. Balakrishnan, Continuous Univariate
Distributions: Wiley, 1995, vol. 2.
[8] C. D. Lai, T. Moore, and M. Xie, “The beta integrated model,” in Proc.
Int. Workshop on Reliability Modeling and Analysis—From Theory to Practice, 1998, pp. 153–159.
[9] C. D. Lai, M. Xie, and D. N. P. Murthy, “Bathtub shaped failure rate distributions,” in Handbook in Reliability, N. Balakrishnan and C. R. Rao, Eds., 2001, vol. 20, pp. 69–104.
[10] G. S. Mudholkar and D. K. Srivastava, “Exponentiated Weibull family for analysing bathtub failure rate data,” IEEE Trans. Rel., vol. 42, no. 2, pp. 299–302, Jun. 1993.
[11] W. Nelson, Lifetime Data Analysis: Wiley, 1982.
C. D. Lai was born in Sarawak, Malaysia. He received his tertiary education in
New Zealand and obtained the Ph.D. in Statistics from the Victoria University of Wellington. He held positions at the University of Auckland and the Na-tional Chiao Tung University (Taiwan) prior to coming to Massey in 1979. His research interests include statistical reliability, stochastic point processes, statis-tical quality control, and probability distributions. Professor Lai has published over 70 papers and coauthored 2 books.
Min Xie obtained his Licentiate in 1986 and the Ph.D. in 1987 in Quality
Tech-nology at Linkoping University in Sweden. He holds the M.Sc. from the Royal Institute of Technology in Sweden. After working for 4 years at Linkoping Uni-versity, he joined the National University of Singapore in 1991, and was awarded the prestigious Lee Kuan Yew research fellowship. Professor Xie is an Editor of
International Journal of Reliability, Quality, and Safety Engineering and is on
the editorial board of IIE Transactions on Quality and Reliability Engineering. He is a Senior Member of IEEE and ASQ.
D. N. P. Murthy obtained the B.E. and M.E. from Jabalpur University and the
Indian Institute of Science in India, and the M.S. and Ph.D. from Harvard Uni-versity. He is the Professor of Engineering and Operations Management in the Department of Mechanical Engineering at the University of Queensland, and a Senior Scientific Advisor to the Norwegian University of Science and Tech-nology. He has held visiting appointments at several universities in the USA, Europe, and Asia. He has authored and coauthored over 130 journal papers and 120 conference papers. He is a coauthor of 3 books: Mathematical Modeling, Pergamon Press, London; Warranty Cost Analysis, Marcel Dekker; Reliability:
Modeling, Prediction and Optimization, Wiley; and co-editor of Product War-ranty Handbook, Marcel Dekker. He is working on 2 books (Weibull Models, and Reliability Case Studies) to be published by Wiley. He is a member of several
MASSEY UNIVERSITY
MASSEY RESEARCH ONLINE
http://mro.massey.ac.nz/
Massey Documents by Type Journal Articles
![Fig. 1.hrf for the NMWD [(1) b = 1:4, a = 1, (2) b = 1, a = 2, (3) b = 0:8,a = 5, (4) b = 0:4, a = 10].](https://thumb-us.123doks.com/thumbv2/123dok_us/8491689.344826/2.612.48.284.62.259/fig-hrf-nmwd-b-b-b-b.webp)
![Fig. 3.Comparison of NMWD and the exponentiated Weibull for the data set from [1].](https://thumb-us.123doks.com/thumbv2/123dok_us/8491689.344826/5.612.115.474.66.314/fig-comparison-nmwd-exponentiated-weibull-data-set.webp)
