doi: 10.20964/110294
Int. J. Electrochem. Sci., 11 (2016) 3887 - 3907
International Journal of
ELECTROCHEMICAL
SCIENCE
www.electrochemsci.org
Evaluation of the Simultaneous Effects of Sulfate Reducing
Bacteria, Soil Type and Moisture Content on Corrosion
Behavior of Buried Carbon Steel API 5L X65
Fazlollah Madani Sani1, 2, *, Abdollah Afshar2, Maryam Mohammadi2, 3
1
Department of Chemical and Biomolecular Engineering, Institute for Corrosion and Multiphase Technology, Ohio University, Athens, OH 45701, USA
2
Department of Materials Science and Engineering, Sharif university of Technology, P.O. Box 11365-9466, Tehran, Iran
3
Department of Materials engineering, Vancouver Campus, Frank Forward Building, 309-6350 Stores Road, Vancouver, BC Canada V6T 1Z4
*
E-mail: [email protected], [email protected]
Received: 16December 2015 / Accepted: 13 February 2016 / Published: 1April 2016
For the first time, the simultaneous effects of sulfate reducing bacteria (SRB), soil type and moisture content on corrosion behavior of a pipeline steel were investigated. Corrosion weight loss measurements were performed in abiotic control and SRB-active conditions, at three different moisture contents, and in two types of soils. Results showed that the presence of SRB in the soils, although increased the corrosion rate and aggravated pitting corrosion at low moisture contents, had a protective effect at high moisture contents. The corrosion rates showed a maximum at the saturation moisture content (SMC) of the soils. Soil physicochemical analyses showed that the corrosion rate and soil resistivity were not related while texture and chemical content of the soils had strong effects on the corrosion rate. At low moisture contents, two layers of corrosion products formed on the surface of the coupons in both soils. X-ray diffraction (XRD) results showed that the outer layer was ferric oxyhydroxides in both abiotic and SRB-active conditions. The inner layer was magnetite in the abiotic condition and a mixture of magnetite and iron sulfides in the SRB-active condition. At high moisture contents, one layer of corrosion products formed on the surface in both soils, which was green rusts (GR) in the abiotic condition and a mixture of GRs and iron sulfides in the SRB-active condition.
Keywords: Carbon steel; Sulfate reducing bacteria; Soil corrosion; Moisture content; X-ray diffraction 1. INTRODUCTION
pipelines do occasionally fail [1]. It has been reported that in the USA, Canada and Europe approximately 22%, 52% and 16% of total incidents in oil and gas pipelines were because of corrosion, respectively. Of those caused by corrosion, 20-36% were because of external corrosion [2– 6]. The total annual cost of corrosion in the oil and gas production industry is estimated to be $1.372 billion, which $589 million associated with surface pipelines and facility costs [7].
Buried carbon steel pipelines are protected against external corrosion by simultaneous application of a protective organic coating and cathodic protection [8,9]. Despite how effective these protective measures are, in the presence of inevitable coating flaws, the adhesion of the coating to the steel decreases with time, cathodic protection current also is not enough in these areas; so the bare steel will be exposed to the corrosive environment of the soil [8,10].
One of the major causes of pipeline failures in soils has been identified as microbiologically influenced corrosion (MIC) [8]. There are different estimations about the contribution of MIC in total number of failures in buried pipelines caused by corrosion, from 10% to 70% [11–16]. The first MIC case was observed in 1934, where sulfate reducing bacteria (SRB) resulted in failure of buried cast-iron pipes [17]. Since then, numerous research have been carried out concerning the effect of SRB on buried pipelines. It is believed that SRB are one of the most problematic group of microorganisms involved in MIC [10,18–21].
Most reports about SRB-induced corrosion showed that SRB accelerated corrosion of metals [20,22]. Li et al. [17] concluded that the presence of SRB in anaerobic soils caused a 20-fold increase in the average corrosion rate of a carbon steel. Sun et al. [23] showed that the presence of SRB in soils containing chloride ions exacerbated the pitting susceptibility of a stainless steel. Zhao et al. [11] reported that the activity of SRB in sea mud increased the corrosion rate of a mild steel by 1.82 times compared to that in sterile sea mud. Despite a detrimental role considered for SRB, other researchers have recently found that sulfide films on a metal substrate caused by SRB metabolites, had protective effects and decelerated the corrosion [20,22,24–26].
Although plenty of studies have been performed on the effects of SRB on corrosion of steels, most of them were in sea water environments or simulated soil solutions, while few of them were carried out in soil environments. Therefore, no identical and conclusive opinion about the effects of SRB on corrosion of steels in soils has been made so far. In this study, by considering the simultaneous effects of SRB, physicochemical properties of soil, and moisture content an attempt toward a better understanding of the role of SRB in corrosion of a buried pipeline steel has been made. Since, SRB have been causing many problems in Kharg Island, Iran, the main terminal for exporting Iran’s crude oil, experiments were carried out using soils of this island where kilometers of gas and oil pipelines are buried [27,28]. Weight loss measurement, stereo-microscopy and X-ray diffraction (XRD) were employed to study the corrosion behavior of a pipeline steel in different conditions.
2. EXPERIMENTAL
2.1. Coupons
Coupons of 50 × 25 × 4 mm3
were cut from a plate of carbon steel API 5L X65 for weight loss measurement. The nominal composition of API 5L X65 steel used for experiments is shown in Table 1. The coupons were abraded successively with a series of grit papers (120, 240, 360 and 600) followed progressively by degreasing in the acetone and weighting to a precision of 0.1 mg. Coupons were sterilized by 70% ethanol, rinsed in sterilized double-distilled water and dried under filter-sterilized N2 atmosphere. They were kept in a vacuum desiccator to avoid any pollution.
Table 1. Nominal chemical composition of API 5L X65 carbon steel used for weight loss measurement coupons.
Element C Mn S P V Nb Ti Fe
wt% 0.25 1.45 0.03 0.03 0.004 as 0.06 balance
2.2. Soils
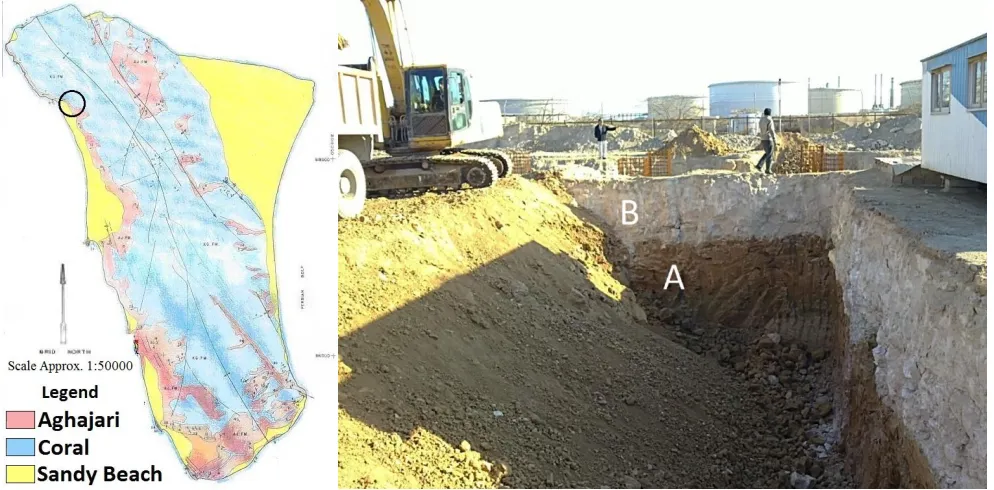
[image:3.596.51.548.435.680.2]Soils in this study were taken from Kharg Island, Iran on which there were two main soil formations: Aghajari and Coral (Fig. 1). The location where the experimental soils were taken is marked by a circle in Fig. 1. Approximately, 70 kg from each soil formation was collected from 100 cm depth, the average burial depth for oil and gas pipelines, for the experiments [29].
The chemical analysis of the soils was conducted by wet chemistry (BS-1377-3 standard) at Iran Khak Consulting Engineers Laboratory (operator), Tehran, Iran. X-ray diffraction (XRD) analysis of the soils was done at Par-e-Tavous Research Institute, Mashhad, Iran. The particle size distribution test was carried out according to American Society of Testing Materials (ASTM) standard D422-02. Both sieving and sedimentation processes were used to have a complete particle size distribution of the soils. The soil pH was measured in a 1:1 v/v mixture of soil and distilled water with a Corning 430 pH probe [30]. Soil resistivity was measured by using the Wenner four-electrode method (ASTM G57-95). A VoKam power supply was used as a current source and a FLUKE 187 digital multimeter was used to measure voltage.
It has been reported [31] that the moisture content of soils at depth of 100 cm in Kharg Island regularly varied from approximately 15 to 25 wt% each year. Therefore, three different moisture contents, 15, 20 and 25 wt% were chosen to study the effect of moisture content on corrosion behavior of the buried steel.
Prior to sterilization and moistening, any lumps or clods of collected soils were broken up manually. The homogenized soils were desiccated at 105 ˚C for 48 hours [32]. The dried soils were sterilized by autoclaving at 121 ˚C and steam pressure of 15 lb/in2
for 20 min in metallic baking pans covered with aluminum foils.
The moisture content in each experiment was adjusted based on Eq. 1 by adding N2-sparged sterile DI water to the sterile soils under sterile conditions:
Moisture content (wt%) = ×100 (1)
where ww and ws are the weights of added DI water and dried soil sample, respectively.
2.2.1. Soil saturation moisture content (SMC) measurement
In soil, there are always holes and porosities despite many attempts to eliminate them. The moisture content at which all the holes and porosities are filled with water and no free water collects on the soil surface is called SMC. For measuring the soil SMC, 200 g of each dried soil was weighted into a 500 ml plastic container. Then, DI water was gradually added to the container while mixing the mixture uniformly with a glass stick. The mixture was considered saturated when:
1) There was no free water on the surface of mixture.
2) Consolidated when a trench was formed by a sharp edge in the mixture.
3) Flowed when the container was tilted 45 degree angle (did not apply to Aghajari soil) [33]. The weight of added DI water was recorded at the end and the SMC was calculated by Eq. 1.
2.3. Microorganisms
L-ascorbic acid, 0.1 g thioglycolic acid and 0.5 g FeSO4.7H2O [34,35]. The last three chemicals were temperature sensitive. Thus, they were prepared separately as a 100X stock solution and then filter-sterilized [36]. The main solution consisted of other chemicals in 990 ml DI water, was autoclaved at 121 ˚C and 15 lb/in2
steam pressure for 20 min after its pH was adjusted to 7.5 by adding 1 M NaOH [37]. Both solutions were sparged with filter-sterilized N2 for 45 minutes. In an anaerobic chamber filled with N2 gas under sterile conditions, 10 ml of 100X stock solution was added to the main solution and then the final medium was inoculated with 5% (v/v) SRB inoculum. At the end, the culture medium was incubated for 4 days at 30 ˚C [18]. The incubation time was 4 days because the SRB culture used was transferred to its stationary phase after 4 days. The number of SRB cells was counted by using a hemocytometer (counting chamber) under an Olympus CX31 microscope with 400x total magnification [38]. The SRB amount was approximately 3×10⁸ cells per milliliter of culture medium.
2.3.1. SRB inoculation to the soils
Having the same number of SRB cells in the weight loss measurements as it was in the field condition was ideal. Therefore, before the weight loss experiments, the amount of SRB cells in the collected soils was determined. For this purpose, 200-g samples from each soil were transferred from the field to the lab in sealed containers. The most probable number (MPN) method was used for the enumeration of SRB cells. The procedure has been described elsewhere [39,40]. For the serial dilution, the same culture medium as explained in Section 2.3 was used. It is a selective culture medium for just SRB strains, and other bacteria cannot grow well in it [34]. Therefore, the result of MPN method could be an acceptable measure of number of SRB cells in the soil samples. The number of SRB cells was approximately 2 × 10⁷
cells in 1 g of each soil.
Glass containers used for the experiments held approximately 1300 g of soil. 100 ml of the enriched culture medium (3×10⁸
cells per ml) was injected to each container to meet the amount of SRB cells in the collected soils (2 × 10⁷
cells per 1 g). Injection of bacteria to the soil was done in an anaerobic chamber filled with N2 gas under sterile conditions. At the end, the containers were sealed tightly to prevent any oxygen penetrating inside.
2.4. Weight loss measurements
coupons were taken out and pickled in 20 wt% HCl solution containing 0.14 M Urotropin for 7 min. They were cleaned with DI water, dried and weighted again to a precision of 0.1 mg, afterward. At the end, the measured weight loss was converted into uniform corrosion rate, milli-inch per year (mpy) by Eq. 2 [42].
mpy = (2)
where w, D, A and T are the measured weight loss in mg, density of the steel in g/cm3, surface area of the coupons in sq. in and the exposure time in h, respectively.
2.5. Microscopy
An Olympus SZX-9 stereo microscope equipped with a digital camera was used to study the corroded surface of the coupons after the weight loss experiments.
2.6. X-ray diffraction (XRD) analysis
XRD analysis was carried out in order to characterize the corrosion products. XRD samples were collected from coupons on which the corrosion products were easily distinguishable with the naked eye from each other and also soil particles. XRD samples were collected in an anaerobic chamber filled with N2 gas immediately after removing the coupons from the soil. The samples were kept in zip-lock plastic bags till XRD analysis. XRD patterns were recorded by Philips 2236/20 diffractometer with a copper anode (K-alpha 1 = 1.54060 Å and K-alpha 2 = 1.54443 Å) at 40 kV and 40 mA. The scanning angle (2θ) ranged from 2.00˚ to 109.98˚. The XRD patterns were analyzed with the help of X’Pert HighScore software.
3. RESULTS AND DISCUSSION
3.1. Effect of soil type on corrosion rate
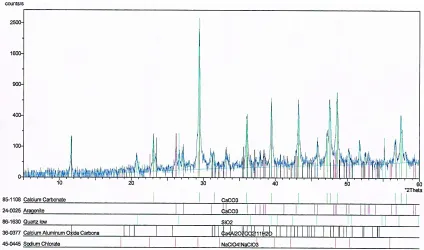
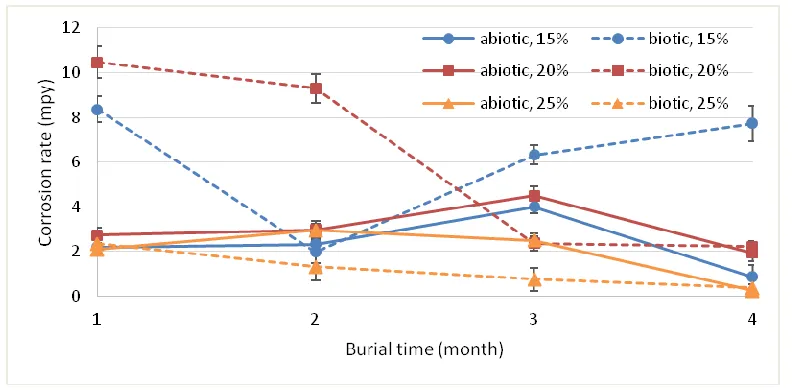
Figs. 2 and 3 show the variations of the average corrosion rate of the coupons with time and moisture content, respectively. In almost all conditions, the average corrosion rate of the coupons in Aghajari soil was greater than that in Coral soil, which can be explained by differences in chemical content and texture of the soils. Figs. 4 and 5 show the XRD patterns of Aghajari and Coral soils, respectively. Their patterns were nearly the same, which implied that both soils consisted of similar minerals. The main minerals in both soils were carbonate and quartz. However, Table 2 shows that the chemical content of two soils had considerable differences.
[image:7.596.104.494.197.421.2]
and bicarbonate ions in both soils were virtually the same, so these ions could not make a difference in the corrosion rate. Sulfite ion behaves as an oxygen scavenger and reduces the concentration of dissolved oxygen in soils which causes a reduction of the corrosion rate due to less oxygen available to participate in electrochemical reactions [44]. On the other hand, less dissolved oxygen favors the conditions for SRB activity which may increase the corrosion rate. Therefore, the effect of sulfite ion content of soils on the corrosion rate the buried steel needs further investigation.
Figure 2. Variations of the average corrosion rate of the coupons with time.
[image:7.596.107.488.477.708.2]
Table 2. Chemical content of the experimental soils.
Amount (wt%) Soil
type
pH
Na+ K+ Mg2+ Ca2+ SO32- SO42- Cl- HCO3- Organic
content TDS [a]
Aghajari 7.55 0.065 0.160 1.569 21.245 0.25 trace 0.045 0.023 0.37 0.41 Coral 7.42 0.210 0.022 0.391 32.421 1.03 trace 0.026 0.025 0.39 0.56
[a]
[image:8.596.86.510.482.732.2]Total dissolved salts.
Figure 4. X-ray diffraction pattern of Aghajari soil.
[image:9.596.81.517.202.608.2]
The concentrations of K+ and Mg2+ ions in Aghajari soil were approximately eight and four times those in Coral soil, respectively. The concentration of Ca2+ with a good approximation was identical in both soils. Liu et al. [45] have found that K+ ion decreased the charge transfer resistivity, while Mg2+ and Ca2+ ions increased it and their influence on soil aggressiveness was in order of K+ > Mg2+ > Ca2+. Therefore, the higher concentration of K+ and Mg2+ ions in Aghajari soil could be another reason for the higher average corrosion rates in Aghajari soil.
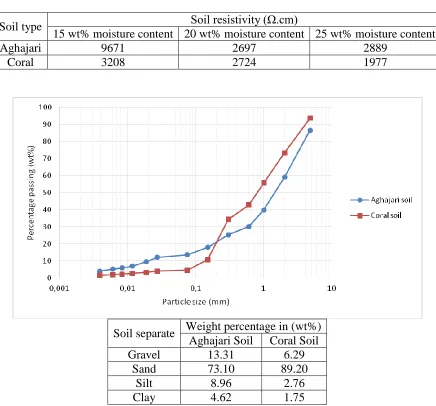
Table 3. Soil resistivity of the experimental soils at three different moisture contents.
Soil type Soil resistivity (Ω.cm)
15 wt% moisture content 20 wt% moisture content 25 wt% moisture content
Aghajari 9671 2697 2889
Coral 3208 2724 1977
Soil separate Weight percentage in (wt%) Aghajari Soil Coral Soil
Gravel 13.31 6.29
Sand 73.10 89.20
Silt 8.96 2.76
Clay 4.62 1.75
Figure 6. Particle size distribution analysis of Aghajari and Coral soils: Gravel > 4.75 mm, 0.047 mm < Sand < 4.75 mm, 0.005 mm < Silt < 0.047 mm, and Clay < 0.005 mm (ASTM D422-02).
metal/soil interface that cannot be leached out quickly and therefore accelerates the corrosion reactions [47]. This might be another reason for the higher average corrosion rates in Aghajari soil.
Resistivity of two soils at different moisture contents is given in Table 3. As expected, an increase in the moisture content, decreased the resistivity of both soils because water facilitates the transfer of charges in soil environments.
The resistivity of Aghajari soil was higher than that in Coral soil. More fine particles in Aghajari soil increased its water holding capacity and decreased the movement of water into soil [48]. Therefore, the transfer of charges became more difficult and the resistivity increased. Another reason could be less dissolved salts (TDS in Table 2) in Aghajari soil. Dissolved salts provide necessary charges to carry a current, so less dissolved salts means higher resistivity [49].
Soil resistivity has been considered as one the most fundamental factor in predicting soil corrosivity so far. It has been reported that soil corrosivity has a negative correlation with soil resistivity [9,47,50–52]. However, some recent field studies have asserted that since soil resistivity is enter-related with other factors such as moisture content, soil composition and porosity, there is no specific dependence between soil resistivity and soil corrosivity [32,53]. Although resistivity of Aghajari soil was higher than Coral soil at almost all moisture contents and lower corrosion rates were expected in Aghajari soil, the weight loss results showed higher corrosion rates in Aghajari soil (Figs. 6 and 7), which implicated that there was no negative correlation between soil resistivity and soil corrosivity.
3.2. Effect of time on corrosion rate
Figs. 7 and 8 show the changes in the corrosion rate of the coupons with time for Aghajari and Coral soils, respectively. Generally, in both soils, the corrosion rate had a descending trend with time which was due to the formation of protective corrosion products on the surface of the coupons, separating the bare steel from the corrosive environment of the soils [47,54,55]. However, in some cases, the descending trend could not be seen from the beginning. In the abiotic condition, for Aghajari soil at 15 and 20 wt% moisture contents or for Coral soil at 15 wt% moisture content, the corrosion rate increased with time until the third month and then decreased. At low moisture contents, corrosion products formed locally on the surface with relatively small surface adhesion, so within the first months they could not decelerate the corrosion, however, after three month the corrosion products covered the surface to an extent that started to protect the surface [55].
[image:11.596.102.498.133.328.2]
Moreover, the cracking in the protective layers because of the local decrease in pH was less likely. Therefore, the corrosion rate decreased with time.
[image:11.596.104.495.381.568.2]Figure 7. Variations in the corrosion rate of the coupons in Aghajari soil with time.
Figure 8. Variations in the corrosion rate of the coupons in Coral soil with time.
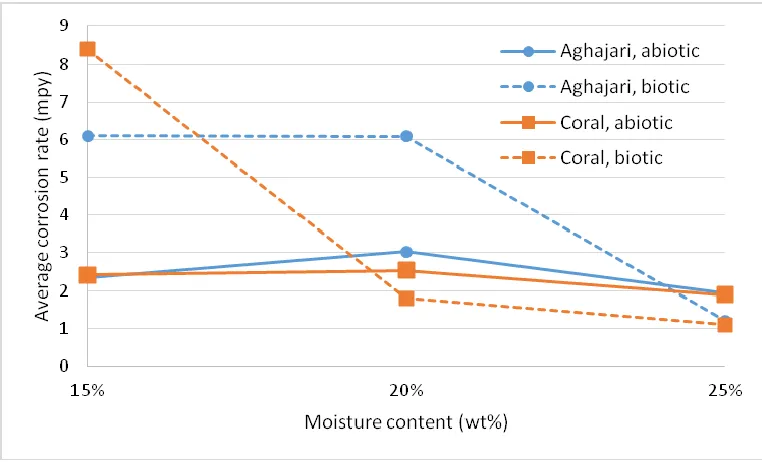
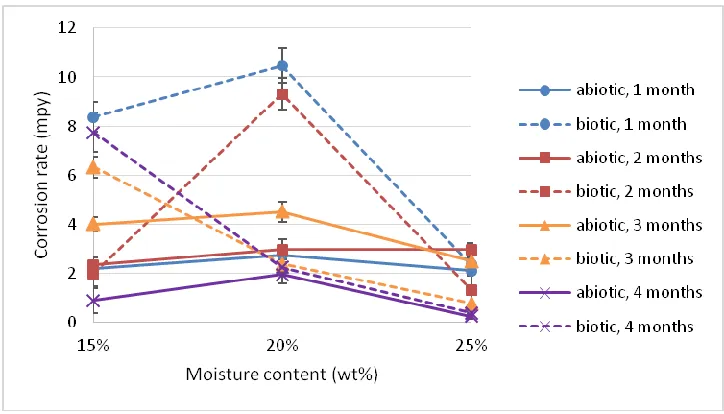
3.3. Effect of moisture content on corrosion rate
Fig. 9 shows the changes in the corrosion rate with moisture content for Aghajari soil. There is a maximum at 20 wt% moisture content for almost all the corrosion rate curves. The reason was the soil SMC. The measured SMC for Aghajari was approximately 20 wt%.
of oxygen to the surface of the steel; thus the corrosion rate declines [50,55]. Many research [41,59] have reported that an increase in the moisture content accelerated the corrosion reactions which seems contradictory to the results. This ostensible contradiction probably was because the range of moisture contents was below the soil SMC in all those research.
[image:12.596.117.479.259.466.2]Fig. 10 shows the changes in the corrosion rate with moisture content for Coral soil. Unlike Aghajari soil, there is no maximum in the corrosion rate curves. The corrosion rate decreased with the moisture content from the beginning for both abiotic and biotic conditions. The reason was that the SMC of Coral soil was approximately 16 wt%. Since moisture contents smaller than 15 wt% were not considered in the experiments, no maximum probably could be seen in the curves. Otherwise, there would be a maximum at 15 wt%.
[image:12.596.116.481.517.724.2]Figure 9. Variations in the corrosion rate of the coupons in Aghajari soil with moisture content.
3.4. Effect of SRB on corrosion rate
As shown in Figs. 9 and 10, at low moisture contents, the presence of SRB in the soils increased the corrosion rate dramatically. However, by increasing the moisture content, the corrosion rate rapidly dropped and became smaller than that in the abiotic condition. In the biotic condition, at moisture contents smaller than the SMC, an increase in the moisture content, in addition to increase the rate of charge transfer reactions as mentioned before, made the anaerobic conditions more favorable for SRB activity by discharging the oxygen trapped between soil particles. The high activity of SRB resulted in more sever corrosion. Moreover, bacteria need moisture to move in the soil and their movement is enhanced in saturated soils compared to soils that are unsaturated [60,61]. At low moisture contents, bacteria were not be able to spread on all over the surface and SRB-induced corrosion took place locally. On the other hand, at moisture contents exceeded the SMC, the activity of SRB did not change significantly because a strictly anaerobic condition had already reached, but, the movement of SRB over the surface became easier. Therefore a uniform and protective film of corrosion products and bacterial metabolites covered the surface and decreased the corrosion rate.
The acceptable corrosion rate for carbon steels in soil environments is defined 5 mpy [62,63]. It can be seen in Figs. 7 and 8 that for both soils the corrosion rate passed this acceptable rate mostly in the biotic condition at low moisture contents, especially 15 wt%.
3.5. Characterization of corrosion products
Pictures of the coupons in Aghajari and Coral soils after removing them from the glass containers are shown in Figs. 11 and 12, respectively. Unlike burial time, soil moisture content changed the appearance of the corrosion products significantly. It was observed that at low moisture contents, especially 15 wt%, two layers of corrosion products locally covered the surface with a relatively high thickness (e.g. Coupons 2& 4 in Fig. 11 and Coupons 1& 5 in Fig. 12). The outer layer was orange/brown phases, which formed on zones where the inner layer (black phases) had developed. In most cases, the outer layer along with soil particles, covered the inner layer in a way that the inner layer could not be seen without peeling off the outer layer. At high moisture contents, especially 25 wt%, the corrosion products evolved mostly as one layer on the surface and became more uniform and thinner (e.g. Coupons 6& 9 in Fig. 11 and Coupons 6& 10 in Fig. 12). The color of the corrosion products in this case varied from pale to dark green.
The pH of the soil around the coupons was measured after taking the coupons out from the containers (data not shown). No meaningful trend was found between changes in pH and the experimental parameters. The pH varied between 7.4 to 8.1 for Aghajari and 7.3 to 8.2 for Coral soil. The slight increase in pH was probably because of the formation of hydride-bearing corrosion products on the surface of the coupons.
Aghajari and Coral soils, respectively. The first five compounds in each sample–calcite, aragonite, dolomite, silica and ferrosilite–were related to the chemical content of the soils.
The corrosion products for Coupon 1 in Fig. 11 (Sample “15%, abiotic, 2m” in Table 4) were a mixture of goethite, akaganeite and magnetite. The oxidation state of iron in goethite and akaganeite is +3 and in magnetite is a mixture of +2 and +3. Therefore, iron in goethite and akaganeite had a higher tendency to be oxidized compared to that in magnetite. Since oxygen is more accessible in outer layers, goethite and akaganeite should form as the outer layer and magnetite as the inner layer of the corrosion products. Goethite is orange to brown, akaganeite is yellow to dark brown, and magnetite is black [41]. It was observed that the corrosion products on the surface of Coupon 1 in Fig 11 were black phases and on top of them orange/brown phases were present. The black phases can be seen at the bottom left side of Coupon 1. However, the orange/brown phases are hard to see because of their similar color to Aghajari soil. It can be concluded that the black phase in the corrosion products was magnetite and the orange/brown phase was a mixture of akaganeite and goethite.
1) 15%,ab,2m 2) 15%,ab,3m 3) 15%,b,1m 4) 15%,b,3m 5) 15%,b,4m
6) 20%,nob,4m 7) 25%,ab,4m 8) 25%,b,1m 9) 25%,b,3m 10) 25%,b,4m
Figure 11. Weight loss coupons in Aghajari soil after removing them from the soil: 1-10) coupon’s number; 15, 20 and 25%) moisture contents in wt%; ab) abiotic condition, b) biotic condition; 1, 2, 3 and 4m) burial times in month.
[image:14.596.63.536.308.627.2]
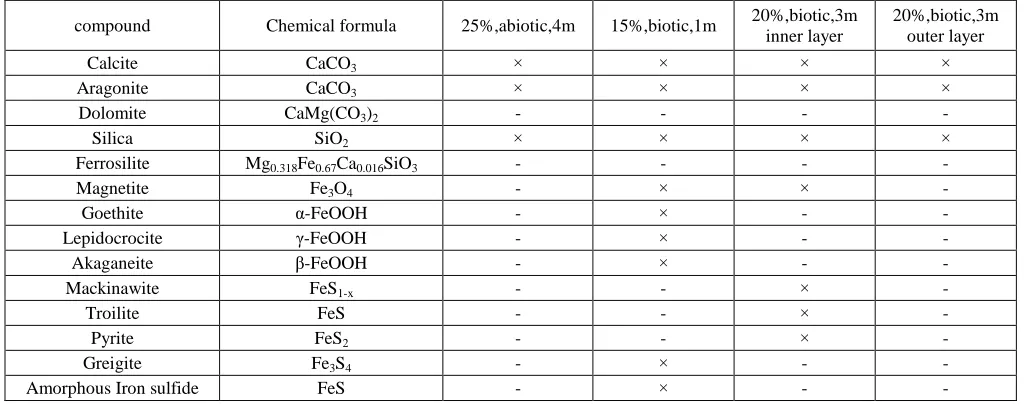
previous paragraph. For the same coupon, although soil had SRB and iron sulfides were expected to form on the surface, they were not detected in the XRD pattern of the outer layer. The same result was obtained for the outer layer of corrosion products for Coupon 8 in Fig. 12 (Sample “20%, biotic, 3m outer layer” in Table 5). However, in the inner layer of the latter, iron sulfides–troilite, pyrite and greigite–were detected as well as magnetite. Therefore, it can be concluded that at low moisture contents, two layers of corrosion products formed on the surface of the coupons. The outer layer was ferric oxyhydroxides–lepidocrocite, akaganeite or goethite– in both abiotic and biotic conditions. The inner layer was magnetite in the abiotic condition and a mixture of magnetite and iron sulfides in the biotic condition.
The corrosion products on the surface of Coupon 8 in Fig. 11 was a dark green layer. In the corrosion products (Sample “25%, biotic, 1m” in Table 4) in addition to two iron sulfides, so-called green rusts (GR) were detected. In the presence of corrosive species such as Cl-, SO42- or HCO3-, iron hydroxide which is one of the main corrosion products of carbon steels in soils, oxidizes to an intermediate hydroxyl GR. For instance, the reaction of Fe(OH)2 with HCO3- that produces GR 1 is as follows [64].
6Fe(OH)2 + HCO3- + 2H2O Fe4IIFe2III(OH)12CO3.2H2O + H+ + 2e- (3)
1) 15%,ab,2m 2) 15%,ab,3m 3) 15%,b,1m 4) 15%,b,2m 5) 15%,b,3m
[image:15.596.64.533.383.701.2]6) 20%,ab,3m 7) 20%,ab,4m 8) 20%,b,3m 9) 25%,ab,4m 10) 25%,b,1m
[image:16.596.34.569.235.485.2]
The GRs also can be seen in the corrosion products of Coupon 7 in Fig. 11 and Coupon 9 in Fig. 12 (Sample “25%, abiotic, 4m” in Tables 4 and 5). However, no iron sulfide was detected in the corrosion products of these coupons. Therefore, it can be concluded that at high moisture contents, the corrosion products consisted of GRs in the abiotic condition and a mixture of GRs and iron sulfides in the biotic condition.
Table 4. X-ray diffraction analysis results of the corrosion products formed on the coupons in Aghajari soil: ×) presence of a compound in a sample; 15 and 25%) moisture contents in wt%; 1, 2 and 4m) burial times in month.
compound Chemical formula 15%,abiotic,2m 25%,abiotic,4m 25%,biotic,1m 15%,biotic,4m outer layer
Calcite CaCO3 × × × ×
Aragonite CaCO3 - - - -
Dolomite CaMg(CO3)2 × × × ×
Silica SiO2 × × × ×
Ferrosilite Mg0.318Fe0.67Ca0.016SiO3 × × × ×
Magnetite Fe3O4 × - - -
Goethite α-FeOOH × - - ×
Lepidocrocite γ-FeOOH - - - ×
Akaganeite β-FeOOH × × - ×
Mackinawite FeS1-x - - - -
Troilite FeS - - × -
Pyrite FeS2 - - - -
Greigite Fe3S4 - - - -
Amorphous Iron sulfide FeS - - × -
Green rust 1 FeII4Fe III
2(OH)12(CO3) - - × -
Green rust 2 FeII3.6FeIII0.9(O,OH,SO4)9 - × - -
Green rust 3 FeII3FeIII(OH)8Cl·2H2O - × × -
Table 5. X-ray diffraction analysis results of the corrosion products formed on the coupons in Coral soil: ×) presence of a compound in a sample; 15, 20 and 25%) moisture contents in wt%; 1, 3 and 4m) burial times in month.
compound Chemical formula 25%,abiotic,4m 15%,biotic,1m 20%,biotic,3m inner layer
20%,biotic,3m outer layer
Calcite CaCO3 × × × ×
Aragonite CaCO3 × × × ×
Dolomite CaMg(CO3)2 - - - -
Silica SiO2 × × × ×
Ferrosilite Mg0.318Fe0.67Ca0.016SiO3 - - - -
Magnetite Fe3O4 - × × -
Goethite α-FeOOH - × - -
Lepidocrocite γ-FeOOH - × - -
Akaganeite β-FeOOH - × - -
Mackinawite FeS1-x - - × -
Troilite FeS - - × -
Pyrite FeS2 - - × -
Greigite Fe3S4 - × - -
[image:16.596.43.555.565.767.2]
Green rust 1 FeII4Fe III
2(OH)12(CO3) × - × ×
Green rust 2 FeII3.6FeIII0.9(O,OH,SO4)9 - - - -
Green rust 3 FeII3FeIII(OH)8Cl·2H2O × - × ×
[image:17.596.54.550.69.110.2]During corrosion of carbon steels in soils, at pH above 7.3, the transformation of iron hydroxides to ferric oxyhydroxides occurs according to Reaction 4 [65]. The transformation results in green zones of iron hydroxides surrounded by orange/brown oxyhydroxides which can be seen on the surface of Coupon 3 in Fig. 11 and Coupon 4 in Fig. 12. The green zones surrounded by orange/brown phases can be seen more at low moisture contents. An increase in the soil moisture content pushes Reaction 4 to the left and consequently more green phases form on the surface. This is evident from Figs. 15 and 16 that more green zones formed on the surface at 25 wt% moisture content compared to 15 and 20 wt% moisture contents.
3Fe(OH)2 + 2H+ 2FeOOH + Fe2+ + 2H2O + H2 (4)
1) 15%,ab,1m 2) 15%,ab,2m 3) 15%,ab,3m 4) 15%,ab,4m
5) 15%,b,1m 6) 15%,b,2m 7) 15%,b,3m 8)15%,b,4m
9) 20%,ab,1m 10) 20%,ab,4m 11) 25%,ab,1m 12) 25%,ab,4m
13) 20%,b,1m 14) 20%,b,4m 15) 25%,b,1m 16) 25%,b,4m
Figure 13. Stereo microscope images of the weight loss coupons in Aghajari soil after pickling: 1-16) coupon’s number; 15, 20 and 25%) moisture contents in wt%; ab) abiotic condition, b) biotic condition; 1, 2, 3 and 4m) burial times in month.
[image:17.596.56.540.317.716.2]
1) 15%,ab,1m 2) 15%,ab,2m 3) 15%,ab,3m 4) 15%,ab,4m
5) 15%,b,1m 6) 15%,b,2m 7) 15%,b,3m 8) 15%,b,4m
9) 20%,ab,1m 10) 20%,ab,4m 11) 25%,ab,1m 12) 25%,ab,4m
13) 20%,b,1m 14) 20%,b,4m 15) 25%,b,1m 16) 25%,b,4m
Figure 14. Stereo microscope images of the weight loss coupons in Coral soil after pickling: 1-16) coupon’s number; 15, 20 and 25%) moisture contents in wt%; ab) abiotic condition, b) biotic condition; 1, 2, 3 and 4m) burial times in month.
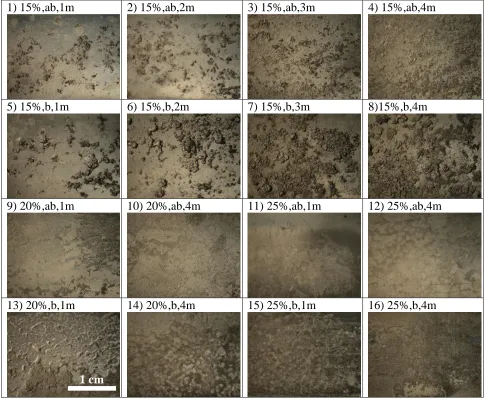
3.6. Morphology of corroded surfaces
Figs. 13 and 14 show the surface morphology of the corroded coupons in Aghajari and Coral soils, respectively, after pickling. Pitting corrosion was severe at low moisture contents, especially 15 wt%. At high moisture contents, soil particles covered the steel surface more uniformly and corrosion occurred more uniformly instead of being localized. An increase in the moisture content from 15 to 20 wt%, changed the deep narrow pits on the surface to shallow interconnected craters and further increase to 25 wt% changed the craters to a uniform surface.
At low moisture contents, pitting corrosion was more severe in the biotic condition compared to the abiotic condition (e.g., compare Coupons 5-8 with 1-4 in Figs. 13 and 14). This mean that SRB aggravated pitting corrosion at low moisture contents. However, at higher moisture contents, 25 wt% for Aghajari soil and 20 and 25 wt% for Coral soil, the surface morphology was uniform like that in
[image:18.596.58.541.70.467.2]
the abiotic condition. This is completely in accordance with the discussion in Section 3.4 explained that at moisture contents exceeded the SMC, SRB caused a uniform corroded surface.
At 15 wt% moisture content in both soils, pit density increased with time (Coupons 1-4 or 5-8 in Fig. 13 and 1-3 or 5-6 in Fig. 14). Apparently, this is in contrast with the results of the weight loss experiments, showed that the corrosion rate decreased with time, because the weight loss test gives the uniform corrosion rate and not the localized corrosion rate. Comparing the surface morphology of the coupons in two soils, it is obvious that the density and depth of pits were greater in Aghajari soil compared to those in Coral soil, particularly at 15 wt% moisture content. A possible reason could be the higher concentration of chloride ion in Aghajari soil (Section 3.1).
4. CONCLUSIONS
Simultaneous effects of SRB, soil type and moisture content on corrosion behavior of carbon steel API 5L X65 were studied by weight loss measurement. Results showed that the corrosion rate of the coupons in Aghajari soil was greater than that in Coral soil due to higher concentrations of corrosive ions and a larger percentage of fine particles in Aghajari soil. However, no specific dependence was found between the corrosion rate and soil resistivity. Generally, the corrosion rate showed a decreasing trend with time, but increased with soil moisture content up to the soil SMC and then decreased. The presence of SRB in the soils, although increased the corrosion rate and aggravated pitting corrosion at low moisture contents, had a protective effect at high moisture contents. At low moisture contents, two layers of corrosion products formed on the surface of the coupons. XRD analysis showed that the outer layer was ferric oxyhydroxides. The inner layer was magnetite in the abiotic condition and a mixture of magnetite and iron sulfides in the SRB-active condition. However, at high moisture contents the corrosion products mostly appeared as one layer on the surface which was GRs in the abiotic condition and a mixture of GRs and iron sulfides in the SRB-active condition.
ACKNOWLEDGEMENTS
The authors wish to thank Mrs. Iran Alemzadeh and Mrs. Zahra Ghobadi from Biochemical and Bioenviromental Research Center, Sharif University of Technology, Tehran, Iran; Mr. Abbas Yousefi from Par-e-Tavous Research Institute, Mashhad, Iran; Mr. Behnam Rasekh from Research Institute of Petroleum Industry; and Iranian Offshore Oil Company, Kharg Island, Iran for their invaluable helps and suggestions. The present work financially supported by Sharif University of Technology, project No. M985.
References
1. A. Cosham, P. Hopkins, A. Cosham, P. Hopkins, The assessment of corrosion in pipelines- guidance in the pipeline defect assessment manual, in: Amsterdam, Netherlands, 2004.
3. Mitigation of External Corrosion on Buried Pipeline Systems, Canadian Association of Petroleum Producers, 2009.
4. Gas Pipeline Incidents: 8th Report of the European Gas Pipeline Incident Data Group, 2011. 5. S. Bullard, B. Conivo, in: Whats New Whats Next, 2005.
6. M. Baker, Pipeline Corrosion, U.S. Department of Transportation, Pipeline and Hazardous Materials Safety Administration Office of Pipeline Safety, 2008.
7. M.R. Simmons, Oil and Gas "Rust": An Evil Worse than Depletion, in: Offshore Technology, Houston, TX, 2008.
8. S.Y. Li, Y.G. Kim, Y.T. Kho, T. Kang, Corrosion Behavior of Carbon Steel Influenced by Sulfate Reducing Bacteria in Soil Environments, in: NACE International, 2003.
9. M. Barbalat, L. Lanarde, D. Caron, M. Meyer, J. Vittonato, F. Castillon, S. Fontaine, P. Refait,
Corros. Sci., 55 (2012) 246–253.
10. J. Xu, K. Wang, C. Sun, F. Wang, X. Li, J. Yang, C. Yu, Corros. Sci., 53 (2011) 1554–1562. 11. X. Zhao, J. Duan, B. Hou, S. Wu, J. Mater. Sci. Technol., 23 (2007) 323–328.
12. E. Miranda, M. Bethencourt, F.J. Botana, M.J. Cano, J.M. Sánchez-Amaya, A. Corzo, J.G. de Lomas, M.L. Fardeau, B. Ollivier, Corros. Sci., 48 (2006) 2417–2431.
13. J. Lin, R. Ballim, Afr. J. Biotechnology, 11 (2012) 15736–15747. 14. S.E. Coetser, T.E. Cloete, Crit. Rev. Microbiol., 31 (2005) 213–232. 15. I.B. Beech, C.C. Gaylarde, Rev. Microbiol., 30 (1999) 117–190.
16. F.M. AlAbbas, C. Williamson, S.M. Bhola, J.R. Spear, D.L. Olson, B. Mishra, A.E. Kakpovbia, J. Mater. Eng. Perform., 22 (2013) 3517–3529.
17. S.Y. Li, Y.G. Kim, K.S. Jeon, Y.T. Kho, T. Kang, Corros., 57 (2001) 815–828. 18. C. Xu, Y. Zhang, G. Cheng, W. Zhu, Chin. J. Chem. Eng., 14 (2006) 829–834.
19. P.J. Antony, R.K. Singh Raman, R. Mohanram, P. Kumar, R. Raman, Corros. Sci., 50 (2008) 1858–1864.
20. C. Sun, J. Xu, F. Wang, Ind. Eng. Chem. Res., 50 (2011).
21. D. Enning, J. Garrelfs, Appl. Environ. Microbiol., 80 (2014) 1226–1236. 22. J. Xu, C. Sun, M. Yan, Int. J. Electrochem. Sci., 7 (2012) 11281–11296. 23. C. Sun, J. Xu, F.H. Wang, C.K. Yu, Mater. Chem. Phys., 126 (2011) 330–336. 24. X. Sheng, Y.-P. Ting, S.O. Pehkonen, Corros. Sci., 49 (2007) 2159–2176.
25. J.E.G. González, a F.J.H. Santana, J.C. Mirza-rosca, Corros. Sci., 40 (1998) 2141–2154. 26. Q. Zhang, P. Wang, D. Zhang, Int. J. Electrochem. Sci., 7 (2012) 11528–11539.
27. Iran increases oil storage capacity to foil EU sanctions, PressTV, Accessed: March 2012. http://edition.presstv.ir/detail/232470.html.
28. R. Javaherdashti, Anti-Corros. Methods Mater., 46 (1999) 173–180.
29. C.P. Aumen, Survey of Existing Buried Gas Pipelines and Their Seismic Resistance, American Society of Mechanical Engineers, 1980.
30. R. Baboian, Corrosion Tests and Standards: Application and Interpretation, Second Edition, ASTM International, 2005.
31. Kharg Island Gas Gathering and NGL Recovery Project: Geotechnical Investigation and Foundation Engineering, Pazhoohesh Omran Rahvar, 2008.
32. A. Benmoussa, M. Hadjel, M. Traisnel, Mater. Corros., 57 (2006) 771–777. 33. R.O. Miller, Saturation Percentage, Colorado State University.
34. E.A. Ghazy, M.G. Mahmoud, J. Am. Sci., 7 (2011) 604–608.
35. L.L. Barton, W.A. Hamilton, eds., Sulphate-Reducing Bacteria: Environmental and Engineered Systems, Cambridge University Press, Cambridge, 2007.
36. R.M. Atlas, Handbook of Media for Environmental Microbiology, Second Edition, CRC Press, 2005.
37. J.R. Postgate, Appl. Microbiol., 11 (1963) 265–267.
40. Microbiology: Practical Guide (A), Eötvös Loránd University, 2010. 41. A.I.M. Ismail, A.M. El-Shamy, Appl. Clay Sci., 42 (2009) 356–362. 42. M.G. Fontana, Corrosion Engineering, Tata McGraw-Hill, 2005. 43. B. Jegdić, P.S. Radovanović, Sci. Tech. Rev., 6 (2011) 50–56.
44. P. Wattanaphan, Studies and Prevention of Carbon Steel Corrosion and Solvent Degradation during Amine-Based CO2 Capture from Industrail Gas Streams, University of Regina, 2012. 45. T.M. Liu, Y.H. Wu, S.X. Luo, C. Sun, Mater. Werkst., 41 (2010) 228–233.
46. Soil Survey Manual, University Press of the Pacific, Honolulu, 1993.
47. Step 7-Corrosion Guide, in: Helical Screw Foundation System Design Manual for New Construction, A.B. Chance Company, Centralia, MO, USA, 2003.
48. D.M. Kopec, Coop. Ext. Turf Tips Univ. Ariz., 2 (1995).
49. M. Kižlo, A. Kanbergs, Sci. J. Riga Tech. Univ. Power Electr. Eng., 25 (2010) 43–46. 50. S.K. Gupta, B.K. Gupta, Corros. Sci., 19 (1979) 171–178.
51. M. Norin, T.G. Vinka, Mater. Corros., 54 (2003) 641–651.
52. A.S. Ikechukwu, N.H. Ugochukwu, Int. J. Eng. Sci., 3 (2014) 38–47. 53. J.N. Murray, P.J. Moran, Corros., 45 (1989) 34–43.
54. I.S. Cole, D. Marney, Corros. Sci., 56 (2012) 5–16.
55. N.N. Glazov, S.M. Ukhlovtsev, I.I. Reformatskaya, A.N. Podobaev, I.I. Ashcheulova, Prot. Met., 42 (2006) 601–608.
56. A. Al-Judaibi, A. Al-Moubaraki, Adv. Biol. Chem., 03 (2013) 264–273.
57. S. Kakooei, M.C. Ismail, B. Ariwahjoedi, World Appl. Sci. J., 17 (2012) 524–531. 58. W. Hamilton, Biofouling, 19 (2003) 65–76.
59. N. Yahaya, K.S. Lim, Malays. J. Civ. Eng., 23 (2011) 24–32. 60. D. Griffin, G. Quail, Aust. J. Biol. Sci., 21 (1968) 579–82.
61. G.M. Pierzynski, G.F. Vance, J.T. Sims, Soils and Environmental Quality, CRC Press, 2005. 62. A. Groysman, Anti-Corrosion Management, Environment and Quality at the Oil Refining
Industry, Oil Refineries Ltd, Haifa, Israel.
63. H.M. Tawancy, A. Ul-Hamid, N.M. Abbas, Practical Engineering Failure Analysis, CRC Press, 2004.
64. Guo Cheng Lv, Zi Se Wang, Li Mei Wu, Chunchun Xu, Anti-Corros. Methods Mater., 58 (2011) 39–45.
65. T. Ishikawa, Y. Kondo, A. Yasukawa, K. Kandori, Corros. Sci., 40 (1998).