*[email protected]; phone 44 141 548-3431; http://spider.science.strath.ac.uk/sipbs/staff/David_Li.htm
Hardware-friendly bi-exponential fluorescence lifetime imaging
algorithms and phasor approaches
David Li*
a, Yu Chen
ba
University of Strathclyde, Strathclyde Institute of Pharmacy & Biomedical Sciences, Centre for
Biophotonics, Glasgow UK;
bUniversity of Strathclyde, Department of Physics, Glasgow UK
ABSTRACT
A newly developed hardware-friendly non-iterative fluorescence lifetime imaging (FLIM) analysis method was verified in an FPGA chip. Its performances were demonstrated on two-photon FLIM images of gold nanorods (GNRs)-Cy5 labelled Hela cells. The results obtained by the proposed method can be presented in a polor plot to be compared to the widely used phasor (Phasor) approach. Combining our method with Phasor will be very useful in FLIM analysis.
Keywords: Fluorescence lifetime imaging microscopy (FLIM), Time-correlated single-photon counting, Two-photon FLIM, Gold nanorods.
1.
INTRODUCTION
Time-correlated single photon counting (TCSPC) systems are widely as the gold standard fluorescence lifetime imaging (FLIM) owing to high temporal resolution. The acquisition speed has been significantly enhanced for the past few years by applying multiple-channel TCSPCs [1]. FLIM image analysis, on the other hand, still heavily rely on iterative based software. Gated time domain (TD) (or frequency domain, FD) intensified CCD based FLIM systems can achieve fast acquisition when the number of gates or the number of phase images (for FD systems), denoted as M for simplicity, is only two [2]. In commercially available systems, however, the number of gates is usually higher than 10 to ensure enough lifetime resolvability within the field of view [2, 3]. A larger M not just slows down the acquisition, but also complicates image analysis. Commercial FLIM software are usually based on nonlinear iterative analysis methods and slow making them impossible for real-time applications.
We previously developed a high-speed hardware embedded FLIM processors using center of mass methods (CMM) [4] and demonstrated video-rate FLIM analysis with a 32×32 CMOS single-photon avalanche diode (SPAD) array [5, 6], but it is only single-exponential (shown in RESULTS). For most biological questions, at least a bi-exponential model is required. Although some recently published approaches including widely used approximation methods [7, 8], Phasor [7, 9], and moment methods (MoM) [7, 10] are bi-exponential, they either underestimate or need to fix some parameters. To study cellular protein-protein interactions using FLIM-FRET (fluorescence resonance energy transfer) techniques [1, 7, 11, 12], for example, biologists usually conduct a donor-only experiment to estimate the donor lifetime (D) and then fix
D to calculate the population of donors participating FRET and the reduction in D in the presence of acceptors [1, 7]. As the lifetime characteristics are usually very sensitive to the local environments (such as pH, temperature, etc) of fluorophores, fixing D might cause artefacts especially when the environments for donor-only and donor-with-acceptor experiments are not exactly the same. Therefore, it is still desirable to resolve all lifetimes and fraction components to obtain robust results.
2.
METHODS
Assume the fluorescence density to be measured by the detector is f(t) = a1 exp(-t/1) + a2 exp(-t/2) = a1 [fD exp(-t/1) + (1– fD)exp(-t/2)], 2 > 1, shown in Fig. 1(a), where a1 and a2 are the prescalars, 1 and 2 the lifetimes, fD = a1/(a1+ a2), and for simplicity we ignore the instrumental response function (IRF) and background noise. There are M time bins (bin width = h) in the TCSPC module, and the photon count in the j-th bin is N
j (j = 1,…, M). Figure 1(b) shows a typical phasor plot [7, 9] of a bi-exponential decay with 1 = 0.1ns, 2 = 2.8ns, and the measurement window T = Mh = 10ns. This can be a typical FLIM dataset of a GNR-fluorophore labelled cells, where the lifetime of GNRs is close to 100ps. The phasor plot shows extremely nonlinear in fD when the ratio 2/1 is large making robust analysis difficult. Previously reported bi-exponential methods are unable to calculate these parameters accurately [7, 13, 16]. Traditional MoM methods [13] usually used the 0th, 1st, 2nd, 3rd moments to solve (a
1, a2, 1, 2) or the 1st, 2nd, and 3rd moments to solve (a1, a2, 1) with 2 fixed [7, 10]. Using the 3rd moment, however, requires a much bigger measurement window to 2 ratio, T/2 (therefore reducing the photon efficiency) and complicates computations. We use the first count N1 ~ (a1 + a2)h, instead, with the 0th, 1st, and 2nd, to solve (a
1, a2, 1, 2).
We can, instead, use the photon in the first bin, N1, and 0th, 1st, and 2nd moments to solve (a1, a2, 1, 2). Neglecting the derivations, we have
2
1 1 2 2 1 2 1 2 1
2 2
2 1
2
1 1 1
0.5 4( ) / , , ,
0.5 4( ) / , , / ,
, , 0.5 , = {1/2, 1,...,1,1/2}.
M j j
M j j j
M j j j jj j j
G G NG X K a K N a N K
G G NG X K G K Y N X K X N K N h
N C N X C t N Y C t N C
Figure 1. (a) A bi-exponential fluorescence density and (b) phasor plot of the fluorescence density f(t).
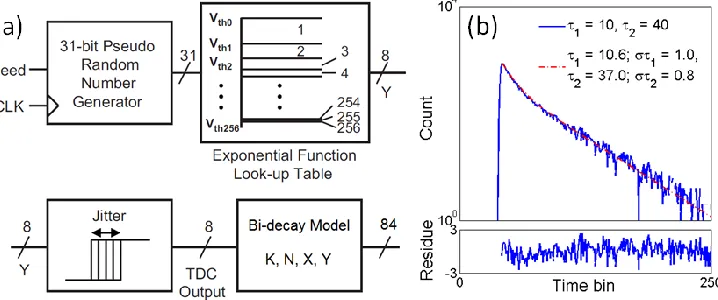
[image:2.612.69.546.276.502.2] [image:2.612.127.486.529.679.2]Without using the 3rd moment, the above formulation is much simpler. To verify the proposed method, we used an
FPGA development board to build a 231-1 pseudo random bit sequence generator, a look up table for the fluorescence
emission density f(t) = 0.7exp(-t/) + 0.3exp(-t/40), and a jitter module for the IRF to emulate an 8-bit time-to-digital converter (TDC) in a TCSPC system, as shown in Fig. 2(a). The simulator generates 20k counts, builds a histogram, and has four registers to acquire K, N, X, and Y. These registers are not just used for lifetime estimations, but also as data compressors so that it is not necessary to readout all raw TDC data. In realistic FLIM experiments, the laser intensity should be dimmed to avoid pile-up effects, and therefore most TDC outputs are zeros (no photons). With the proposed processor, data can reduced from 1.6Gbit to only 84bit if 20k photons are detected with a detection ratio (the number of non-zero TDC outputs to the number of all TDC data) of 10%. Figure 2(b) shows a histogram generated by the FPGA, a fitted curve, and estimated 1 and 2 using the proposed approach.
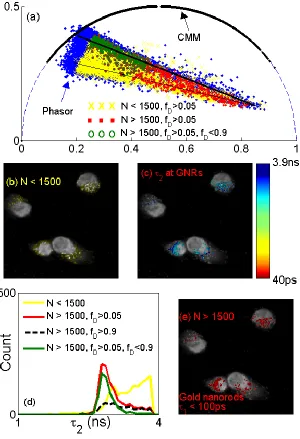
Figure. 3(a) Polar plots for different methods, (b) area for N < 1500, fD > 0.05, (c) 2 on GNRs, (d) 2 histograms, and (e)
[image:3.612.158.458.212.651.2]3.
RESULTS
Here we demonstrate the performances of the proposed method on two-photon FLIM images of GNR-Cy5 labelled Hela cells. Gold nanorods were conjugated with Cy5 labelled oligonucleotide through a functionalization method described elsewhere [15]. Nanoprobes (GNR-Cy5) were then uptaken by Hela cells through incubation. Two-photon FLIM was performed using a confocal microscope (LSM 510, Carl Zeiss) equipped with a TCSPC module (SPC-830, Becker & Hickl GmbH). A femtosecond Ti:Sapphire laser (Chameleon, Coherent) was tuned at 730nm with a repetition rate of 80 MHz and duration less than 200 fs. Figure 3(a) shows polar plots for the proposed method for different conditions. These plots are in good agreement with the Phasor polar plot (blue dots). The polar plots show one brighter (thicker black) straight line connecting the far right (GNRs; lifetime < 100ps) and a point near the unit circle and the bottom dimmer (thinner) straight line. The curve marked as yellow crosses represents the area of low nanoprobes uptaken and high contribution from cell background (autofluoresence) with N < 1500 as shown in Fig. 3(b). Areas containing nanoprobes with stronger emissions (N > 1500) are in green open circles (0.05 < fD = a1/(a1+ a2) < 0.90) or in red dots (fD > 0.05). The green 2 histogram clearly shows 2 of 2.9ns, reduced from 3.8ns of free cy5, when there is energy transfer between GNRs and Cy5 [14]. It is clear that the single-exponential CMM is not able to tell the story of true interactions. Fig. 3(c) shows the 2 image indicating 2 reduced on cells with gold nanoprobes (red 2 histogram in Fig. 3(d)). The red polar plot in Fig 3(a) and red 2 histogram in Fig. 3(d) indicates the majority of the interactions happen on the top straight line. Figure 3(e) indicates locations of GNRs with N > 1500, the average 1 is less than 100ps, consistent with the typical lifetime of GNRs as reported previously [15].
4.
CONCLUSION
We have demonstrated an innovative hardware-friendly bi-exponential FLIM analysis method. The new method can be implemented in FPGA chips as a data compressor or a FLIM processor. It can be used together with widely used Phasor to provide thorough FLIM analysis. For future developments, we will implement it in a TCSPC system or a CMOS TCSPC camera [6] for real-time FLIM applications.
Acknowledgements
The authors would like to acknowledge the Royal Society (RG140915), BBSRC (BB/K013416/1), G. Wei, J. Sutter, W. Li, R. Y. and M. M. Qotob for this work.
REFERENCES
[1] Poland, S.P., et al., "Time-resolved multifocal multiphoton microscope for high speed FRET imaging in vivo," Opt. Lett. 39(20), 6013-6016 (2014).
[2] Grant, D.M., et al., "High speed optically sectioned fluorescence lifetime imaging permits study of live cell signaling events," Opt. Express 15(24), 15656-15673 (2007).
[3] Omer, T., et al., "Reduced temporal sampling effect on accuracy of time-domain fluorescence lifetime Förster resonance energy transfer," J. Biomed. Opt. 19(8), 086023-086023 (2014).
[4] Li, D.-U., et al., "Hardware implementation algorithm and error analysis of high-speed fluorescence lifetime sensing systems using center-of-mass method," J. Biomed. Opt. 15(1), 017006-017006-10 (2010).
[5] Li, D.D.U., et al., "Video-rate fluorescence lifetime imaging camera with CMOS single-photon avalanche diode arrays and high-speed imaging algorithm," J. Biomed. Opt. 16(9), 096012-096012-12 (2011).
[6] Li, D.D.-U., et al., "Time-domain fluorescence lifetime imaging techniques suitable for solid-state imaging sensor arrays," Sensors 12(5), 5650-5669 (2012).
[7] Leray, A., et al., "Spatio-temporal quantification of FRET in living cells by fast time-domain FLIM: A comparative study of non-fitting methods," PLoS ONE 8(7), e69335 (2013).
[8] Padilla-Parra, S., et al., "Non fitting based FRET–FLIM analysis approaches applied to quantify protein–protein interactions in live cells," Biophys. Rev. 3(2), 63-70 (2011).
[9] Stringari, C., et al., "Phasor approach to fluorescence lifetime microscopy distinguishes different metabolic states of germ cells in a live tissue," Proceedings of the National Academy of Sciences 108(33), 13582-13587 (2011).
[11] Gehlsen, U., et al., "Two-photon fluorescence lifetime imaging monitors metabolic changes during wound healing of corneal epithelial cells in vitro," Graefe's Archive for Clinical and Experimental Ophthalmology 250(9), 1293-1302 (2012).
[12] Carlin, L.M., et al., "A Targeted siRNA Screen Identifies Regulators of Cdc42 Activity at the Natural Killer Cell Immunological Synapse," Science Signaling 4, ra81-ra81 (2011).
[13] Isenberg, I. and R.D. Dyson, "The Analysis of Fluorescence Decay by a Method of Moments," Biophys. J. 9(11), 1337-1350 (1969).
[14] Zhang, Y., D.J.S. Birch, and Y. Chen, "Two-photon excited surface plasmon enhanced energy transfer between DAPI and gold nanoparticles: Opportunities in intra-cellular imaging and sensing," Appl. Phys. Lett. 99(10), 103701 (2011).
[15] Zhang, Y., et al., "Surface plasmon enhanced energy transfer between gold nanorods and fluorophores:application to endosytosis study and RNA detection. Faraday Discussions," doi: 10.1039/C4FD00199K (2014).