This is a repository copy of Impulse response estimation for the auralisation of vehicle
engine sounds using dual channel FFT analysis.
White Rose Research Online URL for this paper:
http://eprints.whiterose.ac.uk/78004/
Version: Published Version
Proceedings Paper:
Shelley, Simon Benedict, Murphy, Damian Thomas orcid.org/0000-0002-6676-9459 and
Goodwin, Simon (2013) Impulse response estimation for the auralisation of vehicle engine
sounds using dual channel FFT analysis. In: Bresin, Roberto, (ed.) Proceedings of the
Sound and Music Computing Conference 2013. Sound and Music Computing Conference
2013, 30 Jul - 02 Aug 2013 Logos Verlag Berlin , SWE , pp. 506-511.
[email protected] https://eprints.whiterose.ac.uk/
Reuse
Items deposited in White Rose Research Online are protected by copyright, with all rights reserved unless indicated otherwise. They may be downloaded and/or printed for private study, or other acts as permitted by national copyright laws. The publisher or other rights holders may allow further reproduction and re-use of the full text version. This is indicated by the licence information on the White Rose Research Online record for the item.
Takedown
If you consider content in White Rose Research Online to be in breach of UK law, please notify us by
Impulse Response Estimation for the Auralisation of Vehicle Engine Sounds
using Dual Channel FFT Analysis
Simon Shelley and Damian Murphy Audio Lab,
University of York, UK
Simon Goodwin Central Technology Department, Codemasters Software Company, UK
ABSTRACT
A method is presented to estimate the impulse response of a filter that describes the transformation in sound that takes place between a close-mic recording of a vehicle engine and the sound of the same engine at another point in or near to the vehicle. The proposed method makes use of the Dual Channel FFT Analysis technique and does not require the use of loudspeakers, computer modelling or mechanical devices. Instead, a minimum of two microphones is required and the engine itself is used as the source of sound. This is potentially useful for virtual reality applications or in sound design for computer games, where users select their virtual position at points inside or outside the vehicle. A case study is described to examine the method in practice and the results are discussed. The described method can be readily extended for surround sound applications using spatial microphone array recording techniques.
1. INTRODUCTION
In this work, we are interested specifically in the accurate auralisation of the sound of an engine at points inside and near to its vehicle, using a close-mic recording of the en-gine as the source signal. The idea is that using a single set of engine sounds recorded at only one point, Finite Impulse Response (FIR) filters can be used to accurately recreate the sound at other points in the vehicle in real-time. In virtual reality applications such as computer driving sim-ulations, this reduces the need for multiple sets of sound assets recorded at different points around the vehicle. Also, multi-channel surround-sound auralisation can be achieved without drastically increasing the amount of memory and disk space that is required by the application. Another advantage of such an approach is that a recorded engine sound from one car can be easily transplanted into another virtual vehicle, while preserving the acoustic characteris-tics of the vehicle. In addition, using only one sound source for the engine means that any sound design, audio effects or alterations that might be applied to the engine recording, for example to simulate a damaged or enhanced engine in a computer game, need only be applied once.
Copyright:c2013 Simon Shelley et al. This is an open-access article distributed under the terms of theCreative Commons Attribution 3.0 Unported License, which permits unrestricted use, distribution, and reproduction in any medium, provided the original author and source are credited.
In order to implement the auralisation of a vehicle engine at different points in space around the vehicle, appropri-ate predetermined acoustic impulse responses are required. These impulse responses, known asacoustic transfer func-tions when transformed into the frequency domain, de-scribe the relation between the close-mic recording of the engine and the sound of the same engine at the points of interest around the vehicle. This article presents a method to obtain the impulse responses that describe the filters required for the auralisation process.
The work described in this paper is designed to be applied in gaming, computer simulation and virtual reality applications that require the design of filters to describe complex vibro-acoustic systems for auralisation purposes. The use of FIR filters is particularly useful in applications where users are given the choice of switching in real-time between multiple listener positions. In driving computer games, for example, users are often given the choice of multiple camera positions, either internal or external to the vehicle, from which to observe the action. The proposed technique may also have use in other areas relating to sound and music computing. One potential such application could be the estimation of vibro-acoustic transfer functions that take place in a classical string instrument such as a violin. In this case the string of the instrument would act as the sound source for the measurement, perhaps recorded at close distance by an electric pick-up.
swept-sine wave, as described in [7].
Unfortunately both the loudspeaker, and to a lesser extent the microphone, take up space within the measurement environment. This means that their presence not only has some effect on the transfer function itself, but also that there are limitations on where in the vehicle they can be placed. With current technology it is possible to build high quality microphones that take up very little space, however high quality loudspeakers with a wide frequency range and a flat frequency response can be difficult to fit into small awkward spaces. A common solution that is employed to deal with this problem is to exploit the acoustic reciprocity theorem, which dictates that the positions of the loudspeaker and microphone are interchangeable [8, 9]. This means for example that to measure the transfer function between a point in a car engine bay and the ears of the driver, the loudspeaker can be placed in the driver’s position where there is plenty of space, and the microphone can be placed under the bonnet of the car in the engine bay.
Transducers that are used to measure the acoustic transfer function in this way should ideally have omni-directional characteristics, or at least have a known directivity pattern that is frequency independent. They should also have a flat frequency response and cover a wide spectrum of audible frequencies. This presents another problem, because in practice it is highly difficult to build a loudspeaker that meets these specifications and the introduction of inaccu-racies are inevitable.
In addition to these issues, measurements using loudspeakers and microphones do not take into account the structure-borne contribution of the acoustic transfer func-tion. The structure-borne contribution is mostly made up of acoustic energy transferred through the chassis of the car via the connecting power-train mounts. This makes up a significant part of the overall sound experienced in a vehicle interior [10]. Calculation of the structure-borne contribution is not trivial, and can be done using predic-tive models [11] or measurement using mechanical devices [12]. Both approaches have limitations and require consid-erable time and effort to implement.
Contrary to the requirement of Transfer Path Analysis techniques, to meet the goals of this work the separation of air-borne and structure-borne components of the acoustic transfer function is not a necessity. Instead, the goal is to generate a filter that integrates all components and results in a realistic sounding and immersive auralisation of the engine at different points around the vehicle. As an alter-native, the use of Dual Channel Fast Fourier Transform (FFT) Analysisis investigated as a relatively fast and sim-ple method to obtain a broadband transfer function that can be used to derive a transformation filter [13, 14]. With the proposed technique, the engine itself is used as the sound source, removing any requirement for a loudspeaker or me-chanical devices, and instead using only microphones. Al-though a minimum of two microphones is required, and this basic case is considered in this paper, the method can be readily extended to measure multiple points in and around the vehicle simultaneously, and also to capture
spa-tial information at the points of interest using a microphone array such as the coincident tetrahedralsoundfield micro-phone [15] or a spaced multichannel array [16].
The paper is organised as follows: Section 2.1 introduces the dual channel FFT analysis technique. In Section 2.2 the proposed method is described using a case study in which an impulse response is measured in a car. Section 2.3 presents an analysis of the results of the case study, demonstrating the validity of the method. Finally, conclu-sions and future work are found in Section 3
2. METHOD 2.1 Dual Channel FFT Analysis
Using dual channel FFT analysis, it is possible to calcu-late the transfer function that describes the relationship be-tween two signals, with the assumption that they are cou-pled by alinear time-invariant(LTI) system [13, 14]. This relationship is described by (1) where a(t) is the input signal, b(t) is the output signal and h(t) is the impulse response of the linear time-invariant system that describes the relationship between the two signals.
b(t) =a(t)∗h(t) =
Z ∞
−∞
a(t−τ).h(τ)dτ (1)
The LTI system can also be described in the frequency domain by its transfer function H(ω), which can be calculated by taking the Fourier Transform of the impulse response h(t). The convolution theorem states that the output of the LTI system in the frequency domainB(ω)
is the product of the input spectrumA(ω)and the transfer function of the systemH(ω). The transfer function of the system can therefore be calculated by dividing the output spectrumB(ω)by the input spectrumA(ω), as follows:
H(ω) =B(ω)
A(ω) (2)
In theory, by applying a broadband signal to the input of the system that covers the frequency range of interest, the transfer function of the system can be directly measured using (2). However real-world measurements can be contaminated with noise which causes a degree of error. The effect of this noise can be greatly reduced by repeating the measurement and performing a complex average [13]. This is done in practice by multiplying both the numerator and the denominator of (2) by the complex conjugate
A∗(ω)in order to give the cross spectrum G
AB and the input auto spectrumGAA. Averages are taken forGABand
GAAover a number of measurements in order to calculate the transfer function H(ω), as described by (3). This complex averaging process has the effect of reducing the level of random noise introduced in the output signalb(t).
H(ω) =GAB GAA
(3)
A
B
Figure 1. Diagram showing positions of microphones in the car used for the case study.
To demonstrate how the Dual Channel FFT Analysis technique can be used to obtain the transfer function between two recordings of an engine made at different points within a vehicle, a case study is described in the following section.
2.2 Case Study
To describe the method, we look at the specific case where the aim is to auralise the engine sound in the cockpit of a real car, a Subaru Impreza, using a close-mic recording of the engine. In order to obtain the data required to perform the dual channel FFT analysis, the engine must first be simultaneously recorded at a close location and at any other locations where the sound will be auralised. In practice, to record the engine at a close distance, an omni-directional Behringer ECM8000 microphone was suspended under the bonnet of the car in a small pocket of open space near the engine, position A. A second omni-directional microphone, an Earthworks M30, was mounted on a microphone stand inside the cockpit at the position of the driver’s head, position B. Figure 1 illustrates the microphone positioning inside the car. The two measurement microphones have relatively flat frequency responses in the frequency range of interest, and although ideally they should be perfectly matched, they were considered close enough in specification for this case study.
Measurements were performed by recording the engine simultaneously at both microphone positions while con-trolling the throttle of the engine in a neutral gear with the car standing still. In order to measure the full frequency range of sound that the engine of the car can produce, the revolutions per minute(RPM) of the engine were increased from a low idling level to a relative high rate and back to idling speed for a duration of about 23 seconds. The process was repeated 12 times and recordings were made at positionAandBsimultaneously, resulting in 12 record-ings of the engine from each microphone, 24 in total. All recordings were made at a sampling rate of 96 kHz, and a bit depth of 24 bits per sample.
The sweep of the RPM of the engine was performed by the driver while monitoring a stopwatch and the tachome-ter of the car in order to attempt to produce similar record-ings in each of the 12 measurements. It should be noted that the exact reproduction of engine sweep in each mea-surement was not a requirement during this process. The
Frequency (kHz)
N
or
m
al
is
ed M
agni
tude
(dB
)
(b) Frequency Response
0 0.2 0.4 0.6 0.8 1.0 1.2 1.4 1.6 1.8 2.0 0
-20
-40
-60
-80
(a) Impulse Response
N
or
m
al
is
ed A
m
pl
itude
-1 -0.6 -0.2 1
0.6
0.2
0 400 600 800
Time (ms)
200 1000
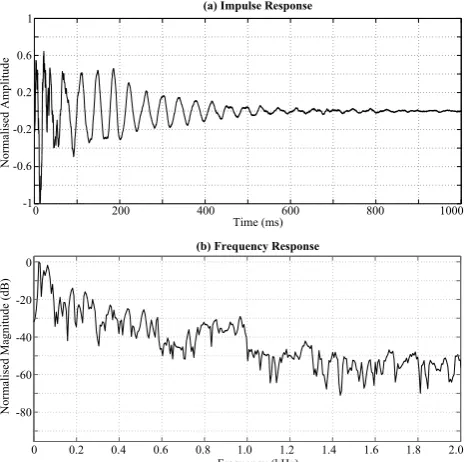
Figure 2. (a) Impulse response and (b) frequency response of derived FIR filter.
aim of repeating the measurements was to provide a large amount of data in order to attempt to improve the signal to noise ratio of the result using the averaging process de-scribed in in Section 2.1.
2.3 Analysis
For each of the 12 recordings, the two signals A and B were split into overlapping segments with a length of M=262144 samples and an overlap of M/2 samples. Each segment was windowed using a Hann function and then zero padded at the end to a length of 2M before calculating the discrete Fourier Transform. The cross spectrumGABand the input auto spectrumGAAwere then estimated for each segment and averages were taken over all measurements, according to the Welch method [17]. The transfer function was then calculated using (3) and finally the signal was cleaned by removing information at frequencies above 22 kHz and below 22 Hz. These limits were chosen to ensure that the measured frequency range lies comfortably within the operational frequency limits of the two microphones. The impulse responseh(t)and frequency response of the resulting filter are illustrated in Figure 2.
[image:4.595.65.277.52.152.2]Time (Seconds)
F
re
q
u
e
n
cy
(H
z)
5 10 15 20
0 200 400 600 800 1000 1200 1400 1600 1800
Time (Seconds)
F
re
q
u
e
n
cy
(H
z)
5 10 15 20
0 200 400 600 800 1000 1200 1400 1600 1800
Time (Seconds)
F
re
q
u
e
n
cy
(H
z)
Normalised Magnitude (dB)
5 10 15 20 25
0 200 400 600 800 1000 1200 1400 1600 1800
0 -10 -20
-30 -40
-50 -60
(a) Spectrogram of Engine Recorded Near the Engine, Position A:
(b) Spectrogram of Engine Recorded in the Cockpit, Position B:
[image:5.595.311.545.45.407.2](c) Spectrogram of Simulated Engine Sound in the cockpit, Position B:
Figure 3. Spectrograms of the car engine (a) recorded at positionA, (b) recorded at positionBand (c) auralised at positionBusing the recording at positionAas the source.
−0.1 −0.05 0 0.05 0.1 −1
−0.5 0 0.5 1
−0.1 −0.05 0 0.05 0.1 −1
−0.5 0 0.5 1
−0.1 −0.05 0 0.05 0.1 −1
−0.5 0 0.5 1
Lag Time (s)
N
orm
al
is
ed C
orre
la
ti
on
(a) Simulated Engine Sound using Proposed Method:
(b) Simulated Engine Sound using Reciprocal Method:
(c) Close-mic Recording of Engine Sound: 0.67
0.33
Lag Time (s) Lag Time (s)
-0.35
0.22
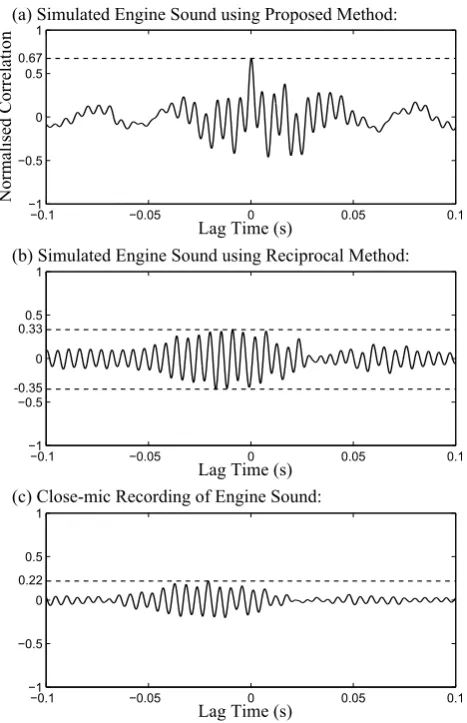
Figure 4. Normalised cross-correlation of the recording of engine at positionBwith (a) the auralised sound at the same point using the proposed method (b) the auralised sound using the reciprocal method and (c) the unprocessed recording of engine at positionA.
Demonstration audio files relating to this work can be accessed online at [18] on the OpenAIR website [19].
Figure 3(a) and (b) are spectrograms of the engine sound recorded at microphone positionsAandBrespectively for one of the 12 measurements, presented over a frequency range of between 0 and 2000 Hz. Figure 3(c) is the spec-trogram of the virtual auralised engine sound at positionB, that has been generated by processing the signal recorded at positionA.
A similarity in the spectral content between the real and the auralised sounds is evident from comparing spectro-grams in Figure 3(b) and (c), and this similarity is further confirmed by listening to the files themselves. However it is evident from the spectrograms in Figure 3 and the frequency response of the filter, illustrated in Figure 2(b), that certain frequency bands are suppressed. In addition the auralised sound appears to be low-pass filtered in com-parison with the actual recorded sound in the cockpit.
[image:5.595.53.289.57.690.2]sound recorded in the cockpit and the auralised sound pre-pared using the filter described in Figure 2 for one of the 12 measurements. For this measurement, the correlation between the two signals is 0.67 at 0 s lag (1 would be exactly the same and 0 would indicate no similarity at all). Calculated for all 12 measurements, the mean peak corre-lation is 0.59 with a standard deviation of 0.09.
To compare the proposed method with an alternative technique, a third auralisation was prepared using the re-ciprocalmethod. For this method, an impulse response de-scribing the sound transformation between positionsAand Bin the car was obtained by placing a loudspeaker at po-sitionB, in the cockpit of the car, and an omni-directional microphone at positionA. A sine sweep measurement tech-nique was then used to obtain the impulse response, as described in [7]. This method is a potential alternative to the one described in this paper, however it is not expected to perform as well mainly because it does not measure the structure-borne contribution to the transfer function. Note that this approach also has the disadvantage that it is not trivial to obtain coincident spatial impulse response measurements, as can be readily measured with the Dual Channel FFT method via a microphone array such as a soundfield microphone.
Figure 4(b) shows the result of the cross-correlation be-tween the real sound recorded in the cockpit and the au-ralised sound prepared using the reciprocal method, using data from one of the 12 recordings. Using this method, the mean peak correlation for all 12 measurements is 0.26, with a standard deviation of 0.06. The relatively low value of correlation is supported by the audible quality of the auralised sound, which reveals a lack of low frequency content in comparison with the actual sound recorded in the cockpit.
Finally, Figure 4(c) shows the cross-correlation between the unprocessed engine sound recorded at positionAand the sound recorded in the cockpit, recorded at positionB, for one set of measurement data. The unprocessed engine sound results in a mean peak correlation of 0.15 for all 12 measurements, with a standard deviation of 0.04. As expected, the unprocessed engine sound shows the least correlation with the sound recorded in the cockpit.
3. CONCLUSIONS
This paper presents a method to auralise the sound of a vehicle’s engine at selected points in the vehicle’s interior, such as the cockpit or passenger compartment. The method is designed to be used in virtual reality applications and computer games. The aim is to provide a realistic and immersive audio experience to users both in terms of how the engine is filtered by both airborne and structure-borne transfer paths before reaching the ear, and in terms of the spatial characteristics and reverberation of the sound within the virtual space. At the same time, the method allows sound designers and developers of such applications full flexibility in designing and manipulating car engine sounds.
The first stage of the method is to measure the transfer functions that describe the relationship between a
close-mic recording of the engine and the sound of the engine at the points of interest in the vehicle’s interior. Once the transfer functions are determined, the derived impulse responses can be used to provide real-time audio from any recorded engine using auralisation techniques. The method is described here for a single channel output, however it can be readily extended for multi-channel systems in order to provide a surround sound experience from an engine recorded at a single point. The simplest way to achieve this would be to replace the single microphone in the cockpit with a microphone array, such as a Soundfield microphone, and calculate the transfer functions for each microphone channel.
Results from the case study show that the method works well, providing an auralised signal that exhibits a relatively high correlation with an actual recorded signal measured at the same point in the cockpit of a car. However, although the auralised signal sounds similar to the real signal, there are some audible differences meaning that there is room for improvement. Observations of the signals in the frequency domain reveal that certain frequency bands appear to be suppressed in the auralised signal, and that the auralised signal is low-pass filtered in comparison to the real signal recorded in the cockipit. Further investigation is required to understand the cause of these errors.
One explanation could be that the method assumes that the relationship between a close-mic recording of an en-gine and the sound of the enen-gine in the vehicle interior can be described by a linear time invariant system, but in fact non-linearity is inevitable in such a system a com-plex vibro-acoustic system. Another cause of difference between auralised and measured audio would be the influ-ence of other sounds and noises in either the cockpit of the car or the engine bay that are not correlated with sounds coming from the engine. Examples of such sounds are creaking in the bodywork of the car, fan noise and noise from the exhaust.
In future work, we would like to investigate if and how the method could be improved by taking into account other sources of sounds that are experienced in a vehicle interior, for example from the exhaust pipe. We would also like to investigate causes of error with the method, and the possibility of improving the results using post-processing techniques. We would like to apply the method to a variety of different vehicles in order to further test its validity and flexibility. Finally we would like to conduct a series of listening tests in order investigate how the difference is perceived between the virtually auralised engine sounds and recorded engine sounds recorded under the same conditions.
Acknowledgments
4. REFERENCES
[1] M. P. Norton and D. G. Karczub, Fundamentals of Noise and Vibration Analysis for Engineers. Cam-bridge University Press, 2003.
[2] S. Jha, “Characteristics and sources of noise and vibra-tion and their control in motor cars,”Journal of Sound and Vibration, vol. 47, no. 4, pp. 543–558, 1976.
[3] J. Plunt, “Finding and fixing vehicle NVH problems with transfer path analysis,”Sound and Vibration Mag-azine, vol. 39, no. 11, pp. 12–16, 2005.
[4] K. Genuit and J. Poggenburg, “The design of vehicle interior noise using binaural transfer path analysis,” in SAE Technical Paper, no. NCV19, 1999.
[5] S. Xiumin, Z. Shuguang, Z. Shiwei, and L. Lin, “Transfer path analysis of fuel cell vehicle interior air-borne noise,” in Vehicle Power and Propulsion Conference, 2008. VPPC ’08. IEEE, 2008, pp. 1–6.
[6] N. Alt, N. Wiehagen, and M. W. Schlitzer, “Interior noise simulation for improved vehicle sound,” inSAE Technical Paper, no. 2001-01-1539, 2001.
[7] A. Farina, “Simultaneous measurement of impulse response and distortion with a swept-sine technique,” in108th AES Convention, 2000, pp. 18–22.
[8] L. Rayleigh, “On the application of the principle of reciprocity to acoustics,” Proceedings of the Royal Society of London, vol. 25, pp. 118–122, 1876.
[9] R. Sottek, P. Sellerbeck, and M. Klemenz, “An artificial head which speaks from its ears: Investigations on reciprocal transfer path analysis in vehicles, using a binaural sound source,” in Proc. 2003 Noise & Vibration Conference and Exhibition, no. 2003-01-1635, Michigan, United States, 2003.
[10] G. Eisele, K. Wolff, and N. Alt, “Application of vehicle interior noise simulation (VINS) for NVH analysis of a passenger car,” inSAE Technical Paper, no. 2005-01-2514, 2005.
[11] M. Smith, “Prediction methodologies for vibration and structure borne noise,” inAlberta Acoustics and Noise Association Spring Noise Conference, Baff, Germany, 2011.
[12] R. Craik, “The measurement of structure-borne sound transmission using impulsive sources,”Applied Acous-tics, vol. 15, no. 5, pp. 355 – 361, 1982.
[13] H. Herlufsen, “Dual channel FFT analysis (part I),” in Br¨uel & Kjær Technical Review, no. 1984-1, 1984.
[14] ——, “Dual channel FFT analysis (part II),” inBr¨uel & Kjær Technical Review, no. 1984-2, 1984.
[15] M. A. Gerzon, “The design of precisely coincident microphone arrays for stereo and surround sound,” in Audio Engineering Society Convention 50, 1975.
[16] M. Williams and G. L. Du, “Multichannel microphone array design,” inAudio Engineering Society Conven-tion 108, 2000.
[17] P. Welch, “The use of fast Fourier transform for the estimation of power spectra: A method based on time averaging over short, modified periodograms,” IEEE Transactions on Audio Electroacoustics, vol. 15, no. 2, pp. 70–73, 1967.
[18] S. Shelley and D. T. Murphy. (2013) Audio demonstration of the auralisation of a car engine. [Online]. Available: www.openairlib.net/resources/ vehicle-engine-auralisation