doi:10.4236/jbpc.2011.23040
Copyright © 2011 SciRes. Openly accessible at http://www.scirp.org/journal/JBPC/
Modulation of CNS excitability by water movement.
The D
2
O effects on the non-linear neuron-glial
dynamics
Vera Maura Fernandes de Lima1,2, Wolfgang Hanke3*
1
Centro de Biotecnologia, Instituto de Pesquisas Energéticas e Nucleares CNEN/IPEN-SP, Sao Paulo, Brazil;
2
Universidade de São João, Del Rei-Campus de Divinópolis, Sao Joao del Rei, Brazil;
3
Institut of Physiology, Department Membrane-Physiology, University of Hohenheim, Stuttgart, Germany;
*
Corresponding Author: [email protected]
Received 15 May 2011; revised 30 June 2011; accepted 6 July 2011.
ABSTRACT
Macroscopic spatiotemporal patterns arising in grey matter may explain the clinical manifesta-tions of several functional neurological syn-dromes (migraine aura, epilepsies). Detailed descriptions of these patterns in central grey matter and their physicochemical or pharma-cological manipulations can be useful in many scientific fields ranging from drug design to functional brain imaging. These evanescent dy- namic structures are electrochemical in nature and show macroscopic tissue polarization due to coupled and macroscopic flow of ions and water across, along and between neuronal and glial membranes. So far the importance of the water flow in the CNS functional syndromes has been examined by manipulations of water chan- nels aquaporines (AQP). In this paper we show the result of substituting H2O for D2O in retinal spreading depression experiments. This inverts the present logic by changing the flow in the water channels in intact tissue and observing the evolution of electrochemical patterns and recording the optical profiles of excitation waves in isolated chick retinas. D2O flow through AQPs is ~20% slower than that of H2O. The slower flux disturbs the tight coupling between ion and water flows across membranes and slowdown the Na-KATPase rate of change with metabolic consequences for the tissue. The whole tissue excitability shifts in a non-stationary manner toward a non-excitable state.
Keywords: Retinal Spreading Depression; D2O; Neuron-Glial-Dynamics
1. INTRODUCTION
Functional syndromes such as migraine aura, epilep-sies, transient global amnesia may be the clinical expres-sion of dynamic structures that emerge in the central nervous system (CNS) due to its intrinsic properties. This assumption is in agreement with the conceptual framework of the brain as an excitable media. The brain has all the properties of excitable media: it is thermody-namically open and maintained far away from equilib-rium. Its processes are full of positive and negative feedback mechanisms, its micro-processes are coopera-tive and its emergent properties can be modulated by weak external forces. Therefore, emergent low dimen-sional temporal and spatial patterns in the form of oscil-lations and excitation waves are to be expected in the brain. The vertebrate retina is in the words of Dowling “An Approachable Part of the Brain” [1]. The inner ret-ina is central gray matter derived from the embryonic diencephalon. Thus, the above arguments do apply to the retina, too. In 1958 Gouras discovered that self-organ-ized wave propagation could be visualself-organ-ized macroscopi-cally in in vitro retinas. Over the next decades knowl-edge about self-organization in neuronal tissue has been collected using the retinas as experimental model [2-9] and non-linear thermodynamics as the theoretical con-text to interpret the data [5-12]. We decided to observe the changes in tissue dynamics caused by changes in wa-ter movements using the intrinsic optical signals (IOS) of excited states in in vitro retinas—particularly the optical profiles of retinal spreading depression waves (RSDs)— and their response to substitution of H2O by D2O as
sol-vent in the maintenance solution of the experimental preparation, in order to make inferences about short-term macroscopic water flow and tissue excitability.
ments in the physiopathology of functional syndromes, particularly the role of the AQP4 isoform expressed in astrocytes and Müller cells [13-16]. These experiments have either used knockout mice for the APQ channels or observed changes in the expression of these channels at the tissue level with histochemical techniques, and their relation to clinical expression of functional syndromes. We made the conjecture that D2O macroscopic flow
would alter optical profiles of excitation waves in retinas based on 1) the fact that D2O flow through AQP chan-
nels is slower than H2O [17] (~20% slower); 2) D2O is
long known in biology to slow down oscillations [18,19]. In nervous tissue its effects were attributed to the slow- ing done of the sodium pump [20]; 3) our own previous results with glycerol and temperature manipulations [9,21] of in vitro retinas; 4) the tight coupling in CNS between active salt transport and glycolisys [22,23] and the matching between first and second optical compo- nents of RSDs IOS and electrochemical gradients dissi- pation and increased glycolysis induced by ATP expen- diture in the tissue respectively [6,24].
As an additional proof of concept, the retina experi- ments results were compared to a parallel series of ex- periments performed with the Belouzov-Zabothinsky reaction system [25]. The qualitative changes observed in both systems were equivalent, suggesting the pre- dominance of solvent effects of D2O on the dynamics of
both excitable media.
2. MATERIALS AND METHODS
2.1. Preparation of the Eye-Cup
For the experiments chicken in the age from 5 to 21 days were used. After decapitation the eyes are removed out of the eye socket. Eyes are sectioned close to the equator and vitreous body is removed with a tweezers. The posterior eyecups are immersed in Ringer solution. The eyecups are then glued each in a Petri dish and put in the set up where they are perfused with Ringer solu-tion. Before the measurements started the retinas are allowed to recover for 30 min.
2.2. Ringer Solution
The solution used to perfuse the isolated retinas has the following composition: 100 mM NaCl; 6 mM KCl; 1 mM MgSO4; 1 mM CaCl2 2H2O; 30 mM NaHCO3; 30
mM glucose AND 10 mM TRIS with the pH adjusted to 7.4.
2.3. Materials
All chemicals used were obtained at least at p.a. grade at Sigma, Aldrich or Merck. Water was from a
labora-tory distillery and D2O was acquired from Sigma.
2.4. Set-up
The setup is enclosed in a Faraday cage in which a camera and a photomultiplier are aimed at the central retina region through a microscope. Electrical recordings were performed with extracellular glass microelectrodes (tip diameter around 10 m, filled with potassium solu-tion) inserted in the retina using a micromanipulator under optical control. The positioning was aimed to the inner plexiform layer. The electrical potential of the tis-sue relative to the bathing solution was measured then with a high impedance amplifier connected to an Ag/ AgCl-electrode in the glass micropippete versus another Ag/AgCl coil wire electrode immersed in the bath (ref-erence electrode). The electrode amplifier output was digitized at 10 Hz and stored in a computer. The retina was maintained under perfusion at 1 ml/min rate and at 30˚C temperature. The digitized camera output had the electrode output superimposed before storage in a DVD recorder.
2.5. Recordings
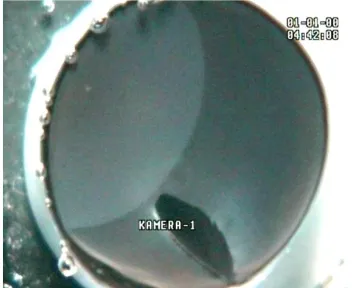
Figures 1 and 2 show the preparation and the re-cording procedure. In Figure 1 the panoramic view of a circular solitary wave of retinal spreading depression (RSD) is shown. The wavefront is seen approaching the tip of the pecten in central retina. The pecten is the black structure supposed to supply O2 and nourishment to the
avascular retina. This circular wavefront will invade the whole retina homogeneously.
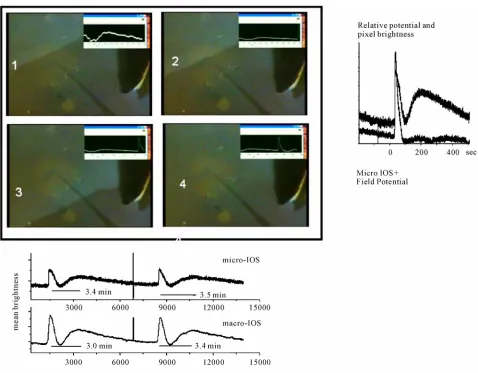
Figure 2 shows the central retina region with a glass electrode inserted. Superimposed on the digitized cam-era output, a time series shows the temporal evolution of the field potential around the electrode tip. Upper row of photos: a RSD wave approaches the electrode and field potential begins to change; next the field potential reaches its peak value. Lower row: the field potential recovers to the baseline value; next the frame shows the moment when the second component of the optical pro-file of the RSD reaches peak. Note that this component has no clear field potential correspondence. The graphs on the side and below the photos detail the optical pro-file of circular RSDs recorded at 30˚C. On the side, the field potential and the optical changes in a matrix of 10 × 10 pixels (~50 µm × 50 µm) at the tissue over the tip of the electrode are given. The mean brightness of the pixel matrix is calculated and stored as time series.
Copyright © 2011 SciRes. Openly accessible at http://www.scirp.org/journal/JBPC/ Figure 1. The photo shows the experimental
preparation with a solitary and circular RSD wave spreading from the peripheral retina toward the centre. The bottom of the petry dish and the posterior half of the eyecup is seen from above by a camera. The sclera was glued to the bottom of the Petri dish and the dish filled with standard retinal Ringer solution. The panoramic view of the RSD wave shows the changes of the optical properties of the tissue (increase in light scatter) that makes the IOS. At the wavefront the tissue is in the excited state, the transparent tissue in front of it is in quiescence and behind the wave the tissue it is refractory to stimulation. Note the black structure that reaches the central retina. It is the pecten, covered by pigmented epithelium and very rich in blood vessels. It is a natural barrier that splits RSD waves. Note at the bottom of the eyecup a piece of pigment epithelium and the out of focus patch of retina that separated from it. The mean spread velocity of such waves re- corded at 30˚C is 3 mm/min and they invade the whole retina in about 3 minutes. The quiescent retina is turned excited by a light mechanical touch that leaves a spot of damaged tissue at the peripheral retina.
shows the mean brightness of a 10 × 10 matrix and the lower row the digitized output from the photomultiplier that samples a circular area with about 1mm diameter. Note the dissimilar rising phase of the first optical com-ponent and the similarity of the rising and shape of the second optical component at different space scales.
2.6. Protocol
After successful insertion of the microelectrode in the innerplexiform layer, one control RSD was elicited me-chanically and at the end of the optical profile record the normal solution was changed to the deuterium solution. The pumping rate was increased tenfold until the total volume of the perfused solution was three times the Petry dish volume. Then the pumping rate returned to the slow 1 ml/min rate. After one or two hours the solu-tion was changed back to water solusolu-tion.
3. RESULTS AND DISCUSSION
3.1. Global System Behavior
The motivation for these experiments was the discus-sion in the literature about excitability in closed human cortex versus in vitro retina or open rodent cortices [26]: it was conceivable that rare spatiotemporal patterns in one experimental condition would be the most probable in another, hence the challenge of turning an in vitro retina model closer to the in situ cortex. We knew that in
in-situ retinas the wave propagation pattern was more similar to closed circles compared to the calculated wave segments from patients with migraine [26,27]. We pre-dicted that deuterium effects would shift the global ex-citability of the system towards a less excitable situation by disturbing the tight coupling between ionic and water flow in and out of cells. According to Pittendrigh et al.
[18], the physicochemical properties of D2O-(increase in
viscosity) lower self-diffusion due to increased mass and different dissociation constant, would change ion mobil-ity and stabilize the hydrophobic interaction in biopoly-mers, thus interfering in the tertiary and quaternary structure of protein complexes (and the electrochemical properties of the polyelectrolyte glycosaminoglycans— GAGs—of the extracellular matrix and basement mem-branes). Thus the solvent effects of deuterium would affect the system globally, disturbing macroscopic or-ganized flows of ions and water and in consequence changing metabolism [22-24]. The D2O effect on the
Na+/K+-ATPase [18] predicted a long lasting recovery of the first peak and a longer interval between the first and second optical peaks of the IOS profile. The Q10 of the
IOS duration is 5—similar to the sodium pump Q10—
and the pumping rate by this protein complex is slowed down by D2O in axons [18]. The foremost effect of the
Figure 2. The 4 frames show the computer combined output of a camera and the amplified output of a microelectrode inserted in the inner plexiform layer showing the central retinal tissue. The glass electrode is harder to see than its dark shadow. The horizontal total length in each frame is 2.7 mm. First row 1: The frame shows the moment when the electrode senses the field of the approaching wave; 2, the moment when the extracellular field around the electrode tip reaches the peak of 20 m; lower row 3: the frame shows the moment when the baseline extracellular potential is back at pre-wave values; and finally, 4, when the second component of the opti- cal profile is at the peak. The complete optical profile of control RSD wave and the concomitant extracellular potential drop is shown on the side of the frames. The two time series were recorded simultaneously with a sampling rate of 10 Hz. The upper curve shows the mean brightness of a small matrix of pixels (10 × 10 pixels or 50 µm sidelength) overlying the electrode tip and the lower curve the field potential. The two graphs were superimposed and show that the field potential leads slightly the optical signal (microscopic IOS) but the two peaks coincide. The second optical component has no obvious field concomitant, in contrast with the first optical component; it rises gradually and is smaller in amplitude than the firs component. This is the most probable profile pattern for control waves. Below the 4 frames we show the temporal evolution of an experiment in which 2 successive waves were elicited mechani-cally. Note the optical artefact in both graphs before the second wave. The two time series, simultaneously recorded, show the ampli-fied photomultiplier output and the mean brightness of a small pixel matrix (10 × 10 pixels or 50 µm sidelength). The photomultiplier counts the photons in a circular area of about 1mm diameter in the central retina in which the small matrix represents a very small portion. Note the abrupt rise of the first optical peak in the microscopic scale and the smooth rise in the macroscopic IOS first peak. By contrast, the second optical component has the same shape in both space scales.
3.2. Optical Profiles under D2O Influence
spontaneous standing patterns are rare events in our standard experimental situation, although standing pat-terns around lesions are frequent, and called “penumbra zones”. The same statement is true for the B-Z system: we only saw standing patterns with deuterium as solvent in the system [27].
The deuterium solution was applied to seven retinas and in five the pattern observed is the one shown in Fig-ure 3.
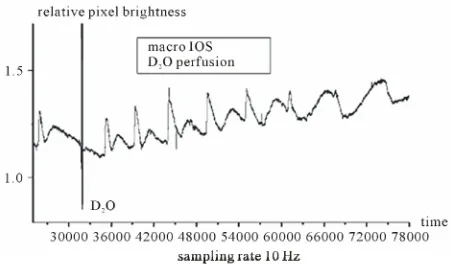
Copyright © 2011 SciRes. Openly accessible at http://www.scirp.org/journal/JBPC/ Figure 3. Long time series showing the photomultiplier output
(10 Hz sampling rate) during the recording of a deuterium solution experiment. A control wave optical profile is shown before the artefact due to the turbulence of the fast rate deute-rium solution substitution of the water solution. Then, a series of “spontaneous waves” invade the central retina Note the marked non-stationarity in the shape of these waves. The third wave profile is the result of a collision of two waves at the central region. Note the dampening of the first component and the widening of the interpeak interval in the successive waves profiles (the interpeak interval is a good measure of absolute refractoriness within the titisue). The widening of the interpeak interval is concomitant with diminishing of the first optical peak (that signals electrochemical gradients dissipation) turn-ing the profile to a “dark” profile at the seventh wave. The sampling rate was 10 Hz (600 points = 1 minute).
The long time series shown in Figure 3 displays the RSDs IOS recorded in one experiment. The record be-gins at 40 minutes of the recording window with the optical profile of a control RSD and ends 90 minutes later after a series of RSDs invaded the central region sampled by the photomultiplier. At the end of the control wave profile optical artefacts show the record of the turbulence in the system due to the fast pumping rate of the D2O solution. Within seconds of the contact between
the D2O solution and the basement membrane of the
retinal vitreal interface, RSDs were induced. Initially circular, waves from the border could collide in the cen-tral region (third wave in the series is a collision of two fronts) then the wavefronts became irregular. Besides the irregular wavefronts, the profiles showed gradual in-crease of the delay between the first and second optical components, together with gradual disappearance of the first peak in the IOS. Discussions of the details of indi-vidual profiles are beyond the scope of this paper and will be discussed in another context about propagating waves and excitoxic responses in retinas.
The interpeak interval in the optical profiles showed gradual increase; usually it was doubled after 40 minutes of retinal exposition to deuterium solution Glycerol and a lowering step in temperature also increase the inter-peak interval [9,21]. While the temperature effect is mainly attributable to the sodium pump (Q10 = 5) and
does not disturb coupling in the system, the glycerol effect more probably is caused by the AQPs channels activity. The AQPs linked to functional syndromes are AQP4 and AQP9, both expressed in glia [14-16] and in the Müller cells their expression appears to follow the surface to volume ratio of membranes, being heavy at the vitreous retina border and in the innerplexiform layer [15,16]. The AQP9 channel is permeant to water, glyc-erol and lactic acid. The later is very closely associated with the kinetics of the second peak of the RSD IOS and with neuronal-glial interactions [4,24]. The deuterium and glycerol solutions are likely to disturb the coupled flows of ions and water and lactic acid. For this reason, whereas low temperature increases the amplitude of the second optical peak of the IOS, deuterium and glycerol tend to depress the amplitude. At the limit of the system toward non-excitability, the second component can be absent.
24000 30000 36000 42000 48000 54000
18000 24000 30000 36000 42000 48000
[image:6.595.61.540.80.296.2]18000 24000 30000 36000 42000 48000
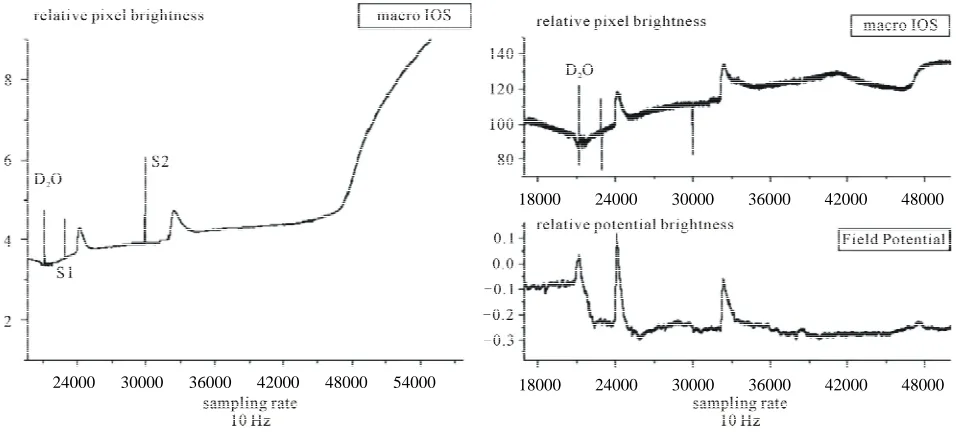
Figure 4. Three simultaneously recorded time series of a deuterium experiment in which the whole retina died within 2 hours of deuterium solution perfusion. The graph on the left of the figure shows the photomultiplier output. On the right the upper graph shows the microscopic IOS—i.e. the mean brightness of 10 × 10 pixel matrix—and the lower graph the field potential—microelec- trode and amplifiers output. The record begins at 30 minutes recording time, after one control wave and follows the optical and elec-trical changes in the tissue for the next 90 minutes (right graph). Note that at the time of the ramp rise in the macroscopic optical signal, a step rise can be seen at the microscopic space scale, demonstrating that the photomultiplier output represents the integral sum of the microscopic IOS. The field potential time series first linear shift follows the interaction of the deuterium solution with the silver/silver chloride reference electrode and it is of the same order of magnitude as is the RSD extracellular potential drop and with no measurable latency in our recording system, showing the power of electrochemical interfacial interactions of the deuterium/water solvent substitution. Note the halving of the amplitude of the field potential and the slowing down of the recovery of both field po-tential and microscopic IOS suggesting that structural tissue changes follow the charge movement within the tissue.
[6,24,28]. The fast linear rise in the photomultiplier time series marks the onset of the excitotoxic tissue response that culminated in tissue death. This linear growth looks the same irrespective of the origin of the excitotoxicity (v.g. glutamate or ouabain, data not shown). Note that at amicroscopic scale a step is observed and the photomul-tiplier output, then the macroscopic signal represents the integration of thousands of such steps arising in short sequence within central retina. At the beginning of the field potential time series, a linear fast shift of the base-line is observed. This shift follows a potential drop at the silver/silver-chloride coil reference electrode. Our re-cording arrangement makes the maintenance fluid to enter the chamber at the bottom and be sucked out at upper border of the Petry dish. Thus long before the so-lution touch retina surface, the reference electrode con-tacts it. This electrochemical shift at the electrode sol-vent interface has the amplitude of ~15 mV and shows the potential of the electrochemical effects of the deute-rium solution at charged interfaces.
4. CONCLUSIONS
The conceptual framework of excitable applied to the non-linear neuronal-glial dynamics permits the
Katchal-Copyright © 2011 SciRes. Openly accessible at http://www.scirp.org/journal/JBPC/
sky [10-12] and the tight coupling between active ion transport and glycolysis can be affected by the AQPs activity disturbance as demonstrated by the glycerol and deuterium effects on the IOS of in vitro retinas. This organized macroscopic flow happens across, along and between glial and neuronal membranes and can be ex-pressed as standing patterns, waves or oscillations.
REFERENCES
[1] Dowling, J. (1987) The retina, an approachable part of the brain. Harvard University Press, Cambridge.
[2] Gouras, P. (1958) Spreading depression of activity in amphibian retina. American Journal of Physiology, 195, 28-32.
[3] Martins-Ferreira, H. and De Castro, G.O. (1966) Light scattering changes accompanying spreading depression in isolated chicken retina. Journal of Neurophysiology, 29, 715-726.
[4] De Castro, G.O., Martins-Ferreira, H. and Gardino, P.F. (1985) Dual nature of the peaks of light scattered during spreading depression in chick retina. Anais da Academia Brasileira de Ciências, 57, 95-103.
[5] Do Carmo, R. and Martins-Ferreira, H. (1984) Spreading depression of Leão probed with ion-sensitive electrodes. Anais da Academia Brasileira de Ciências, 56, 401-421. [6] Fernandes de Lima, V.M. and Hanke, W. (1997)
Excita-tion waves in central gray matter: The retinal spreading depression. Progress in Retinal and Eye Research, 6, 657-690.
[7] Peixoto, N.L.V., Fernandes de Lima, V.M. and Hanke, W. (2001) Correlation of the electrical and intrinsic optical signals in the chicken spreading depression phenomenon. Neuroscience Letters, 299, 89-92.
[8] Wiedemann, M., De Lima, V.M.F. and Hanke, W. (2001) Gravity dependence of waves in the retinal spreading de-pression and in gel type Belouov-Zabothinsky systems. Physical Chemistry Chemical Physics, 4, 1370-1373. doi:10.1039/b109166m
[9] Weimer, M.S. and Hanke, W. (2005) Correlation between the durations of refractory period and intrinsic optical signal of spreading depression during temperature varia-tions. Experimental Brain Research, 161, 201-208. doi:10.1007/s00221-004-2060-5
[10] Katchalsky, A. (1971) Carriers and specificity in mem-branes. VI Biological flow structure and their relation to chemodiffusion coupling. Neurosciences Research Pro-gram Bulletin, 9, 397-413.
[11] Katchalsky, A. (1975) Concept of dynamic patterns. Neu-rosciences Research Program Bulletin, 12, 11-26, 30-52. [12] Katchalsky, A. (1971) Polyelectrolytes and their
biologi-cal interactions. Biophysical Journal, 4, 9-41.
[13] Tait, M.J., Saadoun, S., Bell, A. and Papadopulos, M.C. (2007) Water movement in the brain: Role of aquaporins. TRENDS in Neurosciences, 31, 27-43.
[14] Binder, D. and Steinhauser, C. (2006) Functional changes in astroglial cells in epilepsy. Glia, 54, 358-368. doi:10.1002/glia.20394
[15] Panicke, T., Iandiev, I., Uckermann, O., Biedermann, B., Kutzera, F., Wiedemann, P., Wolburg, H., Reichenbach, A. and Bringmann, A. (2004) A potassium channel linked
mechanism of glial cell swelling in the postischemic retina. Molecular and Cellular Neuroscience, 26, 493-502. doi:10.1016/j.mcn.2004.04.005
[16] Goodyear, M.J., Crewther, S.G., Murphy, M., Giumarra, L., Hazi, A., Junghans, B.M. and Crewthers, D. (2010) Spatial and temporal dissociation of AQP4 and Kir4.1 expression during induction of refractive errors. Molecu-lar Vision, 16, 1610-1619.
[17] Mamonov, A.B., Coalson, R.D., Zeidel, M.L. and Mathai, J.C. (2007) Water and deuterium oxide permeability through aquaporin-1: MD predictions and experimental verification. The Journal of General Physiology, 130, 111-116. doi:10.1085/jgp.200709810
[18] Pittendrigh, C.S., Caldarola, P.C. and Cosbey, E.S. (1973) A differential effect of heavy water on temperature de-pendent and temperature compensated aspects of the cir-cadian system of the drosophila pseudoobscura. Pro-ceedings of the National Academy of Sciences of the United States of America, 70, 2037-2041.
doi:10.1073/pnas.70.7.2037
[19] MacDaniel, M., Sulzman, F.M. and Hastings, J.W. (1974) Heavy water slows the Goniaulax clock: A test of the hi-pothesys that D2O affects circadian oscillations by
di-minishing the apparent temperature. Proceedings of the National Academy Sciences of the United States of America, 71, 4389-4391. doi:10.1073/pnas.71.11.4389 [20] Landowner, D. (1987) D2O and the sodium pump in
squid nerve membrane. Journal of Membrane Biology, 96, 277-281. doi:10.1007/BF01869309
[21] Fernandes de Lima, V.M., Weimer, M. and Hanke, W. (2002) Spectral dependence of the intrinsic optical signal of excited states of central gray matter and conforma-tional changes at membrane interfaces. Physical Chemis-try Chemical Physics, 4, 1374-1379.
doi:10.1039/b109914k
[22] Whittam, R. (1962) The dependence of respiration of brain cortex on active ion transport. Biochemical Journal, 82, 205-212.
[23] Whittam, R. and Blond, D.M. (1964) Respiratory control by an adenosine triphosphatase involved in active trans-port in brain cortex. Biochemical Journal, 92, 147-158. [24] Dahlem, Y.A. and Hanke, W. (2005) Intrinsic optical
signal of spreading depression: Second phase depends on energy metabolism and nitric oxide. Brain Research, 1049, 15-24. doi:10.1016/j.brainres.2005.04.059
[25] Klink, O., Hanke, W., Gebershagen, E. and Fernandes de Lima, V.M. (2010) Influence of heavy water on waves and oscillations in the Belouzov-Zabotinsky reaction. In: Petrin, A., Ed., Wave Propagation in Materials for Mod-ern Applications, InTech Books, Morn Hill, 21.
[26] Dahlem, M. and Hadjikahani, N. (2009) Migraine aura: Retracting particle-like waves in weakly susceptible cor-tex. PLoS ONE, 4, e5007.
doi:10.1371/journal.pone.0005007
[27] Streit, D.S. (1990) Depressão alastrante retiniana in vivo. MSc Thesis presented to the Ophtalmology Department UFRJ, Rio de Janeiro, Brazil.
waves of activity in the neocortex: What they are, what they do. Neuroscientist, 14, 487-502.
[30] Hermann, G.E., Van Meter, M.J., Roo, J.C. and Rogers, R.C. (2009) Proteinase activated receptors in the nucleus of the solitary tract: Evidence for glial-neural interactions in autonomic control of the stomach. The Journal of neuroscience, 29, 9292-9300.
[31] Lee, C.J., Mannaioni, G., Yuan, H., Woo, D.H., Gingrich,
M.B. and Traynelis, S.F. (2007) Astrocytic control of synaptic NMDA receptors. The Journal of Physiology, 581, 1057-1081. doi:10.1113/jphysiol.2007.130377 [32] Fernandes de Lima, V.M. and Hanke, W. (1996) Observa-