This is a repository copy of
Methods for the estimation of the NICE cost effectiveness
threshold
.
White Rose Research Online URL for this paper:
http://eprints.whiterose.ac.uk/136514/
Version: Published Version
Monograph:
Claxton, Karl Philip orcid.org/0000-0003-2002-4694, Martin, Stephen, Soares, Marta O
orcid.org/0000-0003-1579-8513 et al. (6 more authors) (2013) Methods for the estimation
of the NICE cost effectiveness threshold. Working Paper. CHE Research Paper . Centre
for Health Economics, University of York , York, UK.
[email protected] https://eprints.whiterose.ac.uk/ Reuse
Items deposited in White Rose Research Online are protected by copyright, with all rights reserved unless indicated otherwise. They may be downloaded and/or printed for private study, or other acts as permitted by national copyright laws. The publisher or other rights holders may allow further reproduction and re-use of the full text version. This is indicated by the licence information on the White Rose Research Online record for the item.
Takedown
If you consider content in White Rose Research Online to be in breach of UK law, please notify us by
Methods for the Estimation of the
NICE Cost Effectiveness Threshold
Methods for the Estimation of the NICE Cost
Effectiveness Threshold
Final Report
Karl Claxton,
1,2Steve Martin,
2Marta Soares,
1Nigel Rice,
1Eldon Spackman,
1Sebastian Hinde,
1Nancy Devlin,
3Peter C Smith,
4Mark Sculpher
11. Centre for Health Economics, University of York, UK
2. Department of Economics and Related Studies, University of York, UK
3. Office of Health Economics, London, UK
4. Imperial College, London, UK
Karl Claxton, Nigel Rice, Mark Sculpher, Nancy Devlin, Marta Soares and Eldon Spackman have undertaken consultancy/research for pharmaceutical manufacturers and/or other commercial life sciences companies that may have an interest in this research. Peter C Smith is a member of the NHS Cooperation and Competition Panel, and the Policy Board of the Office of Health Economics. Nancy Devlin is employed by the Office of Health Economics, which receives funding from the Association of the British Pharmaceutical Industry.
Corresponding author:
Professor Karl Claxton
Centre for Health Economics, Alcuin ‘A’ Block,
University of York, North Yorkshire, YO31 8RD, United Kingdom.
November 2013
Acknowledgments
The authors would like to acknowledge funding received from the Medical Research Council/National Institute for Health Research through its Methodology Research Programme (Award G0901498/1).
We acknowledge the contribution of the following individuals who participated in various aspects of this research: Ling-Hsiang Chuang, Craig Currie, Jamie Garside, Simon Gilbody, Charlotte Haylock, Sarah Jenkins-Jones, Tim Kendall David Parkin and John Parkinson.
We are also grateful to those colleagues who attended our research workshop in May 2010 and offered comments on our preliminary methods. We would especially like to thank Peter Littlejohns for his support in advocating this topic to the Methodology Research Programme.
This is an internal report which will be formally reported inHealth Technology Assessmentas a peer-reviewed journal.
All views expressed here, and any errors, are entirely the responsibility of the authors.
Contributions of authors
All of the named authors below contributed to the development of the research questions, study design and implementation (including membership of study management group), analysis and/
or interpretation of data and submission of the final report. Contributions to particular elements of the study are described below.
Karl Claxton(Professor of Economics, University of York) was a co-applicant, and led the overall design
and of the study and interpretation of results, and the writing of the report.
Steve Martin(Researcher, University of York) was co-applicant and undertook and wrote-up the
econometric analyses detailed in Chapter 3 and Appendix B.
Marta Soares(Research Fellow, University of York) undertook the analyses extending the econometric
analysis on mortality changes to broader health effects on QALYs (Chapter 4 and Appendix C.
Nigel Rice(Professor of Health Economics, University of York) was co-applicant and contributed to
the design, interpretation and write-up of the econometric analysis.
Eldon Spackman(Research Fellow, University of York) designed and undertook the systematic review
(Appendix A), and contributed to analyses linking mortality changes to broader health effects on QALYs.
Sebastian Hinde(Research Fellow, University of York) designed, undertook and wrote-up the
systematic review (Appendix A), and contributed to analyses linking mortality changes to broader health effects on QALYs.
Nancy Devlin(Director of Research, Office of Health Economics) was a co-applicant and led the design
and write up of the review of local data availability.
Peter C Smith(Professor of Health Policy) was a co-applicant, and contributed to the design,
interpretation of all aspects of the analysis.
Mark Sculpher(Professor of Health Economics) was principal applicant, chaired the study management
Contents
Page
List of Abbreviations
vi
Scientific Summary
vii
Chapter 1: Introduction
1
1.1 Policy context
1
1.2 Estimating the cost-effectiveness threshold
1
1.3 Aims and objectives
1
1.4 Report structure
2
Chapter 2: Policy Context and Conceptual Framework
3
2.1 Introduction
3
2.2 What should the NICE threshold represent?
3
2.2.1
The threshold as a measure of opportunity cost
3
2.2.2
The threshold as the consumption value of health
5
2.3 Estimating the threshold
5
2.3.1
NICE’s threshold range
5
2.3.2
The basis for empirical work
6
2.3.3
Studying displacement locally
7
2.3.4
What evidence is needed?
7
2.4 An introduction to study methods
8
2.4.1
Past work
8
2.4.2
Further econometric analysis
9
2.4.3
Moving from life-years to quality-adjusted life-years gained
10
2.5 Conclusions
10
Chapter 3: The link between NHS spending, mortality and the
12
cost of a life year
3.1 Introduction
12
3.2 Previous studies
13
3.3 Modelling framework
14
3.4 Data
16
3.4.1
Programme budgeting in England
16
3.4.2
Health outcome data
19
3.4.3
Other variables
22
3.5 Approach to model estimation
23
3.5.1
IV estimation
24
3.6.1
2006/7 expenditure data and mortality data for 2006/2008
26
3.6.1.1 Cost of a life year
29
3.6.1.2 Non-PCT Department of Health funded expenditure
30
3.6.2
2007/8 expenditure data and mortality data for 2007/2009
30
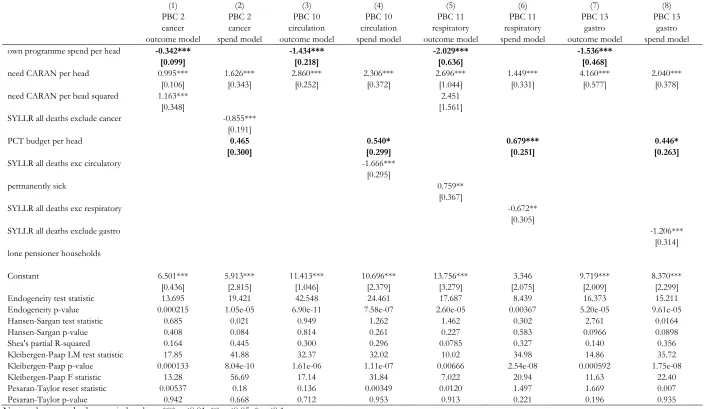
3.6.2.1 Outcome models
30
3.6.2.2 Expenditure models
32
3.6.2.3 Calculation of the cost of a life and life year
32
3.6.3
2008/9 expenditure data and mortality for 2008/2010
35
3.6.3.1 Outcome models
35
3.6.3.2 Expenditure models
36
3.6.3.3 Calculation of the cost of a life and life year
37
3.6.4
Comparing the cost of life year estimates associated with
37
different data sets
3.6.5
Adjusting the cost of a life year estimates to constant prices
38
3.7 Summary and concluding remarks
41
Chapter 4: Translating mortality effects into life years and quality
44
adjusted life years
4.1 Introduction
44
4.2 From mortality to life years
45
4.2.1
Mortality and YLL coverage
45
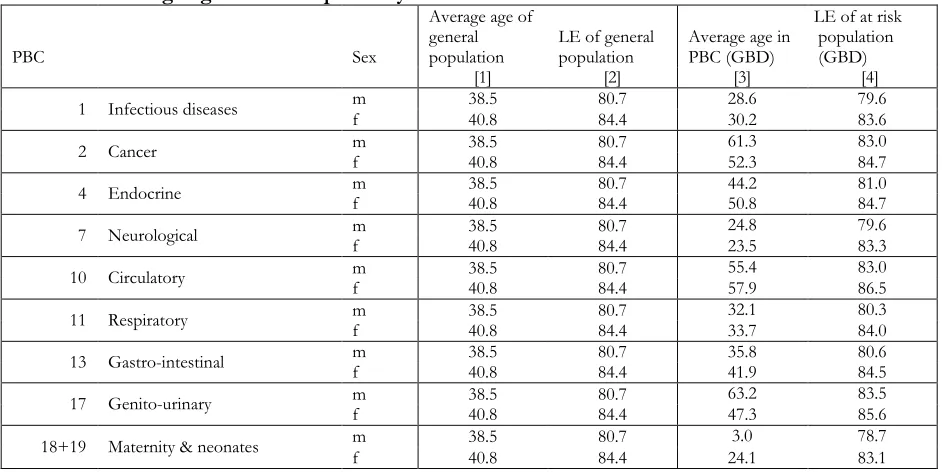
4.2.2
Life expectancy and YLL
46
4.2.3
YLL and accounting for counterfactual deaths
47
4.2.4
Inferring excess deaths
52
4.2.5
Summary of cost per life year estimates
55
4.3 Adjusting life years for quality of life
55
4.3.1
Quality of life based on the general population
56
4.3.2
Adjusting age related quality of life for disease decrements
57
4.3.3
Summary of the cost per QALY threshold based only on
59
mortality effects
4.4 Including quality of life effects during disease
60
4.4.1
Using ratios of QALYs to YLL
61
4.4.2
Using estimates of the QALY burden of disease
66
4.4.3
Summary of the cost per QALY threshold
70
Chapter 5: Implications for a policy threshold
73
5.1 Introduction
73
5.2 Re-estimating the cost per QALY threshold using more recent data
73
5.3 Which PBCs matter most?
75
5.4 How uncertain are the estimates and what are the implications?
79
5.6 How does the threshold change with overall expenditure?
88
5.7 What type of health is forgone by approval of a new technology
90
5.8 Future research and improving estimates of the threshold
93
5.9 Conclusions and implications for practice
100
References
102
Appendix A: Systematic review of the literature on the
cost-effectiveness threshold
Appendix B: The link between NHS spending and mortality:
estimating the cost of a life year in England
Appendix C: Translating mortality effects into life years and
quality adjusted life years
Addendum C1: Data sources
Addendum C2: The role of data on local NHS decisions
Addendum C3: Characterisation of the investment and disinvestment
decisions in mental health: depression and schizophrenia
Addendum C4: What type of health is forgone by the approval of a new
technology?
List of Abbreviations
2SLS Two-stage least squares
CARAN Combining Age Related and Additional Needs CCG Clinical Commissioning Groups
CEA Cost-Effectiveness Analysis CPRD Clinical Practice Research Datalink DALYs Disability-Adjusted Life Years EQ5D EuroQoL five dimensions
GAD7 Generalised Anxiety Disorder Assessment seven GBD Global Burden and Disease
GLS General Least Squared GMS General Medical Services HA Housing Association
HCHS Hospital and Community Health Services HES Hospital Episode Statistics
HIV Human Immunodeficiency Virus HODaR Health Outcomes Data Repository HSE Health Survey for England
IAPT Improving Access to Psychological Therapies ICD International Classification of Disease ICER Incremental Cost-Effectiveness Ratio IMD2007 Index of Multiple Deprivation 2007 dataset IV Instrumental Variable
LA Local Association LE Life Expectancy
LLT Limited Long Term (illness) LM Lagrange Multiplier
MEPS Medical Expenditure Panel Survey MFFs Market Forces Factors
MHRA Medicines and Healthcare products Regulatory Agency MRC Medical Research Council
NHS National Health Service
NHS IC National Health Service Information Centre NICE National Institute for Health and Care Excellence NIHR National Institute for Health Research
NSFs National Service Frameworks OLS Ordinary Least Squared PAS Patient Access Scheme PBC Programme Budget Categories PCO Primary Care Organisations PCT Primary Care Trusts
PHQ9 Patient Health Questionnaire-9 PMS Primary Medical Services
PROMs Patient Reported Outcome Measures QALY Quality-Adjusted Life Years
QoL Quality of Life
SMR Standardised Mortality Rate
SYLLR Standardised Years of Life Lost Rate WHO World Health Organisations
YLD Years of life lived with disability YLG Years of Life Gained
Scientific Summary
1 Introduction
1.1
NICE's comparison of the incremental cost effectiveness ratio (ICER) of a new technology, which is more costly than existing alternatives, with the cost-effectiveness threshold is important in assessing whether the health expected to be gained from its use exceeds the health expected to be forgone elsewhere as other NHS activities are displaced (i.e. whether the new technology is cost effective).1.2
When NICE issues positive guidance for a new intervention which imposes additional costs on the NHS, the resources required to deliver it must be found by disinvesting from other interventions and services elsewhere. This displacement will inevitably result in health decrements for other types of individual. Thus the threshold represents the additional cost that has to be imposed on the system to forgo 1 QALY of health through displacement.1.3
Currently NICE uses a threshold range of £20,000 to £30,000 QALY gained, and this has remained the case in NICE's methods guidance since 2004. There have been a number of calls for further research on the value of the threshold.1.4
This report details a 2-year project, funded by the NIHR and MRC Methodology Research Programme, to develop methods to estimate the NICE cost effectiveness threshold.1.5
NICE's remit implies a series of characteristics for any empirical research on the threshold: Reflect the expected health effects (in terms of length and quality of life) of NICE guidance through the displacement decisions taken across the NHS rather than what specific services are (or could have been) displaced.
Facilitate regular updates, based on routinely available data, to reflect NHS changes such as real overall expenditure and productivity. This would encourage accountability through scrutiny by stakeholders and provide predictability for technology manufacturers' investment decisions.
The nature of service displacement and the magnitude of the health forgone will depend on the scale of the budget impact which should, ideally, be reflected in the value of the threshold.
Methods should recognise the inevitable uncertainty relating to the evidence currently available for the threshold and reflect its implications for policy.
2
Study methods2.1
The aim was to develop methods to estimate the NICE cost-effectiveness threshold making use of routinely available data. Objectives were:i. Informed by relevant literature, to provide a conceptual framework to define the threshold and the basis of its estimation.
ii. Using programme budgeting data for the English NHS, to estimate the relationship between changes in overall NHS expenditure and changes in mortality.
iii. Extend the measure of benefit in the threshold to QALYs by estimating the quality of life (QoL) associated with additional years of life and the direct impact of health services on QoL.
2.2
Earlier econometric analysis estimated the relationship between differences in primary care trust (PCT) spending and associated disease-specific mortality. Expenditure came from programme budgeting data which allocates the entire volume of health care expenditure to broad programme budget categories (PBCs) according to primary diagnosis.2.3
This research extended this in several ways including estimating the impact of marginal increases or decreases in overall NHS expenditure on spending in each of the 23 PBCs. These were linked to changes in mortality outcomes by PBC across 11 PBCs.2.4
The results of the econometric analysis were translated into broader effects in terms of QALYs. The first stage linked estimated effects on mortality to life years taking into account the ‘counterfactual’ deaths that would have occurred if the population in a given PBC faced the same mortality risks as the general population. The second stage accounted for the health (QALY) effects of changes in mortality due to changes in expenditure reflecting how QoL differs by age and gender. The third stage incorporated those effects on health not directly associated with mortality and life year effects (i.e., the ‘pure’ QoL effects) to estimate an overall cost per QALY threshold. The approach uses the estimates of mortality and life year effects as 'surrogate outcomes' for a more complete measure of the health effects of a change in expenditure. This appears more plausible than assuming no effects of NHS expenditure on quality of life outcomes.2.5
The estimated proportional effect on the mortality and life year burden of disease is applied to measures of QALY burden. Applying a proportionate effect to measures of QALY burden of disease is equivalent to assuming that any estimated effects on life years are lived at quality of life that reflects a proportionate improvement to the quality of life with disease. It also allows quality of life effects of changes in expenditure to be included; also based on proportionate improvement in the quality of life with disease. In those PBCs where mortality effects could not be estimated theproportional effect of changes in expenditure on QALY burden of disease is assumed to be the same as the overall proportional effect on the life year burden of disease across those PBCs where
mortality effects could be estimated.
2.6
The methods planned for the study included a consideration of local data, collected routinely by PCTs, on the types of intervention in which local decision-makers were investing and disinvesting. The aim was to inform the link between the effects of expenditure changes on mortality and impacts on broader health in terms of QALYs. These data may have indicated the types of interventions and services, within a given PBC, on which investment and disinvestment were taking place. Using targeted literature reviews, estimates of QoL for those activities may have been identified. However, it was established that there were limited data available at a local level to facilitate this type of analysis, so other data sources were used for this purpose.3
Central or 'best' estimate of the threshold3.1
The most relevant threshold is estimated using the latest available data (2008 expenditure, 2008-10 mortality). The central or 'best' threshold is estimated to be £12,936 per QALY.4
Which PBCs have the greatest influence on the overall threshold?part of a change in overall expenditure (50%) but only 22% of the overall health effects, i.e., the cost per QALY estimates associated with a change in expenditure in these PBCs are, in general, much higher.
4.2
Insofar as investment and disinvestment opportunities in these PBCs might have been more valuable (offered greater improvement in QoL) than suggested by the implied PBC thresholds, the overall QALY effects will tend to be underestimated and the overall cost per QALY threshold will be overestimated.4.3
The overall threshold of £12,936 may be conservative (i.e., could be overestimated) with respect to health effects in PBC5 (Mental Health Disorders), which accounts for a large proportion of the change in overall expenditure (18%) and contributes most to the overall health effects (12%) compared to these other PBCs. The cost per QALY associated with this PBC is based on an extrapolation rather than observations of the direct impact of changes in expenditure on QoL. Available evidence suggests that the investment and disinvestment opportunities in mental health may have been more valuable than its implied cost per QALY.5
How uncertain are the estimates and what are the implications?5.1
Simulation methods were used to reflect the combined uncertainty in the various estimates from the econometric analysis. This indicated that the probability that the overall threshold is less than £20,000 per QALY is 0.89 and the probability that it is less than £30,000 is 0.97.5.2
As the consequences of overestimating the threshold are more serious than underestimating it in terms of population health, apolicy thresholdwill be lower than the mean of the cost per QALY threshold (i.e., lower than £12,936) to compensate for the more serious consequences of overestimating the ‘true’ value.5.3
There were other ('structural') sources of uncertainty associated with the estimated threshold, specifically relating to the choice of econometric models and identification of causal effects.Although all the models passed the relevant tests of validity, there remained some uncertainty about the validity of the instruments. This structural uncertainty constituted a greater part of the overall uncertainty associated with the mortality effects of changes in expenditure, but the central estimate of the cost per QALY threshold was robust to this uncertainty.
5.4
The method of analysis used to link the effects of changes in expenditure on mortality to a fuller measure of health expressed in QALYs was also subject to uncertainty. A preferred analysis (or scenario) was identified as making the best use of available information, with assumptions appearing more reasonable than the available alternatives and providing a more complete picture of the likely health effects of a change in expenditure.5.6
There are some reasons why the central estimate of the QALY threshold might be underestimated (e.g., see items 1 to 4 in Box 5.1 in Section 5.4). For example in calculating life year effects it is assumed that those deaths averted by a change in expenditure returns the individuals to the mortality risk of the general population (matched for age and gender). There are a number of other reasons why the central estimate might be overestimated (e.g., see assumptions 5 to 7 in Box 5.1). For example, the health effects of a change in expenditure are restricted to the population at risk during one year. This also means that the health effects of changes in expenditure which reduce incidence (prevention of disease) will not be captured either. A more formal and longer lag structure in the estimation of outcome elasticities would be likely to capture more health effects of a change in expenditure.5.7
The effect of other assumptions that have been necessary are more ambiguous although some evidence suggests their net effect maybe conservative with respect to health effects of changes in expenditure (e.g., assumptions 8 to 10 in Box 5.1).6
The impact of investment, disinvestment and non marginal effects6.1
The central estimate of the cost per QALY threshold is based on estimates of the health effects of changes in expenditure across all 152 PCTs, some of which will be making investments (where expenditure is increasing) and others making disinvestments (where expenditure is reduced or growing more slowly).6.2
The threshold is, however, likely to differ across these different types of PCT. It would be expected that, other things equal, more expenditure would increase health but at a diminishing rate.Therefore, the amount of health displaced by disinvestment would be expected to be greater, and the associated threshold lower than the central estimate. Conversely, the health gained from investment would be expected to be lower, and the associated threshold higher.
6.3
This was examined by re-estimating the outcome and expenditure effects separately for those PCTs where their actual budget is under the target allocation from the Department of Health resource allocation formula (i.e., those under greater financial pressure and more likely to be disinvesting than investing), and those that are over target (under less financial pressure and more likely to be investing than disinvesting).6.4
The results confirm these expectations: the health effects of changes in expenditure are greater when PCTs are under more financial pressure and are more likely to be disinvesting then investing. The analysis suggests that budget impact not only displaces more valuable activities within each PBC but that overall expenditure tends to be reallocated to PBCs which can generate more health. Although further research might enable a quantitative assessment of how the relevant threshold should be adjusted for the scale of budget impacts, the qualitative assessment seems clear: the central estimate of the threshold is likely to be an overestimate for all technologies which impose net costs on the NHS (almost all technologies appraised by NICE); and the appropriate threshold to apply should be lower for technologies which have a greater impact on NHS costs.7
How does the threshold change with overall expenditure?how the threshold might be expected to change over time as, for example, overall expenditure and NHS productivity changes.
7.2
This has implications for a judgement about the appropriate frequency of periodic reassessment of the cost per QALY threshold. Other things equal, the threshold would be expected to increase following a rise in overall expenditure, although this will depend on whether there is discretion over how additional resources can be spent. However, insofar as the productivity of those activities that are valuable to the NHS also improves through innovation, the threshold will tend to fall. So the net impact of these two countervailing effects on the threshold cannot be determineda priori.7.3
Differences in the estimated thresholds between 2007 and 2008 were assessed. Although overall expenditure increased by 6% between 2007 and 2008 which represented real growth of 2% in 2007 prices, the overall threshold for all 23 PBCs fell by 5% in nominal terms and by 8% in real terms.7.4
The reasons are complex but reflect changes in productivity, which differ across PBCs, but also a general reallocation of a change in overall expenditure towards those PBCs that appear more valuable in 2008. Given the uncertainty in estimation, subtle differences between 2007 and 2008 should not be over-interpreted. This analysis does suggest, however, that the overall threshold will not necessary increase with growth in the real or even nominal NHS budget. This suggests that the threshold is more likely to fall at a time when real budget growth is flat or falling and PCTs find themselves under increasing financial pressure.8
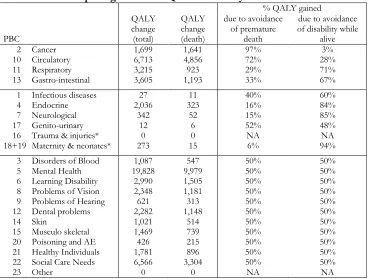
What type of health is forgone by approval of a new technology?8.1
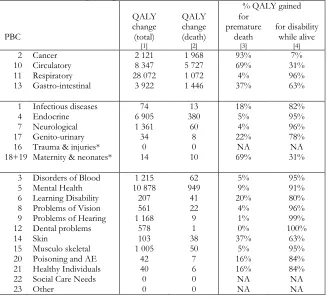
The methods of analysis can identify not only how many QALYs are likely to be forgone across the NHS as a consequence of approving a technology which imposes additional costs on the NHS, but also where those QALYs are likely to be forgone and how they are made up, i.e., the additional deaths, life years lost and the QoL impacts on those with disease.8.2
As an example, based on the 2008 central estimate of the cost per QALY threshold (£12,936), the approval of ranibizumab for the treatment of diabetic macular oedema (prior to the patient access scheme agreement) would have imposed additional annual costs of up to £80m on the NHS each year and been likely to displace 6,184 QALYs elsewhere in the NHS. This forgone health is likely to be made up of 411 additional deaths and 1,864 life years forgone, most of which are likely to occur in Circulatory, Respiratory, Gastro-intestinal and Cancer PBCs. However, much of the total health effect of these additional costs (4,987 QALYs) is associated with QoL forgone during disease which is most likely to occur in Respiratory, Neurological, Circulatory and Mental Health PBCs.9
Conclusions and implications for practice9.1
The research presented here goes some way to providing an empirically-based and explicit9.2
The methods presented can be used as a framework for further empirical work as additional and more appropriate data emerge in the NHS. They also offer a basis for threshold estimation in other health care systems with budget constraints that use cost effectiveness analysis to inform resource allocation decisions.9.3
The study also starts to make the other NHS patients, who ultimately bear the opportunity costs of such decisions, less abstract and more ‘known’ in social decisions. Since who happens to be known or unknown is only a matter of perspective, time and ignorance, ethical and coherent social decisions require that both should be treated in the same way. These methods contribute to removing some of the ‘ignorance’ and making the unknown more real.9.4
This work has implications for the Government's proposals to move to a system of value-based pricing for new prescription pharmaceuticals, which may include some additional weight for health benefits in diseases which impose a large health burden and/or where there are wider social benefits for patients, their carers and the wider economy. The methods developed in this research will allow the same weights to be also attached to the type of health that is lost and estimate the wider social benefits that are likely to be lost when the NHS must accommodate the additional costs of new drugs.10
Research recommendations10.1
Update estimates of the threshold with more recent and future waves of expenditure and mortality data.10.2
If other aspects of social value are applied to health benefits of a new technology they must also be attached to the type of health that is likely to be forgone due to additional NHS costs. The methods developed here can be extended to allow weights to be also attached to the type of health that is forgone and estimate the wider social benefits that are likely to be lost when the NHS must accommodate the additional costs of new drugs.10.3
We have demonstrated that these methods of analysis can be applied to quality of life data collected as part of PROMs. This type of analysis could be applied to these data in key PBCs as PROMs is rolled out providing some evidence about the quality of life effects of changes in PBC expenditure.10.4
A key PBC is Mental Health. Currently outcomes data that could be linked to measures of quality of life are routinely collected in primary care. In principle, the same methods of analysis can be applied to these data once they are made available providing some evidence about the quality of life effects of changes in mental health expenditure.10.5
Improved and more recent estimates of incidence (by age and gender) and duration of disease will soon be available from the recently published updated WHO Global Burden of Diseasestudy. These data could be used when the threshold is re-estimated for later waves of expenditure data. Alternatively, estimates could be based on CPRD data.
covariates over time. The formation of Clinical Commissioning Groups (CCG) in 2013 will make the time series problematic for waves of expenditure after 2012 unless it is possible to match CCG and PCT boundaries.
10.7
If PBC expenditure and outcome data are available at CCG level (as well as covariates and suitable instruments), it might become possible to estimate outcome and expenditure equationsChapter 1: Introduction
1.1 Policy context
A comparison of the incremental cost effectiveness ratio (ICER) of a new technology with a cost-effectiveness threshold is not the only consideration when the National Institute for Health and Clinical Excellence (NICE) and its advisory committees issues guidance. But it is an important one as it allows an assessment of whether the health expected to be gained from the use of a technology exceeds the health expected to be forgone elsewhere as other NHS activities are displaced. For this reason a comparison of the ICER of a technology to a threshold range is a critical part of the reference case in the NICE Guide to Methods of Appraisal[1] and is often taken to be the starting point for deliberations about other considerations including judgements of social value. Therefore, the value of the threshold is critical to the assessment of whether technologies can be regarded as cost-effective. This is also true for other NHS resource allocation decisions which potentially impose additional costs on local NHS commissioners.
From 2014 the Government plans to introduce a new approach to determining the appropriate price of prescription pharmaceuticals. Under value-based pricing, the price the NHS pays for a new product will be directly linked to its cost-effectiveness.[2, 3] Therefore, the value of the threshold will be even more important as it will have a major impact on the prices that the NHS pays for pharmaceuticals, the access that NHS patients will have to new drugs and the return that manufacturers can expect from future research and development.[4, 5]
1.2 Estimating the cost-effectiveness threshold
A key part of NICE’s remit is to make decisions which are consistent with the efficient use of NHS resources. In the context of the NHS budget constraint, a consideration of efficiency has to reflect the implications of imposing additional costs on the system which will displace existing services thus leading to health decrements for patients other than those benefiting from the new technology being appraised. The cost-effectiveness threshold is an estimate of health forgone as other NHS activities are displaced to accommodate the additional costs of new technologies. A national decision-making body like NICE needs an estimate of what is likely to be forgone across the NHS as we currently find it.[6] Of course, this will change as circumstances and the NHS change; tending to rise with increases in budget and health care costs but tending to fall with increases in the productivity of health technologies and the efficiency of the NHS in general - including better local commissioning decisions.[7] A body like NICE cannot and does not necessarily need to know whatspecificservices and treatments will be displaced in particular localities or who will actually forgo health.
What is required, therefore, is an accountable and empirically-based assessment of the health that is likely to be forgone on average across the NHS. Currently NICE uses a threshold range of £20,000 to £30,000 per quality adjusted life year (QALY) gained, where additional considerations are required towards the upper bound.[1] The empirical basis of this range of values is very limited and there have been calls for further research in this area.[8] Explicit scientific methods are required which will provide accountability so that estimates can be scrutinised by a range of stakeholders. Since estimates of the threshold will need to be periodically revised, methods which make best use of routinely available NHS data are needed. As well as accountability, this will also provide more predictability in likely changes to the threshold for the investment decisions of technology manufacturers.
1.3 Aims and objectives
The aim of this research is to develop and to demonstrate methods to estimate the cost-effectiveness threshold for the NHS which makes best use of routinely available data. Methods are required which can capture the impact of a change in expenditure on length and quality of life (QoL), indicate how estimates of the threshold have changed over time, reflect uncertainty in any estimates and assess its implications, and indicate the impact of increases or decreases in spending. The project also aims to discuss options for developing data sources in the UK to estimate the threshold more precisely over time.
i. Informed by relevant literature, to provide a conceptual framework to define the threshold and the basis of its estimation.
ii. Using programme budgeting data for the English NHS, to estimate the cost per life year gained on average across the NHS, for marginal changes in budget.
iii. To extend the measure of the health effects of changes in expenditure by estimating the QoL associated with additional years of life and the direct impact of health services on QoL.
iv. To synthesise this work to bring evidence on life-years and QALYs together, to present the best estimate of the cost-effectiveness threshold given existing data, to show the implications of the uncertainty in the current evidence and to provide recommendations for future data collection and analysis.
1.4 Report structure
Chapter 2: Policy Context and Conceptual Framework
2.1 Introduction
The purpose of this chapter is to provide the foundation for the empirical chapters that follow. It addresses a series of questions regarding the nature of the cost-effectiveness threshold that NICE use to guide its decisions, and the principles of how it should be estimated.
The chapter is informed by the results of a systematic literature search relating to these questions. Details of the methods and results of that search, together with a summary of the papers identified, are provided in Appendix A. In brief, the search uses a 'pearl growing' method to identify relevant papers. This identifies a number of initial key articles ('pearls') on the basis of expert advice, and 'grows' these pearls in a series of steps: extraction of citations and references from the initial pearls; identification of further pearls from cited and referenced papers; repetition of citation and reference searches; and manual search of references. This process is repeated until no further papers of relevance are identified. On this basis, 76 relevant papers were identified and are referred to, when relevant, in this chapter.
This chapter is organised as follows. The next section considers, at a conceptual level, what the cost-effectiveness threshold to inform NHS decisions, such as those made by NICE's advisory committees, should represent. Section 2.3 considers alternative routes to generating an empirical estimate of such a threshold. The final section provides a brief overview of the methods used in the study.
2.2 What should the NICE threshold represent?
2.2.1 The threshold as a measure of opportunity cost
NICE uses cost-effectiveness analysis (CEA) to inform the decisions underlying most types of guidance that it publishes. The use of CEA is most prominent in appraisals relating to new medicines,[1] but is also a key input into diagnostics appraisals as well as clinical guidelines and public health guidance.[1, 9] For those interventions and programmes which impose additional costs on the NHS budget, their incremental cost-effectiveness ratios (ICERs) indicate the incremental cost per additional quality-adjusted life-year (QALY) achieved relative to appropriate comparators. Although the ICER is one of a number of evidential inputs into NICE committees' decisions, is has been shown to be the most important, at least for technology appraisals.[10]
Interpreting whether a given ICER is acceptable requires the use of a cost-effectiveness threshold. Given that NICE has no influence on the level of the NHS budget, its decisions need to consider that budget a fixed constraint.[6] Therefore, the threshold should reflect the opportunity costs, in terms of health forgone, resulting from the imposition of additional costs on the NHS. When NICE issues positive guidance for a new intervention which imposes additional costs on the system, the resources required to deliver it must be found by disinvesting from other interventions and services elsewhere.[11] This displacement of existing services will result in health decrements for other types of individual.[12] Thus the threshold represents the additional cost that has to be imposed on the system to forgo 1 QALY worth of health through displacement.
Resource allocation decisions based on comparing an ICER with a cost effectiveness threshold uses some simplifying assumptions including those of constant returns to scale and perfect divisibility of
programmes.[13] Some have suggested that this makes these methods unreliable,[14] although it has also been argued that they provide useful approximations to guide decisions.[15] This report takes NICE's use of these methods as a starting point, and does not review the literature relating to this debate in any depth.
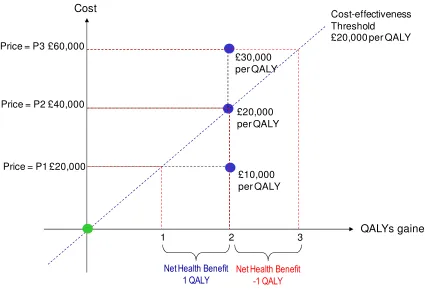
generates 2 additional QALYs per patient and, at price P1, imposes an additional £20,000 per patient; the ICER is, therefore, £10,000 per QALY gained. At a threshold of £20,000 per QALY, the additional cost of £20,000 per patient translates into a decrement of 1 QALY (the distance between the y-axis and the threshold). This is because the threshold indicates the additional cost that needs to be imposed on the NHS budget in order to displace services that result in 1 QALY being forgone. Therefore, at that price, there is a net health gain of 1 QALY per patient (2 gained from the new intervention and 1 forgone through displacement). At a price of P2, the additional cost per patient of the new intervention is £40,000 and the net health gain is zero: the 2 additional QALYs from the new intervention are the same as the QALYs forgone through displacement. At the highest price of P3, the adoption of the new intervention would actually result in a net health decrement of 1 QALY as it generates fewer QALYs (2) than are forgone (3).
Figure 2.1: graph showing illustration of the NICE threshold as a basis for assessing net health
benefit. Adapted from Claxtonet al[4]
The use of the threshold to facilitate this net health benefit (NHB) analysis can be expressed as in Equation 2.1:
k
C
h
NHB
hEquation 2.1
where his the change in health generated by the new intervention,
C
his the additional health carecost imposed on the NHS, and k is the cost effectiveness threshold. The net health gain from adopting
the new intervention is, therefore, the health gained, h, minus the health forgone ,
k
C
h
.
Understanding the NICE cost-effectiveness threshold as representing opportunity costs in terms of health is explicit in NICE documentation (for example, the methods guide for technology appraisal[1]). It is also clear in reports published by the Department of Health, such as the consultation report on value-based pricing.[8, 16, 17] This conceptualisation of the principles of the NICE threshold is also
£20,000 per QALY £40,000
Price = P2
Cost-effectiveness Threshold
£20,000 per QALY
QALYs gained Cost
£60,000
£30,000 per QALY Price = P3
3 £20,000
2
£10,000 per QALY Price = P1
1
Net Health Benefit 1 QALY
described in the broader literature.[6, 7] Formally, the threshold can be seen as the shadow price of the budget constraint.[6, 7, 12, 18-20] Although this project focussed on the use and estimation of a cost-effectiveness threshold for NICE decisions, the methods and estimates relate to any resource allocation decision within the NHS where the opportunity cost could fall anywhere in the system. Hence it could apply, for example, to Department of Health targets or to Commissioning Board directives, as well as NICE guidance.
2.2.2 The threshold as the consumption value of health
Another view of what the threshold used in CEA should represent exists in the literature, however. In general terms, this is based on the rate at which individuals are willing to forgo other forms of
consumption to achieve health improvement (sometimes referred to as 'willingness to pay').[21-40] Although this consumption value of health can provide information on the value of health improvement and may guide decisions such as the level of the overall NHS budget, it does not inform decisions regarding how to allocate a fixed budget within the health care system.
The reason for this is that the consumption value of health applies equally to health gained as well as to health forgone. This is shown in Equation 2.2 where the consumption value of health, v, is added to the definition of NHB in Equation 2.1. This simply involves valuing both health gained and health forgone by the same consumption value of a unit of health,v. Therefore, the use of the consumption value is irrelevant: a treatment considered cost effective in Equation 2.1 (i.e. to have a positive NHB) will inevitably be considered cost-effective in Equation 2.2, and an intervention with negative NHB (i.e. not cost effective) will remain as such in Equation 2.2.1 Therefore, the magnitude of the threshold, k, is not a
value judgment but an empirical question which can, in principle, be estimated.
h
C
k
v
h
v
NHB
.
Equation 2.2
2.3 Estimating the threshold
2.3.1 NICE's threshold range
NICE has been reluctant to specify a single cost effectiveness threshold used in its decision making.[10] It has also consistently emphasised that factors other than CEA are taken into consideration by the various advisory committees.[1, 9, 10, 41-43] Therefore, it has preferred to indicate the range within which its threshold value lies - £20,000 to £30,000 per QALY gained.[1, 9] Alongside this, it has provided an indication of the role other factors play in determining which point of threshold range is relevant. The latest guide[1] suggests that an ICER below £20,000 is likely to lead to recommendation unless the evidence is considered highly uncertain; an ICER between £20,000 and £30,000 will lead to
1This is the case so long as all incremental costs are health care system costs or, as currently, the perspective
recommendation if the committee is also happy with the levels of uncertainty in the evidence and/or the QALY does not capture all aspects of benefit; and an ICER above £30,000 would only be recommended if issues related to levels of evidential uncertainty and a failure to capture all benefits in the QALY are particularly compelling.
In the following year, NICE issued further supplementary guidance relating to the appraisal of
interventions for patients with short life expectancy, although this can be considered to relate more to the measure of benefit than factors to be considered outside of cost effectiveness.[44] In 2012 NICE issued a draft update of its methods guide which added that, if a new technology has an ICER above £20,000 per QALY, the committee's deliberations would also consider 'aspects that relate to non-health objectives of the NHS' (e.g. wider social considerations and/or costs that fall outside of the NHS budget).[45]
Although NICE has carefully argued the case for why its decisions are not driven entirely by a
comparison of the ICER with its threshold range, it has not provided any empirical evidence for why the threshold range takes the value it does. Indeed it has been widely argued than an empirical basis for these values should be generated.[8, 46-50] For example, the House of Commons Health Select Committee in 2008 argued:
“The affordability of NICE guidance and the threshold it uses to decide whether a treatment is cost-effective is of serious concern. The threshold is not based on empirical research and is not directly related to the budget, it seems to be higher than the threshold used by PCTs for treatments not assessed by NICE. Some witnesses, including patient organisations and pharmaceutical companies, thought that NICE should be more generous in the cost per QALY threshold it uses, and should approve more products. On the other hand, some PCTs struggle to implement NICE guidance at the current threshold and other witnesses argued that a lower threshold should be used. We recommend that the threshold used by NICE in its full assessments be reviewed; further research comparing thresholds used by PCTs and those used by NICE should be undertaken....” ([8], page 6).
2.3.2 The basis for empirical work
Although there is acceptance of the need for empirical work on the NICE cost-effectiveness threshold, a set of issues exists regarding the starting point for such analysis. One aspect of this is the view that the nature of the services that are displaced in response to additional costs being imposed by NICE guidance, and hence the magnitude of the health forgone for other patients, will depend on the productivity of the NHS and its overall (inflation adjusted) budget, both of which have increased since NICE initially defined its threshold range.[51, 52] In principle an increase in the (real) NHS budget would allow it to introduce interventions which were previously not cost effective which might be expected to increase the threshold if these interventions were the marginal ones displaced in response to the budget impacts of NICE recommendations. However, any increase in the NHS budget may be allocated to non-discretionary expenditure. This would include, for example, expenditure relating to national initiatives such as new contracts for consultants and activities to meet waiting list targets as well as, of course, the
implementation of NICE guidance. The non-discretionary nature of such expenditure means that these types of activities cannot easily be disinvested from given a need to release resources to fund NICE guidance. Therefore, if an increase in the NHS budget is largely devoted to these types of non-discretionary expenditure, there will be a limited impact on the threshold.
Gains in productivity may come through doing worthwhile activities more cost effectively, including for those marginal interventions displaced by NICE recommendations, suggesting a reduction in the threshold. Alternatively, productivity gains might come through discontinuing activities which are not worth doing (i.e. that produce no health improvement), freeing resources for additional cost effective interventions which may be the marginal services displaced by NICE guidance - this can have the result of increasing the threshold.
developments, and this would have to be considered as part of any regular updating of the empirical analysis of the threshold.
A second issue to be considered relates to how decisions are taken locally about any displacement following NICE guidance. The principles of CEA suggest that such displacement should relate to interventions which are the least cost effective of those currently covered by the budget.[18] The basis for how local commissioners and providers make their disinvestment decisions is not clear, however, and there have been calls for greater transparency and guidance in this area.[51] It would be entirely
unrealistic to assume that displacement only takes place in those existing services which are the least cost effective. The reality is that numerous criteria are likely to be used by commissioners in implementing disinvestment, and that significant variation will exist between local decision makers.[12] Such criteria might include, for example, equity concerns about a particular disadvantaged group locally or capacity constraints regarding particular services. Therefore, NICE needs to know what is likely to happen on average across the NHS given the reality of local decisions. If local decision making changes over time -for example, if local commissioners become more focussed on displacing services which are the least cost effective, in terms of population health - this may affect the estimate of the threshold.
2.3.3 Studying displacement locally
A reasonable conclusion from a consideration of these issues is, therefore, that local decisions about disinvestment are likely to be an important determinant of the NICE threshold.[53-58] Applebyet al
sought to assess whether it was possible to study local decisions about service investment and disinvestment to infer the cost effectiveness thresholds being used (implicitly) locally and to draw conclusions about the appropriate level of the NICE threshold.[59] They identified six primary care trusts (PCTs) and undertook structured interviews with each of the directors of public health. They also administrated questionnaires to an opportunistic sample of finance directors from NHS trusts. On this basis they developed a list of new services as well as those that had been deferred or discontinued. An attempt was made to estimate the implicit local ICER relating to these decisions by using any cost effectiveness evidence used to inform the decisions together with relevant evidence on cost effectiveness from the published literature.
The study found it quite straightforward to identify specific services that had been introduced, discontinued or deferred, but concluded that these decisions were typically based on clinical and other non-economic factors. A number of 'decisions at the margin' were identified but none of these was based on cost effectiveness analysis. Instead, the basis for changes in services was a 'business case', or overall cost impact. It was possible to impute cost effectiveness for most of the services affected, but the study concluded that, even with a larger sample of commissioners and providers, it would be very difficult to estimate an implied cost effectiveness threshold locally. This would be because, firstly, most PCT decisions were service reconfigurations including demand management and waiting list initiatives. By their nature, teasing out the incremental cost and health effects, potentially across numerous types of patients, would be an enormous challenge. Secondly, there would be difficulty in identifying all local decisions as many options for investment, deferment or discontinuation are rejected before they are made more explicit in documentation. A third problem would be the finding that a range of criteria is used to make local decisions, with relatively little concern for cost effectiveness , making a local threshold estimated in this way hard to interpret. A final challenge would be that it would be very difficult to establish a causal link between a change in local NHS budget and specific local investment and disinvestment decisions. The Applebyet alstudy highlights the problems that exist in deriving a cost effectiveness threshold from a bespoke study of specific local resource allocation decisions.
2.3.4 What evidence is needed?
They should reflect the effect of NICE guidance on theaverageof the displacement decisions taken across the NHS, with less consideration on which types of patients and interventions are affected and why the decision are taken. NICE cannot be expected to reflect what is likely to be marked variation between local commissioners and providers in how they react to an effective reduction in their budget as a result of positive guidance. Given NICE's remit, it is the expected health effects (in terms of length and quality of life) of the average displacement within the current NHS (given existing budgets, productivity and the quality of local decisions) that is relevant to the estimate of the threshold.
The methods used should not be a 'once and for all' effort but should facilitate regular updates to reflect changes in the broader NHS context such as changes in the overall real budget and productivity. This requires the use of data sources that are currently routinely available, are expected to become so in the future or could be made available at reasonable cost. It may be possible to glean some idea of how the threshold may change in the future by studying how it has changed in the past, which would require routine data sources to extend back over a period of time. Periodic updating using explicit scientific methods would encourage accountability through scrutiny of estimates by relevant stakeholders. It would also provide more
predictability in likely changes to the threshold for the investment decisions of technology manufacturers.
The nature of the displacement of existing services (and hence the magnitude of the health forgone) will depend on the scale of the budget impact coming through NICE guidance. Therefore, the methods used to estimate the threshold should ideally be able to reflect this budget impact.
The methods should recognise the inevitable uncertainty relating to the evidence currently available for threshold estimation and translate this into an expression of the uncertainty in the estimate of the threshold. As well as providing information with which NICE can determine the appropriate implications for its choice of a threshold value, this consideration of uncertainty can help to prioritise further research or the collection of routine data.
2.4 An introduction to study methods
The current study has sought to develop methods consistent with these desired characteristics. This section provides a summary of the methods used. Further details are provided in each of the later chapters relating to the various components of work, and in the associated appendices. The general approach taken is to use routinely available data to look at the relationship between overall NHS expenditure and patients' health outcomes. By exploiting differences between PCTs in expenditure and outcomes, it is possible to infer the costs of generating health improvement from NHS services at the margin. In principle, this is what is needed as the basis of the NICE cost effectiveness threshold as it provides an indication of the health forgone through the services displaced by the additional budget effect of the Institute's guidance.
2.4.1 Past work
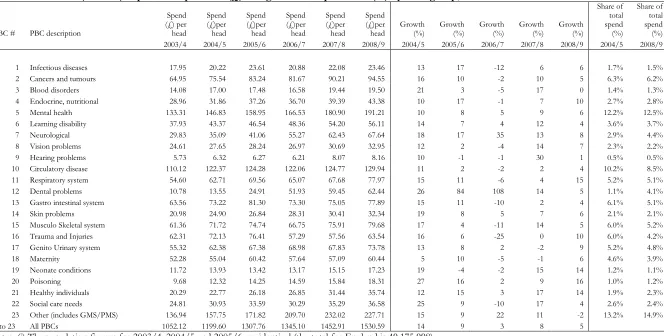
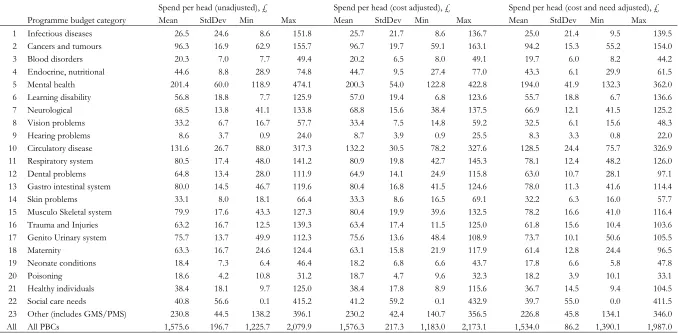
The study was able to build on some key existing research relating to the relationship between NHS expenditure and mortality.[60-62] Since 2003 data on expenditure on health care across 23 programme budgeting categories (PBCs) of care have been available for each PCT in the NHS in England. These programme budgeting data seek to allocate, to broad areas of illness according to the primary diagnosis (using ICD10 codes) all items of NHS expenditure, including expenditure on inpatient care, outpatient care, community care, primary care and pharmaceuticals and devices.
between PCTs in need. Changes in mortality were then transformed into life-years gained using
assumptions regarding life expectancy without the change in expenditure. This provides estimates of the marginal cost per life-year gained on average across the NHS by PBC.
This work focused largely on spending and outcomes in two of the largest programmes: circulatory disease and cancer,[63] but has also informed the link across other programme categories.[61, 64] Estimates of the cost per life year gained for 2006/07 were £15,387 for cancer, £9,974 for circulation problems, £5,425 for respiratory problems, £21,538 for gastro-intestinal problems and £26,428 for diabetes. These estimates were based on a straightforward, though carefully constructed, theoretical model of health production which informs the specification and estimation of a set of equations. These dealt with the challenge of there being alternative plausible directions of causation - for example, between expenditure and health outcomes within a programme. This problem of endogeneity was addressed by identifying and testing suitable instrumental variables. In doing so, they accounted for variation in the clinical needs of the local population relevant to each programme together with broader local
environmental factors relevant to the costs of care and outcomes.
This earlier work provides a strong foundation for the current study through its consideration of the average marginal elasticity of outcome with respect to programme expenditure. However, to estimate the threshold suitable for NICE decision making, a number of further elements of research are necessary, and these are described below.
2.4.2 Further econometric analysis
This further econometric research is covered in Chapter 3, with full details in Appendix B. The earlier work estimated the cost per life-year gained for the major programme areas. The NICE threshold needs to relate to the whole NHS and will, therefore, depend on all the programmes of care where
disinvestment takes place. Given that each programme of care has been estimated separately, it is not clear how expenditure on particular programmes changes with the overall budget. For example, does disinvestment tend to fall on respiratory care or diabetes following a budget impact from NICE guidance? Therefore, the current study has further developed the econometric analysis to reflect the need for PCTs to operate within a fixed overall budget. This provides an estimate of the ‘budget elasticity of expenditure’ in each PBC, and facilities estimates of the impact of marginal increases (or decreases) in overall PCT budgets on spending in each PBC.
As well as indicating budgetary influences on programme spending these have then been linked to
changes in mortality outcomes by programme. These changes are used to estimate years of life lost taking account of the fact that some of the observed deaths would have occurred anyway (had the same
population not been at risk in the particular PBC); that is, taking account of unobserved counterfactual deaths. This takes into account how such budgetary changes (such as those imposed by NICE guidance) translate through local decisions into changes in expenditure on programmes of care and then to health outcomes.
Changes in budgets are in practice incremental rather than marginal, and it may be the case that the outcome elasticities of programme expenditure in times of budgetary increase (when new initiatives are introduced) are not the same as in times of budgetary decrease (when the focus is on disinvestment). The possible effects of non-marginal changes have, therefore, been explored. The project has also sought to explore how both expenditure and outcome elasticities, and hence the threshold, vary over time, and this has been assessed by generating relevant estimates for three sets of data.
A development from earlier work has been to relate expenditure in periodtto mortality in periodst, t+1
andt+2. Whilst the data used are largely cross-sectional, mortality data are linked so as to follow
2.4.3 Moving from life-years to quality-adjusted life-years gained
A key element of the research has been to take the results of the econometric work linking NHS spending and mortality, and to translate this into effects on life years and quality adjusted life years (QALYs). The methods planned for the study included a consideration of local data, collected routinely by PCTs, on the types of interventions in which local decision-makers were investing and disinvesting. The aim was to inform the link between the effects of expenditure changes on mortality and impacts on broader health in terms of QALYs. These data may have indicated the types of interventions and services, within a given PBC, on which investment and disinvestment were taking place. Using targeted literature reviews, estimates of QoL for those activities may have been identified. However, it was established that there were limited data available at a local level to facilitate this type of analysis, so other data sources were used for this purpose (see Addendum C2).
It has, therefore, been necessary to consider alternative data and approaches. This is tackled using three sequential steps:
i. Translate the estimated effects on mortality from the econometrics work into life years by exploring the limitations of the mortality data available at PCT level and the published years of life lost (YLL) figures used in the econometric analysis, and by considering how to improve the estimates using additional data and analysis.
ii. Consider how estimates of life year effects can be adjusted for the quality of life in which they are lived, taking account of the gender and the age at which life years are gained or lost as well as the quality of life implications of particular diseases.
iii. Explore ways to take account of those effects on health not directly associated with mortality and life year affects (i.e., the ‘pure’ quality of life effects) to estimate an overall cost per QALY threshold.
This aspect of the analysis is described in Chapter 4 with further details provided in Appendix C.
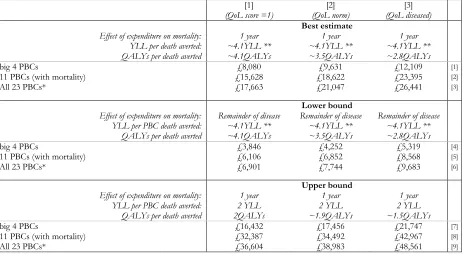
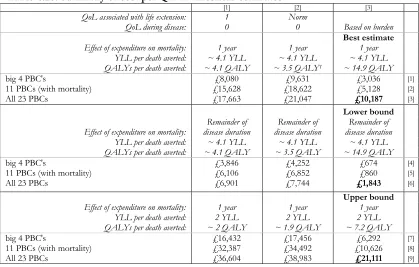
The central or ‘best’ estimate is based on two assumptions relating to the health effects associated with expenditure, one conservative and the other more optimistic. The first assumption is that the health effects of changes in one year of expenditure are restricted to one year. This is implicit in the estimates of outcome elasticities estimated in the econometric analysis. This is likely to underestimate effects on mortality since expenditure that reduces mortality risk for an individual in one year may well also reduce their risk over subsequent years, and expenditure may also prevent disease in future patient populations. Therefore, total health effects will be underestimated and the cost per life year or QALY threshold will be overestimated. Although undoubtedly conservative, it may be offset to some extent by the more
optimistic assumption. It is assumed that any death averted by expenditure in one year will return the individual to the mortality risk of the general population, i.e., the years of life gained associated with each death averted are based on what would have been their life expectancy taking account of their of age and gender (using life tables for the general population).
The extreme upper and lower bounds for cost per life year and cost per QALY thresholds are based on making both of these assumptions either optimistic (providing the lower bound for the threshold) or conservative (an upper bound for the threshold). The lower bound is based on assuming that health effects are not restricted to one year but apply to the remaining disease duration for the population at risk during the expenditure year. The upper bound is based on the combination of assuming that health effects are restricted to one year and that any death averted is only averted for the minimum duration consistent with the mortality data used to estimate the outcome. It is very important to note that the lower and upper bounds are very much extreme values with limited plausibility.
2.5 Conclusions
Chapter 3: The link between NHS spending, mortality and the cost of a life
year
3.1 Introduction
This section presents an overview of the econometric work undertaken to estimate the link between NHS spending and mortality and how this is used to calculate the cost of a life year. As well as providing the analytical foundations for estimates of cost per QALY threshold presented in Chapter 4 and 5 this work also contributes to the on-going debate about the extent to which additional health care expenditure yields improved patient health outcomes.
The work presented in this report takes advantage of the availability of two new datasets to examine the relationship between National Health Service (NHS) expenditure and mortality rates for various disease categories. One dataset contains mortality rates for various disease categories at the level of
geographically defined local health authorities, Primary Care Trusts (PCTs). The other dataset presents NHS expenditure by PCT on 23 broad programmes of care (these programmes are listed in Table 3.1). This dataset embraces most items of publicly funded expenditure, including inpatient, outpatient and community care, and pharmaceutical prescriptions. NHS revenue derives almost entirely from national taxation, and access to the system is generally free to the patient. The system is organized geographically, with responsibility for the local administration of the NHS devolved to PCTs.2 PCTs are allocated fixed
annual budgets by the Department of Health, within which they are expected to manage the health care in the locality.
We employ a model that assumes that each PCT receives an annual financial lump sum budget and allocates its resources across the 23 programmes of care to maximize the health benefits associated with that expenditure. Estimation of this model using the expenditure and mortality data facilitates two related studies: first, a study of how changes in the NHS budget impact on expenditure in each care programme; and second, a study of the link between expenditure in a programme and the health outcomes achieved, notably in the form of disease specific mortality rates. The latter also permits the calculation of the cost of an additional life year for individual programmes of expenditure.
The work presented here draws heavily upon on previous studies using these data[60, 62, 63, 65, 66] and innovates in four major ways: (1) we relate expenditure in time periodtto outcomes in periodst,t+1, and
t+2combined3; (2) we present plausible outcome models for a large number of budgeting categories
-previous studies have tended to focus on the four largest care programmes; (3) we present estimates of the cost of a life year for the enlarged number of programmes and, importantly, with the aid of assumptions about the productivity of programmes without a meaningful mortality-based outcome indicator, we extend our individual programme estimates to incorporate expenditure across all
programmes of care; and (4) while the models we present appear well specified according to appropriate statistical tests, we subject our results to a substantial sensitivity analysis.
The next section presents a brief review of the relevant literature upon which the study builds. This is followed by a summary overview of our approach to estimating the cost per life year across the various programmes of care and the results obtained using Programme Budgeting data provided by the
Department of Health. Further details of all aspects of the modelling approach, description of the data, the results we derive and calculation of costs per life year are set out in Appendix B. This section is intended to be supported by the information contained within Appendix B.
2Strictly speaking, these local health authorities are Primary Care Organisations (PCOs) but the vast majority of
these are ‘Trusts’ and we retain this terminology throughout.
3Due to data limitations the cited studies were only able to relate expenditure in periodtto mortality in periodst,