Interprovincial migration, regional development and state policy in China,
1985-2010
Abstract: Internal migration in China occurs as a result of both market forces and government interventions. This paper investigates how indicators of migration have changed over the past quarter of a century using data from successive censuses, with particular attention given to the roles of regional economic development and national policy and the effects of age and education on spatial patterns of migration. The results show a surge in migration throughout the period, an increasing concentration of migration destinations and an improvement of migration efficiency prior to 2000, but a decreased focusing of migration during the first decade of the twenty-first century. Widening regional disparity has been responsible for a sharp increase of migration from the interior to the coast, and different national economic growth poles emerged as major migration destinations at different stages of economic reforms. The analyses of age- and education-specific migration flows indicate that young adults were more mobile and more sensitive than older cohorts to interregional economic differentials, and that educated migrants were more concentrated than less-educated migrants since knowledge-based industries were more concentrated than labour-intensive industries. Our findings suggest that massive eastward migration induced by unbalanced economic development and relaxed migration restrictions still persisted in the 2000s, and that the State's recent efforts to alleviate regional inequalities were far from achieving equilibrium in the migration system.
Key words:Internal migration, Regional development, State policy, China
Introduction
China has faced an unprecedented surge of internal migration over the past three decades, which has resulted in an unparalleled growth of its urban population. In 2013, National Bureau of Statistics (NBS) of China reported a total number of 163.4 million migrant workers who left their hometowns (NBS 2013). It is estimated that Chinese cities will absorb another 240 million migrants by 2025, taking the urban population up to nearly 1 billion people (McKinsey Global Institute 2009). Although a large body of literature has documented and explained the sharp increase of overall migration in China during the period between 1980 and 2000 (Cai and Wang 2003; Fan 2005a, 2005b; Li 2004; Liang, 2001; Shen 1999, 2012), very few studies have been conducted to examine the migration trends and dynamics of the Chinese population systematically since the beginning of 21st century, and further analysis is needed to understand the variation in migration patterns and determinants among different demographic groups.
between migration and unequal regional development has become stronger over time. As economic reforms widened the development gaps across regions, China's coastal regions have experienced an influx of migrant labour from its less-developed interior (Fan 2005a; Jiang and Shen 2010; Ma 1999; Shen 2012). A series of household registration (hukou) reforms since the mid 1980s have increased the autonomy and incentives of rural people to move to urban areas (Chan and Zhang 1999). Shen (2013b) has argued that the relaxation of thehukousystem exerted a strong influence on the initial increase of migration taking place in the 1980s, and that rapid and unbalanced economic development became the main driver of the subsequent migration boom. Despite its decline in importance, the state still exerts some influence on China's internal migration via the migration control regulations and preferential development policies that it administers.
Previous studies on internal migration in western countries have shown that migration is highly selective with regard to age and education, and that migration determinants vary greatly by age and education (Arntz 2010; Clark and Hunter 1992; Dennett and Stillwell 2010; Fotheringham et al. 2004; Newbold 1998; Rogers et al. 1978; Stillwell et al. 2001; Stillwell and Dennett 2012). For instance, young adults are generally more mobile than any other population groups (Rogers et al. 1978). It has been suggested that whilst young working-age migrants are more likely to move for employment opportunities, older migrants are more attracted to locations with favourable amenities (Clark and Hunter 1992). High-educated migration is mainly driven by interregional wage differentials, whereas less-educated migration is determined by the probability of employment (Arntz 2010). Some scholars have also found that, in the case of China, the spatial patterns and determinants are heterogeneous acrosshukoustatus (Chan et al. 1999), gender (Fan 1999; He and Gober 2003) and education (Liu and Shen 2013a, 2013b). Nevertheless, most previous studies of China's migration patterns and determinants have only examined overall aggregate migration due to the unavailability of disaggregated migration data, which may mask substantial variations in propensities and patterns among groups of the population broken down by age and level of education.
This paper investigates how migration volumes, propensities, patterns and efficiencies have changed in China between 1985 and 2010 using data from successive censuses. In particular, we focus on the effects of national policy and regional economic development on the trends and geography of migration and the variations in the spatial patterns of migration by age and education. This paper advances our understanding of China's migration through a detailed examination of the most recent migration trends and a systematic account of migration patterns of particular age/education groups.
The structure of the paper is as follows. The next section provides a historical review of the relationship between state policy, regional development and internal migration. This is followed by a brief account of data used in the analysis. The next two sections use global and local migration indicators to analyse propensities, patterns and efficiencies of overall migration, followed by a detailed analysis of migration patterns and efficiencies of age- and education-specific migration. The paper concludes with a summary of key findings and a discussion of the possible future trends in migration.
State policy, regional development and migration
western regions for the purpose of national defence and the ideology of egalitarianism (Fan 1995; Lin 1999). Less-developed interior provinces benefited from prioritized state investment and revenue transfer. Many state farms and 'Production and Construction Corps' were established in sparsely populated frontier provinces such as Xinjiang in the 1950s and 1960s, absorbing millions of demobilized military personnel and urban youths from the coastal regions. The so-called ‘Third Front Projects’ between the mid 1960s and the late 1970s involved the construction of transportation infrastructures and the development of heavy industries in remote interior locations, forcing labour migration from coastal areas to the interior. In the late 1960s and early 1970s, nearly 17 million of urban youths were sent to the countryside and remote areas by the 'Up to the Mountains and Down to the Countryside' movement. Overall, the above regional policies in the pre-reform (or pre-1978) era led to considerable planned urban-rural migration from the coastal provinces to the provinces of the country’s less-developed interior.
Meanwhile, rural-urban and self-initiated migration was tightly controlled by thehukousystem in which every citizen in China was required to register as a resident of his/her usual place of residence (Chan and Zhang 1999). This system classified people into two groups: agriculturalhukouholders and non-agricultural hukou holders. During the pre-reform era, jobs, food, housing and other daily necessities in urban areas were controlled and assigned by the government, and only those with non-agricultural hukouhad access to these resources and services. Only a small selection of people was eligible to convert theirhukoustatus from agricultural to non-agricultural. Under such circumstances, rural-urban migration was strictly constrained in the pre-reform era (Chan and Zhang 1999).
Dramatic changes have occurred in the regional development policies since the late 1970s (Fan 1995; Lin 1999). Having recognized the low economic efficiency caused by the centrally planned economy, Chinese Communist Party leaders adopted the concept of the 'socialist market economy' to boost economic growth. Under the associated uneven development strategy, some coastal areas were selected to develop first, as they were superior to interior areas in terms of their location advantages, external linkages and industrial bases (Fan 1995). Experimented economic reforms were initially tested in a few selected coastal sites (e.g. four special economic zones in 1979, fourteen open coastal cities in 1984 and open economic areas in 1985), and then were extended to the whole country in 1994.
As a consequence of state preferential policies and massive inflows of foreign investment, the economies of the coastal areas have taken off since the early 1980s (Fan 1995; Fan and Sun 2008). During the thirty years of reforms, three growth poles emerged in different time periods: the Pearl River Delta (PRD, located in Guangdong) in the 1980s, the Yangtze River Delta (YRD straddling Shanghai, Jiangsu and Zhejiang) in the 1990s and the Bohai Economic Rim (BER, centred on Beijing and Tianjin) in the 2000s. In the coastal provinces, fast-growing export-oriented manufacturing sectors along with booming urban construction and service sectors generated expanding demand for cheap labour. By contrast, interior provinces experienced relatively slow economic growth, and their urban labour markets had difficulties in absorbing a large amount of surplus rural labour. It became gradually obvious that the extant strict migration controls were incompatible with the rapid industrialization of the coastal areas.
the mid-1980s. In 1985, the Ministry of Public Security began to issue 'temporary residence permits' and approve rural migrants to work and live in cities. In the late 1980s, some city governments began to grant new forms of urbanhukouto wealthy and highly skilled migrants. Following a pilot scheme carried out in 1997, the State Council launched a nationwide program in 2001 to grant urbanhukouof towns and small cities to eligible rural migrants. More recent reforms of thehukousystem include the unification of agricultural and non-agriculturalhukouin several provinces and the adoption of a rating scheme in granting localhukouto migrants in some large cities (Chan and Buckingham 2008; Zhang 2010). However, only a small number of migrants can get local hukousuccessfully. Thus, population who are away from their places of hukou dramatically increased from 6.1 million in 1982 to 39.6 million in 1990, and to 221.0 million in 2010, and the majority of migrants during the last two decades were temporary migrants without localhukouat the destinations (Liang and Ma 2004; PCO & DPES 2013; Shen 2013b).
Despite a series of reforms, the hukousystem remains barriers for temporary migrants to settle down permanently in destinations, as they are still largely excluded from government-provided welfare and services (Chan and Buckingham 2008; Zhang 2010). Entry barriers to localhukouvary from one city to another, and large and well-developed cities such as Beijing and Shanghai tend to impose more stringent controls over the acquisition of local hukou status (Zhang and Tao 2012). As city governments tend to use local hukouas a means to compete for highly skilled and wealthy migrants and as an instrument for excluding low-skilled and poor migrants from public services in recent years (Fan et al. 2009; Zhang 2010), we would expect that highly skilled migrants are less constrained by the
hukoustatus and thus are more likely to move to and settle down in large cities.
The consistently widening economic gap between the coastal regions and the rest of China has drawn Government attention back to the problem of regional inequality (Fan and Sun 2008). Since the beginning of the 21st century, the Chinese Government has developed and implemented a series of regional development programs such as the 'Western Development Program' (1999), the 'Northeast China Revitalization' (2003) and the 'Rise of Central China' (2004) to facilitate the diffusion of economic development to the central and western regions. These national projects provided various benefits such as capital investment and tax alleviation to the less-developed areas. As a result, although the absolute value of the ‘regional gap’ remains large, economic growth rates have converged to some extent across the eastern, central and western regions since the mid-2000s (Fan and Sun 2008; Li and Wei 2010). The accelerated economic growth in the central and western regions is expected to reduce their labour outflows and generate growing counterstreams from the coastal regions to the interior.
Migration data and study area
from the mid-decade survey can be used to supplement the census data, as China's surveys select sampling units by using a strict random sampling technique and enumerate all people in every selected sampling unit.
The three rounds of census covered the whole population, counting 1130.5 million in 1990, 1242.6 million in 2000 and 1332.8 million in 2010. The 2000 and 2010 Censuses used a short-form (for everyone)/long-form (for 10% samples) sampling strategy, and questions about migration were only present in the long-form questionnaire. The 1995 and 2005 Surveys counted 12.4 million and 16.9 million samples, respectively, which in turn accounted for 1.027% and 1.325% of the total population. Therefore, each migration flow given in the tabulations of the 2000 and 2010 Censuses must be multiplied by 10, and each flow given in the tabulations of the 1995 and 2005 Surveys must be multiplied by 100/1.027 and 100/1.325, respectively. Post-census/survey enumeration has indicated an undercount rate of 0.6% for the 1990 Census, 1.81% for the 2000 Census, 1.72% for the 2005 Survey and 0.12% for the 2010 Census.
In China's census and survey data, a five-year transition framework is used to measure migration. A migrant is defined as a resident who had stayed in his/her usual place of residence for more than six months (for 1995 Survey and subsequent censuses/surveys) or one year (for 1990 Census), who had lived in a different usual place of residence five years ago and who was aged five or older at the time of enumeration. Among the existing censuses/surveys, the 1990 Census and 1995 Survey asked for not only the province but also the county/city where a person lived five years ago, whereas the other two censuses and the 2005 survey only asked about the province. We only consider interprovincial migration in this paper to ensure that migration data from different censuses/surveys are comparable.
It is worthwhile noting that an individual's usual place of residence is not always the same as his/her place of household registration (hukou). For instance, the 2000 Census defines an individual's usual place of residence on the census day as (1) his/her place ofhukouif he/she physically stayed in the place of hukou or had left the place of hukou for less than half a year and (2) his/her place of enumeration if he/she had left the place ofhukoufor more than half a year. Those who had left the place ofhukoufor more than half a year are considered usual residents as well as temporary population of their current places of residence. But only temporary population whose usual place of residence is different from five years ago are considered temporary migrants in our analysis. The size of temporary migrants is smaller than that of temporary population, as the former is defined on the basis of five-year transition and the latter is an accumulated migrant population over time (Liang and Ma 2004; Shen 2013).
However, there are some limitations with our data. First, migrants aged under five years on the date of enumeration and migrants who died during the five years preceding each census/survey are not counted. Second, migrants who returned to the place of origin by the census/survey date are considered as non-migrants. Third, these data fail to capture multiple moves as is the case with transition data capturing the number of migrants rather than the number of moves undertaken. For these reasons, some caution is required since the actual volume of migration may be underestimated in the analysis which follows.
tabulations contained in existing census/survey publications only provide interprovincial migration flow matrices without disaggregating migrants by any demographic and socio-economic characteristics, microdata samples from the 1990 Census and 2005 Survey are used to investigate age-and education-specific migration. We use the 2005 Survey sample instead of the 2010 Census sample, since the latter were still not available when the research was carried out. The microdata samples, which contain a series of demographic variables (e.g. age, gender and education) and migration variables (e.g. place of residence five years ago), are selected randomly from the raw census/survey data by NBS and are released to a few research institutes and scholars for academic purposes.
The 1990 Census microdata sample contains 11,835,947 individual records, accounting for 1.05% of the total population, and the 2005 Survey sample has 2,585,481 individual records, accounting for 0.20% of the total population. We generate age/education-specific migration matrices by aggregating migrants who are in a given age/education group from one province to another. As sampling ratios vary from province to another in the 1990 Census sample and 2005 Survey sample, we adjust the number of migrants of each province to ensure that the sampling ratio of each province is at the same level.
This paper focuses on 30 province-level units in mainland China (Figure 1), including 22 provinces, four autonomous regions (Xinjiang, Inner Mongolia, Ningxia and Guangxi) and four centrally administered municipalities (Beijing, Shanghai, Tianjin and Chongqing). Tibet is not included in the analysis due to the unavailability of migration data in the 1990 Census. For the sake of simplicity, the term 'province' refers to the various kinds of province-level units throughout the paper. It should be noted that Chongqing was separate from Sichuan and upgraded to be a centrally administered municipality in 1997. Thus, there were only 29 provinces in the 1990 Census and 1995 Survey. As shown in Figure 1, these provinces are normally grouped into three economic regions (eastern, central and western) according to their economic performance.
(Insert Figure 1 here)
Changing spatial patterns of interprovincial migration, 1985-2010
China has experienced a dramatic increase in interprovincial migration over the past 25 years (Table 1). The 1990 Census documented a total of 11.0 million interprovincial migrants in the 1985-1990 period, accounting for 1.09 percent of the total population. Surprisingly, the number of migrants declined marginally to 10.3 million in 1990-1995, probably because China's economic reforms had a temporary halt after the 1989 Tiananmen incident (Li 2004). Thereafter, with the reacceleration of economic reform and the gradual relaxation of thehukousystem, the number of migrants increased rapidly by three times to 32.2 million for the 1995-2000 period. It reached 38.7 million and 54.9 million (3.14% and 4.37% of the population aged five and over) in the 2000-2005 and 2005-2010 periods, respectively.
(Insert Table 1 here)
(1)
whereOiis the outflow from provinceiandDiis the corresponding inflow. Whilst high values indicate
that net migration is an efficient mechanism for redistributing population, low values closer to zero denote that migration flows are more closely balanced. Table 1 shows a substantial increase of ME from 27.96 in 1985-1990 to 62.60 in 1995-2000, indicating that net migration became an increasingly efficient mechanism for redistributing the population in the 1990s. The index remained stable around 62.00 in the 2000s, which suggests that migration was consistently efficient during this period. The Aggregate Net Migration Rate (ANMR) is defined as:
(2)
wherePiis the population at risk (measured as the beginning-of-period population who survived and
were enumerated and who were aged five and over on the date of enumeration) in region i, increased consistently from 0.30% in 1985-1990 to 2.73% in 2005-2010, indicating that population redistribution was increasingly affected by net migration balances since the ANMR is the product of the ME and the crude migration intensity divided by 100.
Two further indicators are adopted to gauge the extent of spatial focusing of migration at the national scale (Bell et al. 2002; Plane and Gordon 1997; Rogers and Sweeney 1998). The Index of Migration Inequality (IMI) is defined as:
(3)
where Mij refers to the magnitude of each observed migration flow and M'ij refers to the average
migration flow value. The Coefficient of variation (CV) is calculated simply by dividing the standard deviation related to outflows (or inflows) of a province by the corresponding average flow value (Rogers and Sweeney 1998). A high value of CV indicates a more regionally concentrated distribution of migration flows. An Average Coefficient of Variation (ACV) index for out-migration (or in-migration) is derived from a weighted summation of provincial outflow CVs (or inflow CVs), where the weights reflect the shares of total migration leaving (or entering) the province. A system-wide index is then computed by summing ACV indices for in-migration and out-migration (He and Pooler 2002; Rogers and Sweeney, 1998).
Generally speaking, against the background of the widening regional disparity and the relaxation of migration controls, interprovincial migration has substantially increased over the past quarter of a century. Net migration has become an increasingly effective factor for population redistribution, and migration streams have been increasingly concentrated in a few destinations by 2000. However, this trend has come to a halt since the beginning of century, which reflects the convergence of economic growth in recent years.
Spatial analysis at the provincial scale
We can use a number of local indicators to identify some of the key patterns of migration taking place at the provincial scale and how they have changed over time. The first of these is the net migration balance which illustrates the magnitude of the gain or loss through migration for each province (Figure 2). The second is the migration efficiency, which is computed as the ratio of net migration balance to total in-migration and out-migration (Plane 1984; Stillwell et al. 2000; Stillwell and Garciá Coll 2000) (Figure 3).
(Insert Figure 2 and 3 here)
Over the past two and a half decades, the coastal provinces have increasingly benefited from inflows of migration, and the gap of net migration balances between the coastal regions and the interior has been widening. In 1985-1990, all provinces except Guangdong, Shanghai, Beijing and Sichuan had net migration balances lower than 500 thousand people, and very few provinces exhibited efficiencies over 30%. In 2005-2010, the southern part of the eastern region along with Beijing and Tianjin experienced net gains of more than 1 million migrants and positive efficiencies over 30%. Meanwhile, 11 provinces (10 of which were located in the interior) exhibited net losses of over 1 million, and 13 provinces had efficiency scores lower than -30%.
Guangdong has led the nation in terms of regional net migration balances and efficiency scores throughout the last quarter of a century. In 1995-2000, it received 11.5 million migrants from other provinces, which accounted for around one third of the nation's total in-migration. However, its relative importance as a nationwide migration magnet has decreased since 2000. In 2005-2010, Guangdong absorbed 13.9 million migrants, which accounted for one fourth of total in-migration. As the largest two municipalities in China, Beijing and Shanghai were consistently among the largest population recipients after Guangdong. As the YRD became China's second economic engine, Zhejiang and Jiangsu, which exhibited net losses or marginal net gains of migrants in the 1980s, have joined Guangdong, Beijing and Shanghai as the most prominent migration gainers (with efficiency scores higher than 30%) since the mid-1990s. In the 2005-2010 period, net migration gains over 1.0 million and positive efficiencies over 30% were also found in Fujian, one of the earliest beneficiaries of economic reforms, and Tianjin, one of the two centres of the BER.
agricultural province in China) had negative efficiencies over 30%. In 1990-1995, two provinces near Guangdong (Guizhou and Jiangxi), two provinces near the YRD (Anhui and Henan) and two Northeast provinces struggling with industrial recession (Jilin and Heilongjiang) emerged as leading net population exporters. By the early 2000s, provinces with negative efficiencies over 30% had constituted a continuous zone spanning South Central, Southwest and Northwest China. Interestingly, several provinces in Northwest China such as Xinjiang and Inner Mongolia showed net gains of migration in the second half of 2000s, probably because of their accelerated economic growth driven by mining industries and state investment.
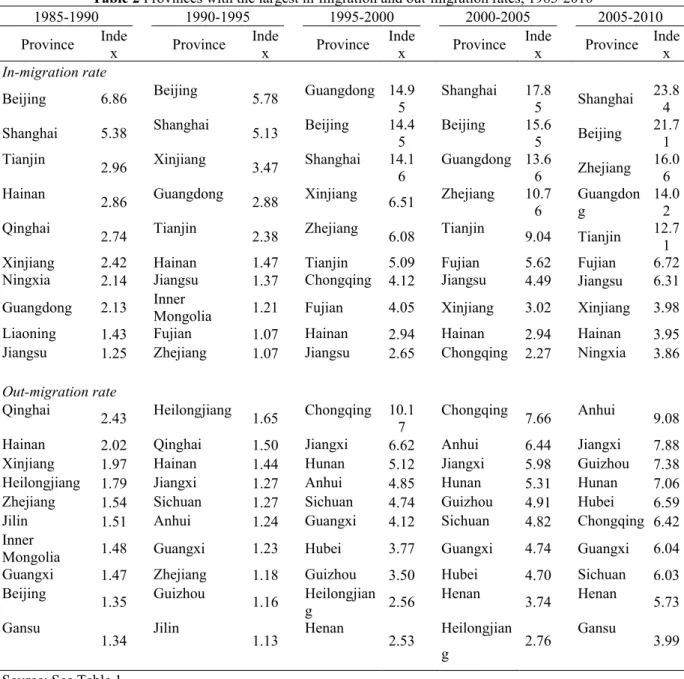
Whilst net migration balances and migration efficiencies tell us something about the net exchange for each province, neither measure allows us to identify which of the components is responsible for determining the gain or loss incurred by each region. Gross in-migration and out-migration, made comparable between provinces by standardization using the population at risk, are used to gauge the importance of inflows vis-à-vis outflows. Table 2 presents the top ten provinces with the largest migration and out-migration rates. In 1985-1990, Beijing and Shanghai experienced the highest in-migration rates (6.86% and 5.38%, respectively), and all other provinces demonstrated in-in-migration rates lower than 3.00%. In 1995-2000, Guangdong (14.95%) overtook Beijing (14.45%) and Shanghai (14.16%), becoming the most attractive destination. In 2005-2010, Shanghai (23.84%), Beijing (21.71%), Zhejiang (16.06%) and Guangdong (14.02%) were among the leading receiving regions of migrants, followed by Tianjin (12.71%), Fujian (6.72%) and Jiangsu (6.31%). Xinjiang was the only inland province to be found among the top ten during the five consecutive periods, as its cotton industries, mineral industries and cross-border trade brought about rapid economic growth (Fan 2005b).
(Insert Table 2 here)
Out-migration rates appear to become increasingly polarized from 1985-1990 to 2005-2010. In 1985-1990, no province had migration rates over 3.00%. In 1995-2000, eight provinces had out-migration rates over 3.00%, and all of them were located in the central and western regions. Chongqing had the largest out-migration rate (10.17%), probably because of the since the early 1990s (Li and Rees 2000). Nine of top ten provinces in 1995-2000 remained in the list in 2005-2010, and all of them displayed higher migration rates in 2005-2010. The only exception was Chongqing, whose out-migration rate decreased as a result of the completion of the resettlement program and its recent economic boom.
counterstreams (e.g. Sichuan-Yunnan, Jiangsu-Anhui, Heilongjiang-Jilin and Heilongjiang-Shandong).
(Insert Figure 4 here)
Migration flows tended to be considerably larger in 1995-2000 and eastward migration flows became more profound than other flows. Migrants were more concentrated in a few destinations. Guangdong exerted a strong pull on people from the whole of the South and Southwest China. As the second nationwide economic growth pole, the YRD absorbed migrants from not only nearby provinces such as Jiangxi and Anhui but also distant provinces such as Sichuan and Guizhou. Xinjiang became a major receiving province for migrants from Sichuan, Henan and Gansu. By contrast, migration streams among provinces of Northeast China became relatively small in size and thus are not shown on the map. All the largest 25 migration flows were accompanied by very small counterflows, which was consistent with the widening divergence in economic growth during the 1990s.
In 2005-2010, 19 out of the largest 25 migration streams in 1995-2000 persisted and gained in magnitude. The major migration streams were toward only six coastal provinces: Guangdong, Fujian, Zhejiang, Shanghai, Jiangsu and Beijing. The YRD attracted many more migrants than in the 1995-2000 period from remote provinces and was able to compete with the PRD as the largest migration destination. Only two regional fields can be identified: South Central-Southwest China centred on Guangdong and South Central-Eastern China centred on Shanghai, Zhejiang and Jiangsu. These two regional fields overlapped in several provinces of the South Central and Southwest China, which rendered the largest out-migration from these provinces.
Changing migration patterns by age groups
(Insert Figure 5 here)
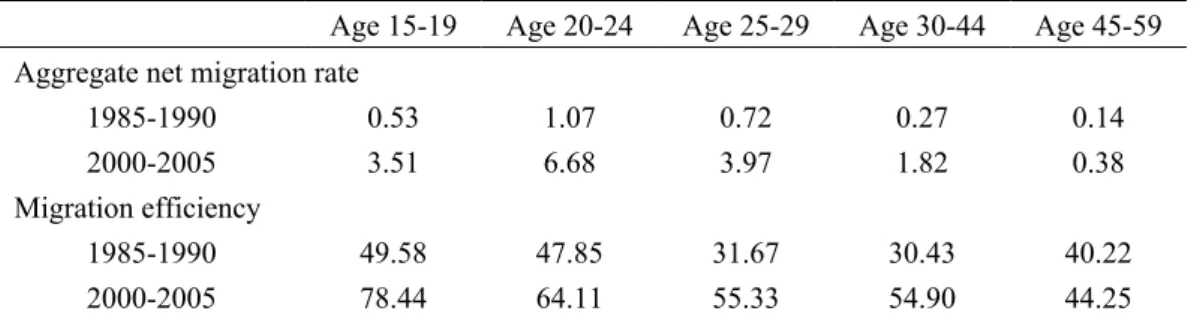
Given that those aged 5-14 (young children) and 60+ (retirees) have relatively low migration rates and are less likely to be influenced by regional economic disparity and national policy, we only took into account migrants at the age of 15 to 59 in the analysis and further disaggregated them into five age groups (15-19, 20-24, 25-29, 30-44, 45-59). Those aged 15-19 are at the stage of leaving home for higher education or a first job; the 20-24 and 25-29 age groups signify young adults who move through the early stages of career and start a young family; ages 30-44 are the family rearing years; age group 45-59 represents middle-aged migrants whose children have gone to work or university. In both periods, aggregate net migration rates are the highest for those aged 20-24, followed by those aged 25-29 and those aged 15-19, and system-wide migration efficiency scores are the highest for those aged 15-19, followed by those aged 20-24 (Table 3). This indicates that population redistribution in China is mainly attributable to net migration of young working-age people.
(Insert Table 3 here)
The five provinces with the largest gains and losses are presented in Table 4. Most of the leading gainers and losers in 1985-1990 were still among top five in 2000-2005. For major population recipients, Guangdong, Shanghai and Beijing had the largest net migration balances across all age groups in both periods. As one of the top five gainers for all age cohorts in 1985-1990, Tianjin dropped out of the top five recipients of young working-age population in 2000-2005. By contrast, Zhejiang and Jiangsu, which were not in the list in 1985-1990, became primary gainers of working-age population in 2000-2005.
(Insert Table 4 here)
For the leading population exporters, Sichuan and Hunan experienced the largest net migration losses in both periods. Some coastal provinces such as Hebei and Zhejiang, which were among the top five losers in 1985-1990, were not shown in the list in 2000-2005. Henan, Anhui and Hubei became the largest donors of labour for all age groups in 2000-2005. Heilongjiang turned out to be the largest exporter of older working-age population, probably because a large number of middle-age laid-off workers emerged from the stagnant heavy-industry-based economies during the period of economic reforms.
(with efficiencies less than -30%) were scattered throughout not only the interior but the coastal regions also. In the 2000-2005 period, the whole southern part of the eastern region along with Beijing and Tianjin experienced positive efficiencies over 30%, whilst negative migration efficiencies spanned across the whole interior except Xinjiang. Migration of those aged 15-19 was more efficient than migration of those aged 20-24 in redistributing the corresponding population.
(Insert Figure 6 here)
Migration efficiencies of mid-working age group (aged 25-44) had a similar spatial pattern in the 1985-1990 period, with four major destinations of Guangdong, Shanghai, Beijing and Tianjin and a few prominent donors such as Sichuan. In 2000-2005, the interior region as a whole still suffered from net losses of migrants aged 25-44. However, some central and western provinces displayed smaller negative efficiency scores, and some north-western provinces (e.g. Inner Mongolia and Qinghai) even displayed net migration gains.
Migration of older working-age group (aged 45-59) was much less efficient than migration of younger cohorts in 2000-2005. Only one eastern province of Tianjin and two central provinces of Henan and Heilongjiang showed positive/negative migration efficiencies scores over 60%. Many inland provinces such as Guangxi and Guizhou, which had very large negative migration efficiencies for young adults, experienced less severe outflows of population aged 45-59.
Changing migration patterns by education groups
In this section, we investigate how net migration balances and migration efficiencies of different educational cohorts change over time, considering only economically active migrants who were aged 22 or above and who had paid work, leave of absence, on-the-job training or who were unemployed at the census/survey date, ruling out students, housewives and retirees, for example.
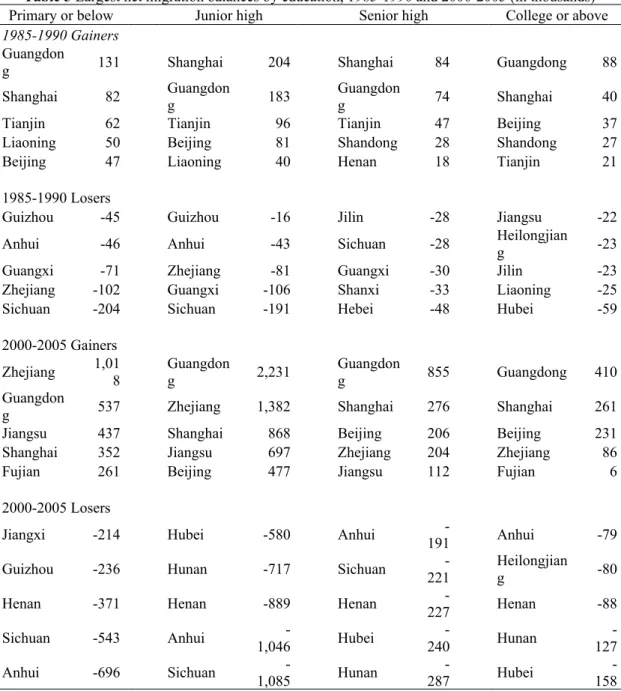
Five provinces with the largest net migration balances are shown in Table 5. In 1985-1990, the provinces of Guangdong, Shanghai, Beijing and Tianjin enjoyed the largest net gains of not only less-educated migrants (senior high secondary education or below) but also highly less-educated migrants (college education or above). In 2000-2005, Guangdong and Shanghai remained the leading destinations for less-skilled and highly-skilled migrants. Beijing was among the top five for migrants with experience of secondary education or above but was not in the list for the least educated cohort. Zhejiang and Jiangsu became the largest gainers of migrants, especially of low-educated migrants. The results reflect the fact that knowledge-based industries were highly concentrated in a few coastal cities such as Beijing, Shanghai and Shenzhen, and that labour-intensive industries developed rapidly throughout the whole coastal region.
(Insert Table 5 here)
secondary education and Hubei suffered the most from the out-migration of the highly educated. In contrast, by 2000-2005, the largest net losses of less-educated people occurred in Anhui, Sichuan and Henan, three of the most populous and agricultural provinces in China, whereas Hubei and Hunan, which had many higher education institutions but relatively few employment opportunities for educated youths compared to their neighbouring coastal provinces, experienced the largest net losses of highly-educated population (Liu and Shen 2013b).
Figure 7 presents the spatial patterns of migration efficiencies by education in both periods of time. In the 1985-1990 period, very few provinces, either in the coastal regions or the interior, experienced migration efficiencies over 30% for all education groups. In 2000-2005, nearly all eastern provinces except Hebei and Shandong displayed migration efficiencies over 30% for those with junior secondary education or below. Some provinces in Northwest China, especially Xinjiang, also displayed net gains of less-educated migrants, probably because of their recent rapid economic growth driven by mining industries and state investment. By contrast, most provinces of South Central, Southwest and Northeast China along with Gansu and Shaanxi had negative efficiencies over 30%.
(Insert Figure 7 here)
In contrast, major recipients of migrants with senior secondary education or above were constrained to only a few coastal provinces (Guangdong, Shanghai, Beijing and Zhejiang) in the 2000-2005 period. Nearly all interior provinces, including Xinjiang and Inner Mongolia displayed net losses of highly educated migrants, and most provinces in the central region showed migration efficiency scores lower than -60%. Overall, it is clear that most coastal provinces became major recipients of less-educated migrants, but only a few of them benefited from the influx of highly less-educated labour. On the other hand, the whole interior increasingly suffered from losses of all types of education groups, and the central region suffered more than the western region from this brain drain.
Conclusion
This paper has provided a systematic analysis of the trends and geography of internal migration in China throughout the past two and a half decades, with a particular focus on the effects of regional economic development and national policy on the growing volumes and the changing patterns of migration, and the variations of the changing migration patterns by age and education. The results have shown a surge in the volume and intensity of migration over the last quarter century. Analyses of migration efficiencies and spatial focusing have indicated an increasing role played by migration in redistributing the population and an increasing concentration of migration destinations by 2000 but a declined concentration of migration flows since the beginning of the 21st century. This reflects the widening economic disparities among provinces during the 1980s and 1990s but the economic convergence across provinces in more recent years (Fan and Sun 2008; Li and Wei 2010).
Beijing and Tianjin, which have experienced rapid economic growth since the inception of the economic reforms, were major migration destinations, whilst most interior provinces suffered from massive out-migration due to their relatively poor economic performance. As the first province to launch economic reforms, Guangdong has consistently led the nation as migration destination, but its relative importance as nationwide migration magnet has declined since 2000. As the second economic engine in China, the YRD (Shanghai-Zhejiang-Jiangsu) enjoyed high economic growth rates in the 1990s and emerged as the second nationwide magnet to migrants. By contrast, the least developed provinces, which were located in South Central, Southwest and Northeast China, bore the brunt of considerable population outflows diffusing from provinces near the coastal regions to remote inland provinces. However, some north-western provinces such as Xinjiang displayed net gains of migration in the second half of 2000s, probably because of their accelerated economic growth driven by mining industries and state investment.
Furthermore, analyses of age-specific migration have shown that migration balances and efficiencies of young working-age population were larger than those of older age cohorts, which indicates that young adults were more mobile and more sensitive than older cohorts to interregional differentials in employment opportunities. Beijing, Shanghai and Guangdong were consistently the largest recipients for all age groups. Zhejiang and Jiangsu overtook Tianjin, becoming the leading recipients of migrants of all age groups in 2000-2005. Whilst nearly the whole interior faced with massive outflows of young labour migrants, a much smaller number of the interior provinces experienced sizable losses of their older working-age population. Analyses of education-specific migration have indicated that most coastal provinces became major recipients of less-educated migrants, but only a few of them including Guangdong, Shanghai and Beijing benefited significantly from regional competition for educated labour. In contrast, the central and western regions as a whole increasingly suffered from losses of its highly-educated and less-educated labour, and the central region suffered more than the western region from the brain drain. The spatial patterns of age- and education-specific migration mirror the geography of different forms of industries in China; whilst knowledge-based and advanced service industries, which attracted educated migrants from elsewhere, were highly concentrated in a few large cities such as Beijing and Shanghai, labour-intensive industries favouring young and low-educated migrant workers spread across the whole coastal region.
References
Arntz, M. (2010). What attracts human capital? Understanding the skill composition of interregional job matches in Germany.Regional Studies, 44(4), 423 - 441.
Bell, M., Blake, M., Boyle, P., Duke-Williams, O., Rees, P., Stillwell, J., et al. (2002). Cross-national comparison of internal migration: Issues and measures.Journal of the Royal Statistical Society. Series A (Statistics in Society), 165(3), 435-464.
Cai, F., & Wang, D. (2003). Migration as marketization: What can we learn from China’s 2000 census data?The China Review, 3(2), 73-93.
Chan, K. W. (2010). A China paradox: Migrant labor shortage amidst rural labor supply abundance.
Eurasian Geography and Economics, 51(4), 513-530.
Chan, K. W., & Buckingham, W. (2008). Is China abolishing the hukou system?The China Quarterly, 195, 582-606.
Chan, K. W., Liu, T., & Yang, Y. (1999). Hukou and non-hukou migrations in China: Comparisons and contrasts.International Journal of Population Geography, 5(6), 425-448.
Chan, K. W., & Zhang, L. (1999). The hukou system and rural-urban migration in China: Processes and changes.The China Quarterly, 160,818-855.
National Bureau of Statistics of China (NBS). (2013). Statistical communiqué of the People's Republic of China on the 2012 national economic and social development. http://www.stats.gov.cn/english/pressrelease/t20130222_402874590.htm. Accessed 25 August 2013. Clark, D. E., & Hunter, W. J. (1992). The impact of economic opportunity, amenities and fiscal factors on age-specific migration rates.Journal of Regional Science, 32(3), 349-365.
Dennett, A., & Stillwell, J. (2010). Internal migration in Britain, 2000-01, examined through an area classification framework.Population Space and Place, 16(6), 517-538.
Fan, C. C. (1995). Of belts and ladders: State policy and uneven regional development in post-mao China.Annals of the Association of American Geographers, 85(3), 421 - 449.
Fan, C. C. (1999). Migration in a socialist transitional economy: Heterogeneity, socioeconomic and spatial characteristics of migrants in China and Guangdong province.International Migration Review, 33(4), 954-987.
Fan, C. C. (2005a). Interprovincial migration, population redistribution, and regional development in China: 1990 and 2000 census comparisons.Professional Geographer, 57(2), 295-311.
Fan, C. C. (2005b). Modeling interprovincial migration in China, 1985-2000.Eurasian Geography and Economics, 46(3), 165-184.
Fan, C. C., & Sun, M. (2008). Regional inequality in China, 1978-2006. Eurasian Geography and Economics, 49(1), 1-18.
Fan, C. V., Hall, P. V., & Wall, G. (2009). Migration, hukou status, and labor-market segmentation: The case of high-tech development in Dalian.Environment and Planning A, 41(7), 1647-1666.
Fotheringham, A. S., Rees, P., Champion, T., Kalogirou, S., & Tremayne, A. R. (2004). The development of a migration model for England and Wales: Overview and modelling out-migration.
Environment and Planning A, 36(9), 1633-1672.
Greenwood, M. J. (1975). Research on internal migration in the United States: A survey. Journal of Economic Literature, 13(2), 397-433.
He, C., & Gober, P. (2003). Gendering interprovincial migration in China. International Migration Review, 37(4), 1220-1251.
He, J., & Pooler, J. (2002). The regional concentration of China's interprovincial migration flows, 1982–90.Population and Environment, 24(2), 149-182.
27(5), 307-314.
Leadership Team Office of State Council for National One Percent Population Sampling Survey & Department of Population and Employment Statistics of NBS (LTO & DPES). (2007).Tabulations of the 2005 national 1% population sample survey. Beijing: China Statistics Press.
Li, H., & Rees, P. (2000). Population displacement in the Three Gorges reservoir area of the Yangtze River, central China: relocation policies and migrant views. International Journal of Population Geography, 6(6), 439-462.
Li, S. (2004). Population migration and urbanization in China: A comparative analysis of the 1990 population census and the 1995 national one percent sample population survey. International Migration Review, 38(2), 655-685.
Li, Y., & Wei, Y. H. D. (2010). The spatial-temporal hierarchy of regional inequality of China.Applied Geography, 30(3), 303-316.
Liang, Z. (2001). The age of migration in China.Population and Development Review, 27(3), 499-524. Liang, Z., & Ma, Z. D. (2004). China's floating population: New evidence from the 2000 census.
Population and Development Review, 30(3), 467-488.
Lin, G. C. S. (1999). State policy and spatial restructuring in post-reform China, 1978–95.
International Journal of Urban and Regional Research, 23(4), 670-696.
Liu, Y., & Shen, J. (2013a). Jobs or amenities? Location choices of interprovincial skilled migrants in China, 2000–2005.Population, Space and Place, doi:10.1002/psp.1803
Liu, Y., & Shen, J. (2013b). Spatial patterns and determinants of skilled internal migration in China, 2000–2005.Papers in Regional Science, doi:10.1111/pirs.12014
Ma, Z. (1999). Temporary migration and regional development in China.Environment and Planning A, 31(5), 783-802.
McKinsey Global Institute (2009). Preparing for China's Urban Billion. Report of McKinsey Global Institute. http://www.mckinsey.com/insights/urbanization/preparing_for_urban_billion_in_china. Accessed 25 August 2013.
Newbold, K. B. (1998). Outmigration from California: The role of migrant selectivity. Geographical Analysis, 30(2), 138-152.
Plane, D. A. (1984). A systemic demographic efficiency analysis of U.S. interstate population exchange, 1935-1980.Economic Geography, 60(4), 294-312.
Plane, D. A., & Gordon, F. M. (1997). Measuring spatial focusing in a migration system.Demography, 34(2), 251-262.
Population Census Office under the State Council & Department of Population, Social, Science and Technology Statistics of NBS (PCO & DPSSTS). (2002).Tabulations on the 2000 population census of the People's Republic of China, Vol. 3. Beijing: China Statistics Press.
Population Census Office under the State Council & Department of Population and Employment Statistics of NBS (PCO & DPES). (2012).Tabulations on the 2010 population census of the People's Republic of China, Vol. 3. Beijing: China Statistics Press.
Population Census Office under the State Council & Department of Population Statistics of NBS (PCO & DPS). (1993).Tabulations on the 1990 population census of the People's Republic of China, Vol. 4. Beijing: China Statistics Press.
Rees, P., Bell, M., Duke-Williams, O., & Blake, M. (2000). Problems and solutions in the measurement of migration intensities: Australia and Britain compared.Population Studies, 54(2),207-222.
Rogers, A., Raquillet, R., & Castro, L. J. (1978). Model migration schedules and their applications.
Environment and Planning A, 10(5), 475-502.
Shen, J. (1999). Modelling regional migration in China: Estimation and decomposition.Environment and Planning A, 31(7), 1223-1238.
Shen, J. (2012). Changing patterns and determinants of interprovincial migration in China 1985–2000.
Population, Space and Place, 18(3), 384-402.
Shen, J. (2013a). Explaining interregional migration changes in China, 1985–2000, Using a decomposition approach.Regional Studies, doi:10.1080/00343404.2013.812783.
Shen, J. (2013b). Increasing internal migration in China from 1985 to 2005: Institutional versus economic drivers.Habitat International, 39(1), 1-7.
Stillwell, J., Bell, M., Blake, M., Duke-Williams, O., & Rees, P. (2000). Net migration and migration effectiveness: A comparison between Australia and the United Kingdom, 1976–96 Part 1: Total migration patterns.Journal of Population Research, 17(1), 17-38.
Stillwell, J., Bell, M., Blake, M., Duke-Williams, O., & Rees, P. (2001). Net migration and migration effectiveness: A comparison between Australia and the United Kingdom, 1976–96 Part 2: Age-related migration patterns.Journal of Population Research, 18(1), 19-39.
Stillwell, J., & Garciá Coll, A. (2000). Inter-provincial migration of the Spanish workforce in 1988 and 1994.Regional Studies, 34(7), 693 - 711.
Stillwell, J., & Dennett, A. (2012). A comparison of internal migration by ethnic group in Great Britain using a district classification.Journal of Population Research, 29(1), 23-44.
Office of National Population Sampling Survey (ONPSS). (1997).Tabulations of the 1995 national 1% population sample survey. Beijing: China Statistics Press.
Van Ham, M., & Hooimeijer, P. (2009). Regional differences in spatial flexibility: Long commutes and job related migration intentions in the Netherlands.Applied Spatial Analysis and Policy, 2(2), 129-146. Xiang, B. (2007). How far are the left-behind left behind? A preliminary study in rural China.
Population, Space and Place, 13(3), 179-191.
Zhang, L. (2010). The right to the entrepreneurial city in reform-era China.The China Review, 10(1),
129-156.
Fig. 1The provinces and regions of China
Fig. 2Net migration balances by province, 1985-2010
Source: PCO & DPS, 1993; ONPSS, 1997; PCO & DPSSTS, 2002; LTO & DPES, 2007; PCO & DPES, 2012
Fig. 3Migration efficiency by province, 1985-2010 Source: See Figure 2
Fig. 4The 25 largest interprovincial migration flows
Source: PCO & DPS (1993); PCO & DPSSTS (2002); PCO & DPES (2012)
Fig. 5Interprovincial migration age schedules, 1985-1990 and 2000-2005 Source: 1990 Census microdata, 2005 Survey microdata
Table 1System-wide indicators of internal migration in China, 1985-2010
1985-1990 1990-1995 1995-2000 2000-2005 2005-2010
Volume (million) 11.01 10.31 32.18 38.65 54.91
(31.81) (38.45) (54.42)
Crude migration probability 1.09 0.93 2.80 3.14 4.37
(2.77) (3.12) (4.33) Migration efficiency index 27.96 43.84 62.60 61.74 62.47
Aggregate net migration rate 0.30 0.41 1.75 1.94 2.73
Index of migration inequality 0.51 0.56 0.63 0.66 0.62
System-wide ACV index 2.94 3.41 3.97 3.85 3.56
ACV index for in-migration 1.49 1.59 1.60 1.55 1.45
ACV index for out-migration 1.46 1.81 2.37 2.30 2.11
Source: PCO & DPS, 1993; ONPSS, 1997; PCO & DPSSTS, 2002; LTO & DPES, 2007; PCO & DPES, 2012 Notes: (i) Tibet is omitted. (ii) Parentheses show the results conditional on combining Chongqing with Sichuan (iii) ACV is the Average Coefficient of Variation.
Table 2Provinces with the largest in-migration and out-migration rates, 1985-2010
1985-1990 1990-1995 1995-2000 2000-2005 2005-2010
Province Index Province Inde
x Province Index Province Index Province Index
In-migration rate
Beijing 6.86 Beijing 5.78 Guangdong 14.95 Shanghai 17.85 Shanghai 23.84 Shanghai 5.38 Shanghai 5.13 Beijing 14.45 Beijing 15.65 Beijing 21.71 Tianjin 2.96 Xinjiang 3.47 Shanghai 14.1
6 Guangdong 13.66 Zhejiang 16.06 Hainan 2.86 Guangdong 2.88 Xinjiang 6.51 Zhejiang 10.7
6 Guangdong 14.02 Qinghai 2.74 Tianjin 2.38 Zhejiang 6.08 Tianjin 9.04 Tianjin 12.7 1 Xinjiang 2.42 Hainan 1.47 Tianjin 5.09 Fujian 5.62 Fujian 6.72 Ningxia 2.14 Jiangsu 1.37 Chongqing 4.12 Jiangsu 4.49 Jiangsu 6.31 Guangdong 2.13 InnerMongolia 1.21 Fujian 4.05 Xinjiang 3.02 Xinjiang 3.98 Liaoning 1.43 Fujian 1.07 Hainan 2.94 Hainan 2.94 Hainan 3.95 Jiangsu 1.25 Zhejiang 1.07 Jiangsu 2.65 Chongqing 2.27 Ningxia 3.86
Out-migration rate
Qinghai 2.43 Heilongjiang 1.65 Chongqing 10.1
7 Chongqing 7.66 Anhui 9.08 Hainan 2.02 Qinghai 1.50 Jiangxi 6.62 Anhui 6.44 Jiangxi 7.88 Xinjiang 1.97 Hainan 1.44 Hunan 5.12 Jiangxi 5.98 Guizhou 7.38 Heilongjiang 1.79 Jiangxi 1.27 Anhui 4.85 Hunan 5.31 Hunan 7.06 Zhejiang 1.54 Sichuan 1.27 Sichuan 4.74 Guizhou 4.91 Hubei 6.59 Jilin 1.51 Anhui 1.24 Guangxi 4.12 Sichuan 4.82 Chongqing 6.42 Inner
Mongolia 1.48 Guangxi 1.23 Hubei 3.77 Guangxi 4.74 Guangxi 6.04 Guangxi 1.47 Zhejiang 1.18 Guizhou 3.50 Hubei 4.70 Sichuan 6.03 Beijing 1.35 Guizhou 1.16 Heilongjian
g 2.56 Henan 3.74 Henan 5.73
Gansu
1.34 Jilin 1.13 Henan 2.53 Heilongjian
g 2.76
Gansu
3.99
Table 3Aggregate net migration and migration efficiency by age group, 1985-1990 and 2000-2005 Age 15-19 Age 20-24 Age 25-29 Age 30-44 Age 45-59 Aggregate net migration rate
1985-1990 0.53 1.07 0.72 0.27 0.14
2000-2005 3.51 6.68 3.97 1.82 0.38
Migration efficiency
1985-1990 49.58 47.85 31.67 30.43 40.22
2000-2005 78.44 64.11 55.33 54.90 44.25
Source: 1990 Census microdata, 2005 Survey microdata
Table 4Largest net migration balances by age, 1985-1990 and 2000-2005 (in thousands)
Age 15-19 Age 20-24 Age 25-29 Age 30-44 Age 45-59
1985-1990 Gainers
Guangdon
g 226 Guangdong 334 Guangdong 153 Shanghai 150 Shanghai 57
Tianjin 134 Tianjin 280 Shanghai 114 Guangdong 130 Guangdong 55
Shanghai 108 Shanghai 266 Beijing 103 Tianjin 70 Shandong 29
Beijing 107 Beijing 229 Tianjin 65 Beijing 61 Beijing 29
Liaoning 32 Xinjiang 70 Xinjiang 42 Shandong 53 Tianjin 29
1985-1990 Losers
Guangxi -50 Hebei -87 Hunan -35 Guangxi -49 Jilin -21
Zhejiang -69 Guizhou -87 Hebei -53 Heilongjiang -58 Anhui -23
Hebei -70 Hunan -140 Zhejiang -71 Hebei -80 Heilongjiang -27
Hunan -103 Guangxi -162 Guangxi -80 Zhejiang -87 Hebei -30
Sichuan -197 Sichuan -341 Sichuan -144 Sichuan -137 Sichuan -31
2000-2005 Gainers
Guangdon
g 1,562 Guangdong 2,162 Guangdong 1,147 Guangdong 1,765 Guangdong 205 Zhejiang 697 Zhejiang 825 Zhejiang 715 Zhejiang 1,516 Shanghai 174 Shanghai 380 Shanghai 705 Shanghai 506 Shanghai 896 Zhejiang 142
Jiangsu 371 Beijing 586 Beijing 363 Jiangsu 670 Beijing 113
Fujian 343 Jiangsu 467 Jiangsu 344 Beijing 501 Tianjin 98
2000-2005 Losers
Hubei -385 Guangxi -461 Hubei -310 Hubei -525 Hubei -74
Sichuan -389 Hubei -492 Hunan -338 Hunan -696 Henan 132
-Hunan -398 Hunan -614 Henan -427 Henan -810 Anhui 142
-Anhui -579 Henan -682 Sichuan -431 Anhui 1,165- Sichuan 150
-Henan -604 Anhui -692 Anhui -532 Sichuan
Table 5Largest net migration balances by education, 1985-1990 and 2000-2005 (in thousands) Primary or below Junior high Senior high College or above
1985-1990 Gainers
Guangdon
g 131 Shanghai 204 Shanghai 84 Guangdong 88
Shanghai 82 Guangdong 183 Guangdong 74 Shanghai 40
Tianjin 62 Tianjin 96 Tianjin 47 Beijing 37
Liaoning 50 Beijing 81 Shandong 28 Shandong 27
Beijing 47 Liaoning 40 Henan 18 Tianjin 21
1985-1990 Losers
Guizhou -45 Guizhou -16 Jilin -28 Jiangsu -22
Anhui -46 Anhui -43 Sichuan -28 Heilongjiang -23
Guangxi -71 Zhejiang -81 Guangxi -30 Jilin -23
Zhejiang -102 Guangxi -106 Shanxi -33 Liaoning -25
Sichuan -204 Sichuan -191 Hebei -48 Hubei -59
2000-2005 Gainers
Zhejiang 1,018 Guangdong 2,231 Guangdong 855 Guangdong 410 Guangdon
g 537 Zhejiang 1,382 Shanghai 276 Shanghai 261
Jiangsu 437 Shanghai 868 Beijing 206 Beijing 231
Shanghai 352 Jiangsu 697 Zhejiang 204 Zhejiang 86
Fujian 261 Beijing 477 Jiangsu 112 Fujian 6
2000-2005 Losers
Jiangxi -214 Hubei -580 Anhui 191- Anhui -79
Guizhou -236 Hunan -717 Sichuan 221- Heilongjiang -80
Henan -371 Henan -889 Henan 227- Henan -88
Sichuan -543 Anhui 1,046- Hubei 240- Hunan 127
-Anhui -696 Sichuan