R E S E A R C H A R T I C L E
Open Access
Modeling hospital infrastructure by optimizing
quality, accessibility and efficiency via a mixed
integer programming model
David Ikkersheim
1,2*, Marit Tanke
1,2, Gwendy van Schooten
1,2, Niels de Bresser
1,3and Hein Fleuren
3Abstract
Background:The majority of curative health care is organized in hospitals. As in most other countries, the current 94 hospital locations in the Netherlands offer almost all treatments, ranging from rather basic to very complex care. Recent studies show that concentration of care can lead to substantial quality improvements for complex
conditions and that dispersion of care for chronic conditions may increase quality of care. In previous studies on allocation of hospital infrastructure, the allocation is usually only based on accessibility and/or efficiency of hospital care. In this paper, we explore the possibilities to include a quality function in the objective function, to give global directions to how the‘optimal’hospital infrastructure would be in the Dutch context.
Methods:To create optimal societal value we have used a mathematical mixed integer programming (MIP) model that balances quality, efficiency and accessibility of care for 30 ICD-9 diagnosis groups. Typical aspects that are taken into account are the volume-outcome relationship, the maximum accepted travel times for diagnosis groups that may need emergency treatment and the minimum use of facilities.
Results:The optimal number of hospital locations per diagnosis group varies from 12-14 locations for diagnosis groups which have a strong volume-outcome relationship, such as neoplasms, to 150 locations for chronic diagnosis groups such as diabetes and chronic obstructive pulmonary disease (COPD).
Conclusions:In conclusion, our study shows a new approach for allocating hospital infrastructure over a country or certain region that includes quality of care in relation to volume per provider that can be used in various countries or regions. In addition, our model shows that within the Dutch context chronic care may be too concentrated and complex and/or acute care may be too dispersed. Our approach can relatively easily be adopted towards other countries or regions and is very suitable to perform a‘what-if’analysis.
Background
In the Netherlands, just as in most other countries, the majority of curative health care is organized in hospitals. Currently, there are 94 hospital locations in the Netherlands, almost all of them offering the whole range of treatments, varying from placing ear tubes to cancer treatment and long-term support of patients with COPD.
Recent studies show that quality of care can be im-proved by concentration of care [1,2]. Within the concept of concentration, hospitals and physicians focus on the treatment of a selection of specific conditions, treating a
substantial volume of patients annually. Thereby they achieve superior outcomes in terms of quality of care [1,2]. In the literature this so called‘volume-outcome’ as-sociation is widely established; hospitals that treat a larger volume of patients annually achieve better outcomes for conditions ranging from AIDS to cholecystectomies [3]. Moreover, increased hospital specialization - meaning a hospital that only treats certain diagnosis such as cancer or cardiovascular diseases - is associated with improved patient outcomes after adjusting for hospital procedural volume [4,5].
Concentration and specialization may also increase the efficiency of hospitals. One could expect efficiency gains due to a higher quality of care as costly complications may be avoided in centers that have superior expertise
* Correspondence:[email protected] 1
KPMG Plexus, Breukelen, The Netherlands 2FALW, VU University, Amsterdam, The Netherlands
Full list of author information is available at the end of the article
[6]. Economies of scale within a certain (group of ) con-dition(s) can lead to additional cost reductions, i.e. by better procurement rates and higher turnover rates of tools and capacity usage [7,8]. On the other hand a de-crease in the number of providers may result in a lower level of competition possibly leading to higher prices of care [9].
In contrast to the gain in quality of care and efficiency, concentration of care may lead to decreased accessibility of care as the distance to the nearest hospital location may increase. Therefore gains in quality of concentration of care should outweigh the heightened travel costs for patients. Studies show that a significant part of patients are willing to travel distances for higher quality of care [10,11], a better patient experience [12] or shorter waiting times [13,14]. Nonetheless, studies also show that patient preferences differ and that some patients (up to 40%) are preferring hospital care closely to their home rather than a short waiting time further away, partly caused by previous satisfactory experiences in the nearest located hospital [13].
Considering that more complex conditions have a more profound volume-outcome association and that for other, mostly chronic diseases, care should be provided as close to home as possible. Therefore, the ‘ideal’ hos-pital landscape would accommodate the quality versus accessibility trade off with a different number of pro-viders per (group of ) condition(s). In addition, to ensure an efficient delivery of care these providers should be large enough to operate efficiently.
To create optimal society value in our health care sys-tem, one should therefore optimize three dimensions: quality, efficiency and accessibility of care [15]. In previ-ous studies on allocation hospital infrastructure, the allo-cation is usually based on only one or two of these dimensions: accessibility and/or efficiency of hospital care [16-18]. In this paper, we explore the possibilities to include a quality function in the objective of a MIP model, to give global directions how the ‘optimal’ hos-pital infrastructure would be in the Dutch context. To our knowledge, this is the first attempt to include the re-cent literature regarding volume-outcome relationship together with accessibility and efficiency characteristics to model a new optimal hospital infrastructure from a societal perspective.
Methods
Mathematical models are very suitable to make complex trade-offs. Location models are studied for a long time in science and industry. An excellent overview of the various forms of location models can be found in Revelle et al. and Melo et al.; they describe the use of location models in supply chain management [19,20]. In our study we use a mixed integer linear (MIP) programming
approach in an AIMMS software environment with the CPLEX solver to solve the Dutch hospital infrastructure problem [21]. Objective, relations and constraints will be explained in the following sections.
Models are very suitable, not only to find the optimal al-location of infrastructure, but also to perform sensitivity and‘what-if’analysis. This should be kept in mind since this is an explorative study in which estimations of the volume-outcome relations based on expert opinions are used.
Conditions and hospital locations
To create the ‘ideal’ hospital landscape from the trade-off between quality, accessibility and operational effi-ciency, we first identified the possible hospital locations in the Netherlands and conditions that should be allo-cated. In the new hospital landscape, 150 possible hos-pital locations were defined. This number was chosen taken into account that: 1) There are enough locations to provide health care close to home (the average travel time currently with 95 hospital locations is 14.9 minutes to the closest located hospital [22] 2) the number of pos-sible locations would not become a serious constraint in the model and 3) the model does not become too com-plex. From the total of 150 locations, 88 of these loca-tions are based on the 3-digit distinct zip code of the 95 current hospitals in the Netherlands. The other locations are chosen in such a way that the total amount of 150 locations are optimally distributed in the Netherlands. This means that the sum of the individual driving times for all inhabitants is as small as possible. The density of the population per zip code area was used to calculate the optimal location of the hospitals [23].
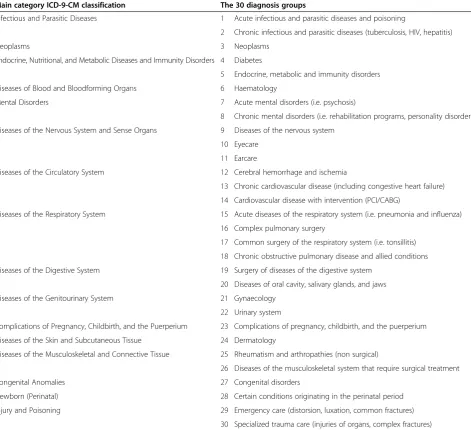
Allocated diagnosis groups based on ICD-9-CM codes
The total health care delivered in hospitals in the Netherlands was assigned to one of 30 diagnosis groups. These diagnosis groups are slightly modified from the diagnosis groups of the International Classification of Diseases, Ninth Revision, Clinical Modification (ICD-9-CM, WHO), in such a way that the groups are as homo-geneous as possible with regard to:
the volume-outcome relationship.
The diagnosis group ‘Signs, Symptoms, and Ill-defined Conditions’, was excluded because of a lack of informa-tion. The ICD-9-CM codes and corresponding 30 diag-nosis groups are described in Table 1. We formulated one obligatory relationship between ICD-9 groups in the model: between gynecology and pediatric care (groups 21 and 23, see Table 1). In the current model, all other diag-nosis groups can operate on their own or be combined with other diagnosis groups if the efficiency constraint is not met. Details of the criteria of the volume-outcome
Ikkersheimet al. BMC Health Services Research2013,13:220 Page 2 of 9
relationship, the use of resources, and the accessibility are described in the paragraphs below.
Data: volume-outcome relationship
In this study we estimated per diagnosis group the volume-outcome relationship compared to the diagnosis group neoplasms. This diagnosis group was chosen as a reference group, because the volume-outcome relation-ship is well studied for the condition breast cancer in the diagnosis group neoplasms and the angle of incli-nation of outcomes expressed as Quality Adjusted Life-time Years (QALY’s) per volume step has been established in previous studies [22,24-31]. The study shows, in short, that on average 0.5 QALY for an individual may be gained per breast cancer treatment, when breast cancer care is concentrated from the current 94 hospitals (that each
treat 138 cases per year) to 15 specialized breast cancer centers (that each treat 866 cases per year) centers. With this concentration of care the current Dutch 5-year sur-vival for breast cancer could improve from 85% to 90% according to international literature and best practicesa [22,24-32].
[image:3.595.62.534.102.532.2]Although numerous studies have documented a volume-outcome relationship, literature to quantify the strength of this relationship is not available for all diag-nosis groups. It is presumed that the association depends on the level of complexity of the intervention and the level of co-operation between different specialties [31,33]. Therefore based on the complexity of the diagnosis groups we divided the diagnosis groups in four categories and (somewhat arbitrarily) gauged volume-outcome relationship in QALYs relative to the diagnosis group neoplasms: high Table 1 ICD-9 classification and diagnosis groups used in the present study
Main category ICD-9-CM classification The 30 diagnosis groups
Infectious and Parasitic Diseases 1 Acute infectious and parasitic diseases and poisoning
2 Chronic infectious and parasitic diseases (tuberculosis, HIV, hepatitis)
Neoplasms 3 Neoplasms
Endocrine, Nutritional, and Metabolic Diseases and Immunity Disorders 4 Diabetes
5 Endocrine, metabolic and immunity disorders
Diseases of Blood and Bloodforming Organs 6 Haematology
Mental Disorders 7 Acute mental disorders (i.e. psychosis)
8 Chronic mental disorders (i.e. rehabilitation programs, personality disorders)
Diseases of the Nervous System and Sense Organs 9 Diseases of the nervous system
10 Eyecare
11 Earcare
Diseases of the Circulatory System 12 Cerebral hemorrhage and ischemia
13 Chronic cardiovascular disease (including congestive heart failure)
14 Cardiovascular disease with intervention (PCI/CABG)
Diseases of the Respiratory System 15 Acute diseases of the respiratory system (i.e. pneumonia and influenza)
16 Complex pulmonary surgery
17 Common surgery of the respiratory system (i.e. tonsillitis)
18 Chronic obstructive pulmonary disease and allied conditions
Diseases of the Digestive System 19 Surgery of diseases of the digestive system
20 Diseases of oral cavity, salivary glands, and jaws
Diseases of the Genitourinary System 21 Gynaecology
22 Urinary system
Complications of Pregnancy, Childbirth, and the Puerperium 23 Complications of pregnancy, childbirth, and the puerperium
Diseases of the Skin and Subcutaneous Tissue 24 Dermatology
Diseases of the Musculoskeletal and Connective Tissue 25 Rheumatism and arthropathies (non surgical)
26 Diseases of the musculoskeletal system that require surgical treatment
Congenital Anomalies 27 Congenital disorders
Newborn (Perinatal) 28 Certain conditions originating in the perinatal period
Injury and Poisoning 29 Emergency care (distorsion, luxation, common fractures)
(the same relationship as the group neoplasms), inter-mediate (50% of neoplasms), low (5% of neoplasms), or no volume-outcome relationship.
The categories high, intermediate and low are established using the following criteria:
High: multi medical specialty treatment, low volume, and high risk of complication, according to previous reports e.g. [34] and current volume norms per condition of professionals associations [35].
Intermediate: a high complication risk but a single medical specialty approach [34].
Low: groups with a high volume and a low risk of complication [34].
Since there is consensus in the literature that it is desir-able that healthcare for chronic conditions is within close reach, chronic care was not included in this classification. As it requires frequent visits for relative low complex care, often accompanied with lifestyle change, chronic care was labeled as having no volume-outcome relationship [34].
After estimating the volume-outcome association per diagnosis group we calculated the angle of inclination of quality of care (expressed in QALYs) per diagnosis group, by simulating a concentration of care per diagno-sis group from the current 94 locations to a virtual sin-gle centre (for the model formulation see below).
Data: accessibility
For acute diagnosis groups, the travel time is in the Netherlands by law maximized on 45 minutes. Therefore we also used this as the maximum travel time in the acute nosis groups [36]. The maximum travel time for other diag-nosis groups were set at 120 minutes. This amount is derived from Discrete Choice Experiments in which patients state they are willing to travel up to 230 kilometers (approxi-mately 2 hours by car) for better quality of care [37].
Data: use of resources
The average length of stay in the hospital is based on the national medical registry [38]. For the average lengths of stay in an Intensive Care Unit and the average duration of an operation we used the KPMG Plexus benchmark analysis of 70 hospitals in the Netherlands [39]. Use of resources, such as length of stay in the hospital, ICU admittance and use of operating rooms (OR). The minimum utilizations were estimated using benchmarking results from Dutch hospitals. For an OR the minimum utilization was estimated as being 65% of the total time available for operations (48 weeks a year, 5 days a week, 8 hours a day). For an ICU the minimum was estimated as having 6 beds occupied during 365 days a year. For a ward it was estimated as 80% utilization of 12 beds during 365 days a year.
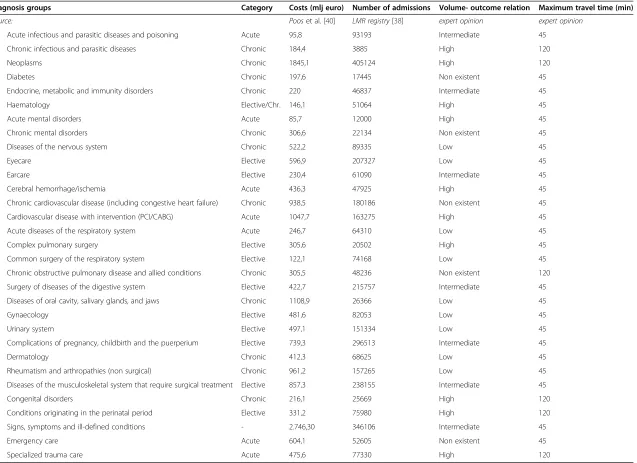
Data: costs per diagnosis group
The total costs per diagnosis group are estimated by the National Institute for Public Health and the Environment Cost of Illness in 2005 [40]. The abovementioned charac-teristics per diagnosis group are summarized in Table 2.
The MIP model
The problem is formulated using a mixed integer linear programming model, whereby accessibility and quality are translated to euros. This will be further explained in this section. We solve the instances by using the CPLEX solver within the AIMMS development environment.
Objective function:
max
∑d
ðQualityd−TraveldÞConstraints:
Qualityd¼EQ NPdðadNLdþbdÞfor all d; Traveld¼2ET NVd
∑
p;qNP D
p;dYp;q;dTTp;qfor all d; Xp¼1
∑
p Yp;q;d≤Zq;dM for all q;d;
∑
d Zq;d≤XqM for all q;
∑
q Zq;d¼NLdfor all d; Yp;q;dTTp;q≤maxtdfor all p;q;d;
∑
p;dNP D
p;dYp;q;dUf;d≥minufXpfor all f;p:
See below in Table 3 for the description of the indices, parameters and decision variables.
Model formulation
The objective of our model is the trade-off between quality and accessibility of care (traveling time) in con-centration and specialization of hospital care. This leads to the following objective function:
max
∑
dðQualityd−TraveldÞ
Quality: volume-outcome relationship
It is assumed that the volume-outcome relationships are linear functions (ax + b) depending on the number of lo-cations (NLd) treating a diagnosis group d (adNLd+ bd).
After solving the problem the optimal number of loca-tions is compared with the interval and if necessary an-other interval (with anan-other linear function) is chosena.
QALY’s are converted into monetary units (euros), based on earlier described concepts, using € 50,000 per QALY (EQ) which is a relative low number as previous studies often use $100,000 per QALY [41]. To test the robustness of our results we also ran the model using€
Ikkersheimet al. BMC Health Services Research2013,13:220 Page 4 of 9
1 Acute infectious and parasitic diseases and poisoning Acute 95,8 93193 Intermediate 45
2 Chronic infectious and parasitic diseases Chronic 184,4 3885 High 120
3 Neoplasms Chronic 1845,1 405124 High 120
4 Diabetes Chronic 197,6 17445 Non existent 45
5 Endocrine, metabolic and immunity disorders Chronic 220 46837 Intermediate 45
6 Haematology Elective/Chr. 146,1 51064 High 45
7 Acute mental disorders Acute 85,7 12000 High 45
8 Chronic mental disorders Chronic 306,6 22134 Non existent 45
9 Diseases of the nervous system Chronic 522,2 89335 Low 45
10 Eyecare Elective 596,9 207327 Low 45
11 Earcare Elective 230,4 61090 Intermediate 45
12 Cerebral hemorrhage/ischemia Acute 436,3 47925 High 45
13 Chronic cardiovascular disease (including congestive heart failure) Chronic 938,5 180186 Non existent 45
14 Cardiovascular disease with intervention (PCI/CABG) Acute 1047,7 163275 High 45
15 Acute diseases of the respiratory system Acute 246,7 64310 Low 45
16 Complex pulmonary surgery Elective 305,6 20502 High 45
17 Common surgery of the respiratory system Elective 122,1 74168 Low 45
18 Chronic obstructive pulmonary disease and allied conditions Chronic 305,5 48236 Non existent 120
19 Surgery of diseases of the digestive system Elective 422,7 215757 Intermediate 45
20 Diseases of oral cavity, salivary glands, and jaws Chronic 1108,9 26366 Low 45
21 Gynaecology Elective 481,6 82053 Low 45
22 Urinary system Elective 497,1 151334 Low 45
23 Complications of pregnancy, childbirth and the puerperium Elective 739,3 296513 Intermediate 45
24 Dermatology Chronic 412,3 68625 Low 45
25 Rheumatism and arthropathies (non surgical) Chronic 961,2 157265 Low 45
26 Diseases of the musculoskeletal system that require surgical treatment Elective 857,3 238155 Intermediate 45
27 Congenital disorders Chronic 216,1 25669 High 120
28 Conditions originating in the perinatal period Elective 331,2 75980 High 120
29 Signs, symptoms and ill-defined conditions - 2.746,30 346106 Intermediate 45
30 Emergency care Acute 604,1 52605 Non existent 45
31 Specialized trauma care Acute 475,6 77330 High 120
al.
BMC
Health
Services
Research
2013,
13
:220
Page
5
o
f
9
ntral.com/1
[image:5.794.71.708.72.535.2]20.000 per QALY and € 100.000 per QALY. Implicitly, this is also a sensitivity analysis for the assumptions we made for the volume-outcome relationship.
The volume-outcome relationship for a disease group
dis now as follows:
Qualityd¼EQ NPdðadNLdþbdÞfor all d;
Accessibility
The second element in the objective is travel time. The travel time of patients is calculated based on the demo-graphics per zip code [23], using similar approaches as
previous studies measuring accessibility of care [42]. The Netherlands are divided in 794 zip code areas (the Dutch Frisian Islands are excluded). The percentage wise distri-bution of patients for every diagnosis group is assumed identical for these 794 zip code areas.
Total travel expenses per diagnosis group are based on the number of patients (NPDp,dper diagnosis groupdand
zip code p), the total amount of time traveling (number of visits times travel time) and the travel expenses per time unit (ET).
The total number of visits per patient having diagnosis
d (NVd) was taken from current guidelines in which the
number of outpatient clinic visits (including possible radio-therapy/chemotherapy and follow-up visits). It is assumed that all treatments take place at one location, including follow-up visits. For the driving time to the hospital loca-tions (TTp,q) the Dutch Drive Time Matrix was used [43].
The travel expenses per hour (ET) are derived from the costs of traveling by taxi (€2.20 per kilometer) [44] and the loss of income by traveling, using the national median income of €32,000 a year for 1,600 working hours [23]. We assumed that apart from the patient, a second person always accompanies the patient. Based on the literature regarding patient preferences – as men-tioned in the introduction–we assumed that all patients are willing to travel as these travel costs are compensated by a higher quality of care. As we know that individual pa-tient preferences regarding willingness to travel may differ, this is a limitation of our used data and approach.
For all diagnosis groups da maximum is set –based on expert opinions – on the acceptable travel time (maxtd) for patients. The decision variable Yp,q,d, which
assigns zip code areas to potential hospitals for a diagno-sis group, is restricted to the domain(p,q,d)with:
Yp;q;dTTp;q≤maxtdfor all p;q;d:
The costs for traveling for a diagnosis group d is as follows:
Traveld¼2ET NVd
∑
p;qNPD
p;dYp;q;dTTp;qfor all d:
Constraint: efficient use of resources
Efficiency is regarded as operational efficiency concerning three facilitiesf:
Operating room (OR)
Ward
Intensive care unit (ICU)
[image:6.595.56.290.102.566.2]It is assumed that there are no capacity limitations for these facilities and that the same facility can be used for different diagnosis groups.
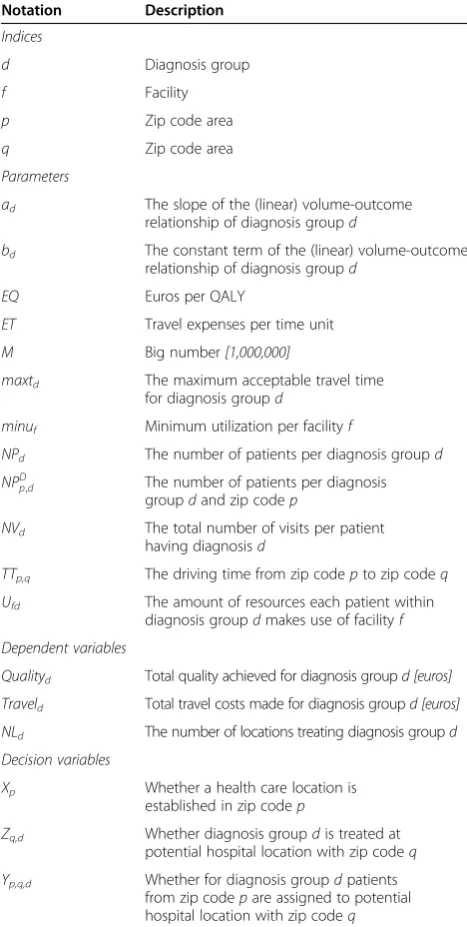
Table 3 Description of indices, parameters & variables
Notation Description
Indices
d Diagnosis group
f Facility
p Zip code area
q Zip code area
Parameters
ad The slope of the (linear) volume-outcome relationship of diagnosis groupd
bd The constant term of the (linear) volume-outcome relationship of diagnosis groupd
EQ Euros per QALY
ET Travel expenses per time unit
M Big number[1,000,000]
maxtd The maximum acceptable travel time
for diagnosis groupd
minuf Minimum utilization per facilityf
NPd The number of patients per diagnosis groupd
NPD
p;d The number of patients per diagnosis groupdand zip codep
NVd The total number of visits per patient having diagnosisd
TTp,q The driving time from zip codepto zip codeq
Ufd The amount of resources each patient within diagnosis groupdmakes use of facilityf
Dependent variables
Qualityd Total quality achieved for diagnosis groupd [euros]
Traveld Total travel costs made for diagnosis groupd [euros]
NLd The number of locations treating diagnosis groupd
Decision variables
Xp Whether a health care location is established in zip codep
Zq,d Whether diagnosis groupdis treated at potential hospital location with zip codeq
Yp,q,d Whether for diagnosis groupdpatients
from zip codepare assigned to potential hospital location with zip codeq
Ikkersheimet al. BMC Health Services Research2013,13:220 Page 6 of 9
A healthcare location is considered efficient when a minimum utilization (minuf) is reached. How much a
fa-cility is used depends on the number of patients coming to this specific healthcare locationp(
∑
p;dNPpD;dYp;q;d where NPDp,dis the number of patients with diagnosisdliving inzipcodeqandYp,q,dindicates to which healthcare location pthese patients go for care) and how much each patient makes use of this facility (Uf,d).
This leads to the following constraint:
∑
p;dNP D
p;dYp;q;dUf;d≥minufXp for all f;p:
No ethical approval was required for this study.
Results
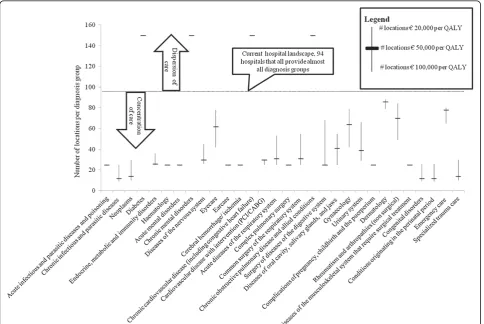
The above model has been run with the data as discussed. Figure 1 shows per diagnosis group the number of loca-tions that ideally provides care for patients with a disease from that diagnosis group. The number of locations vary from 12 locations for diagnosis groups like congenital anomalies and 14 locations for neoplasms, which have a
high volume-outcome relationship, to 150 locations for chronic diagnosis groups such as diabetes and chronic ob-structive pulmonary disease (COPD). Also the figure dis-plays the results from the model using€20.000 per QALY and€100.000 per QALY.
In the new hospital landscape, care for acute diagnosis groups and diagnosis groups with a strong volume-outcome relationship is provided on less locations than in the current situation. Patients with a chronic disease have less travel time than they have nowadays. Figure 2 shows the travel time for patients with acute, chronic or other diseases in the new hospital landscape. In the current landscape of 94 hospitals the average travel time is 14.9 minutes, whereas, given the number of locations per diagnosis group in Figure 1 with the scenario of € 50.000 per QALY the travel time will be 28.9 minutes.
Discussion
[image:7.595.57.542.370.694.2]In this study we explored how the optimal hospital land-scape may look like based on a MIP model that tradeoffs the dimensions efficiency, quality and accessibility of hospital care in the Dutch context.
Figure 1Number of locations per diagnosis group, including sensitivity analyses with different values per QALY1.1For some diagnosis
Our findings–given the assumptions we made - sug-gest that the current Dutch hospital landscape is too dis-persed and too concentrated at the same time. For the more complex diagnosis groups such as neoplasms, pa-tients would benefit from more concentration of care, where for chronic diagnosis groups such as COPD and diabetes optimal value may be created by making care more accessible to patients by providing chronic care at more locations throughout the country. These findings are in line with previous non empirical but rather con-ceptual studies regarding the Dutch hospital landscape that also advocates more dispersion for chronic care and more concentration for acute and/or complex diagnosis groups [45].
Based on our findings we believe that other countries or regions can apply our model as well.
Moreover we see that this development of concentra-tion of care is actually happening in the Dutch hospital market; associations of medical specialists are formulat-ing minimum volume norms for a range of conditions, resulting in fewer hospitals providing treatments for complex care [46]. In addition, there is a trend of mer-ging of (smaller) hospitals, probably caused by efficiency pressures, concentration of care to enhance quality as well as market power considerations [37]. This latter de-velopment is not necessarily in line with the findings of our model as hospitals tend to merge as a whole, making no differentiation between characteristics of individual (groups of ) diagnosis.
The main contribution of this study compared to pre-vious hospital allocation studies is that it systemically in-cludes the quality of care dimension [16-18]. Just these dimension is very highly rated by patients in multiple studies, that show that patients are willing to travel substan-tial distances for higher quality of care [11,47,48]. There-fore, including the quality of care dimensions in hospital
allocation models that are used by policy makers, may im-prove the alignment of the hospital infrastructure with the preferences of society as a whole and individual patients.
It is important to state that this study has an explora-tive character especially because the volume-outcome relationship is not established yet for all different diag-nosis groups let alone all the individual diagdiag-nosis. Future research regarding the volume-outcome relationship may alter the used input data and thereby alter the opti-mal number of locations per diagnosis group. In addition we did not include specialization effects of hospitals in our model and only ensured a minimal scale of hospitals but did not fully model economies of scale nor econ-omies of scope effects. Also we did not include potential price effects due to a potentially lower level of competi-tion between providers. However, most of these effects, like other constraints or functions, could be added to this approach as well: nearly the only aspect that needs to be taken into account is the size of the mathematical model (otherwise it cannot be solved within a reasonable time frame). Last, it is important to state that our model does not include individual preferences of patients, this implies that our findings of a different hospital landscape do not necessarily match with (all) individual preferences.
Conclusion
In conclusion, our study shows a new approach for de-termining the allocation of diagnosis groups in a hospital blueprint in a country or certain region. This approach, considering quality of care in relation to volume per pro-vider, can be used in various countries or regions. In addition, our model shows that within the Dutch context chronic care may be too concentrated while complex and acute care may be too dispersed.
Endnotes
a
To calculate the gain in QALYs, three figures were used, information from national statistics and literature 1) A patient who survives 10 years after the diagnosis lives on for another 10 years on average. This is based on the average age of diagnosis in the Netherlands (60 years), and the average life expectancy at age 60 (about 23 years) The quality of life of breast cancer patients is between 80-90% when surviving 5 to 10 years, and 50% at most when dying within 5 to 10 years 3) The quality of life is equal for all patients that survived the diagnosis, regardless whether they are treated in high-volume or low-volume hospitals.
b
[image:8.595.56.291.89.257.2]More accurate would be to regard the relationship as a continuous convex function. For modeling purposes a linear function is chosen that approaches the convex function in the interval of the expected number of opti-mal locations.
Figure 2Travel time by car to nearest hospital per type of diagnosis group.
Ikkersheimet al. BMC Health Services Research2013,13:220 Page 8 of 9
Competing interests
The authors declare to have no competing interests.
Authors’contributions
DI drafted the manuscript and contributed to all other aspects of the study. MT, GvS, NdB and HF were involved in the data analyses and performed critical revision of the manuscript. All authors read and approved the final manuscript.
Author details
1
KPMG Plexus, Breukelen, The Netherlands.2FALW, VU University, Amsterdam, The Netherlands.3Tilburg University, Tilburg, The Netherlands.
Received: 21 February 2012 Accepted: 1 May 2013 Published: 16 June 2013
References
1. Porter ME, Teisberg EO:Redefining health care.Boston Harvard Business School Press; 2006.
2. Meyer E, Weitzel-Kage D, Sohr D, Gastmeier P:Impact of department volume on surgical site infections following arthroscopy, knee replacement or hip replacement.BMJ Qual Saf2011.
3. NHS:Cooperation and Competition panel“The impact of hospital treatment volumes on outcomes”. In., vol. Working Paper Vol. 1 No. 1.London: NHS; 2010. 4. Hagen TP, Vaughan-Sarrazin MS, Cram P:Relation between hospital
orthopaedic specialisation and outcomes in patients aged 65 and older: retrospective analysis of US Medicare data.BMJ2010,340:c165. 5. Metnitz B, Metnitz PG, Bauer P, Valentin A:Patient volume affects outcome
in critically ill patients.Wien Klin Wochenschr2009,121(1–2):34–40. 6. Tilford JM, Simpson PM, Green JW, Lensing S, Fiser DH:Volume-outcome
relationships in pediatric intensive care units.Pediatrics2000, 106(2 Pt 1):289–294.
7. Jacobs P, Rapoport J, Edbrooke D:Economies of scale in British intensive care units and combined intensive care/high dependency units.Intensive Care Med2004,30(4):660–664.
8. Christensen CM, Grossman JH, Hwang J:The Innovator’s Prescription.
New York: Mc Graw-Hill; 2009.
9. Ho V, Town RJ, Heslin MJ:Regionalization versus competition in complex cancer surgery.Health Econ Policy Law2007,2(Pt 1):51–71.
10. van Empel IW, Dancet EA, Koolman XH, Nelen WL, Stolk EA, Sermeus W, D’Hooghe TM, Kremer JA:Physicians underestimate the importance of patient-centredness to patients: a discrete choice experiment in fertility care.Hum Reprod2011,26(3):584–593.
11. Cancer Values Research part II:Willingness to travel for hospital treatment.
Ipsos Mori; 2007.
12. Albada A, Triemstra M:Patients’priorities for ambulatory hospital care centres. A survey and discrete choice experiment among elderly and chronically ill patients of a Dutch hospital.Health Expect2009,12(1):92–105. 13. Birk HO, Henriksen LO:Why do not all hip- and knee patients facing long
waiting times accept re-referral to hospitals with short waiting time? Questionnaire study.Health Policy2006,77(3):318–325.
14. Dawson D, Jacobs R, Martin S, Smith P:Is patient choice an effective mechanism to reduce waiting times?Applied health economics and health policy2004,3(4):195–203.
15. Committee on Quality of Health Care in America:Crossing the quality chasm: a new health system for the 21st century.Washington: National Academy Press; 2001.
16. Schuurman N, Fiedler RS, Grzybowski SC, Grund D:Defining rational hospital catchments for non-urban areas based on travel-time.Int J Health Geogr2006,5:43.
17. Ho V, Petersen LA:Estimating cost savings from regionalizing cardiac procedures using hospital discharge data.Cost Eff Resour Alloc2007,5:7. 18. Shortt NK, Moore A, Coombes M, Wymer C:Defining regions for locality
health care planning: a multidimensional approach.Soc Sci Med2005, 60(12):2715–2727.
19. ReVelle CSEH, Daskin MS:A bibliography for some fundamental problem categories in discrete location science.European Journal of Operational Research2008,184:817–848.
20. Melo MTNS, Saldanha-da-Gama F:Facility location and supply chain management - A review.European Journal of Operational Research2009, 196:401–412.
21. AIMMS:3.11 64-bit Developer Large + CPLEX.Paragon Decision Technology B.V; 2011.
22. KPMG Plexus:Value creation within the Dutch health care system.Breukelen: KPMG Plexus; 2011.
23. CBS:National Database Statline - Central Bureau of Statistics.The Hague: CBS; 2010.
24. Allgood PC, Bachmann MO:Effects of specialisation on treatment and outcomes in screen-detected breast cancers in Wales: cohort study.Br J Cancer2006,94(1):36–42.
25. Chen CS, Liu TC, Lin HC, Lien YC:Does high surgeon and hospital surgical volume raise the five-year survival rate for breast cancer? A population-based study.Breast Cancer Res Treat2008,110(2):349–356.
26. Gilligan MA, Neuner J, Zhang X, Sparapani R, Laud PW, Nattinger AB: Relationship between number of breast cancer operations performed and 5-year survival after treatment for early-stage breast cancer.Am J Public Health2007,97(3):539–544.
27. Gutierrez JC, Hurley JD, Housri N, Perez EA, Byrne MM, Koniaris LG:Are many community hospitals undertreating breast cancer?: lessons from 24,834 patients.Ann Surg2008,248(2):154–162.
28. Hebert-Croteau N, Brisson J, Lemaire J, Latreille J, Pineault R:Investigating the correlation between hospital of primary treatment and the survival of women with breast cancer.Cancer2005,104(7):1343–1348. 29. Roohan PJ, Bickell NA, Baptiste MS, Therriault GD, Ferrara EP, Siu AL:
Hospital volume differences and five-year survival from breast cancer.
Am J Public Health1998,88(3):454–457.
30. Skinner KA, Helsper JT, Deapen D, Ye W, Sposto R:Breast cancer: do specialists make a difference?Ann Surg Oncol2003,10(6):606–615. 31. Killeen SD, O’Sullivan MJ, Coffey JC, Kirwan WO, Redmond HP:Provider volume
and outcomes for oncological procedures.Br J Surg2005,92(4):389–402. 32. Tanke MA, Ikkersheim DE:A new approach to the tradeoff between quality
and accessibility of health care.Health Policy2012,105(2–3):282–287. 33. Shahian DM, Normand SL:The volume-outcome relationship: from Luft to
Leapfrog.Ann Thorac Surg2003,75(3):1048–1058. 34. RVZ:Hospital Landscape 2020.The Hague: RVZ; 2011.
35. NVvH:Volume norms per provider 1.0. NVvH.Utrecht; 2012. Available from: http://www.heelkunde.nl/.
36. VWS:Law permits for health care providers [WTZi].The Hague: VWS; 2011. 37. KPMG Plexus:Wie doet het met wie in de zorg?.Amstelveen: KPMG Plexus; 2011. 38. Prismant:Prism Cubes National Medical Registry (LMR).Utrecht: Prismant; 2009. 39. KPMG Plexus:ICU and OR benchmark.Breukelen: KPMG Plexus; 2011. 40. Poos MJJC SJ, Groen J, Kommer GJ, Slobbe LCJ:Kosten van Ziekten in
Nederland 2005.Bilthoven: National Institute for Public Health and the Environment Cost of Illness (RIVM); 2008.
41. Cutler DM:Your Money or Your Life. Strong Medicine for America’s Health Care System.New York: Oxford University Press; 2004.
42. Love D, Lindquist P:The geographical accessibility of hospitals to the aged: a geographic information systems analysis within Illinois.Health services research1995,29(6):629–651.
43. Postcode.nl, V B: InPostcode.nl B.V.Edited by Pn BVA. Haarlem: Postcode.nl B.V; 2011.
44. Costs of taxi’s, based on national tariffs.Available from: http://www. verkeerenwaterstaat.nl/onderwerpen/vervoermiddelen/taxi/ taxiwet_ondernemers/tarieven/.
45. Kuenen JW GM, Van Leeuwen W, voor Kwaliteit NTTK: Amsterdam: The Boston Consulting Group; 2010.
46. NVvH:Minimumnormen 3.0. NVvH.Utrecht; 2012. Available from: http:// www.heelkunde.nl/.
47. KPMG Plexus:Quality information and the general practitioner.Breukelen: KPMG Plexus; 2011.
48. ZAio:Visiedocument Ziekenhuiszorg.Utrecht: The Health Care Autority in formation; 2005.
doi:10.1186/1472-6963-13-220
Cite this article as:Ikkersheimet al.:Modeling hospital infrastructure by optimizing quality, accessibility and efficiency via a mixed integer