R E S E A R C H A R T I C L E
Open Access
Impact of RNA-seq attributes on false positive
rates in differential expression analysis of de novo
assembled transcriptomes
Emmanuel González
1*and Simon Joly
1,2Abstract
Background:High-throughput RNA sequencing studies are becoming increasingly popular and differential expression studies represent an important downstream analysis that often follow de novo transcriptome assembly. If a lot of attention has been given to bioinformatics tools for differential gene expression, little has yet been given to the impact of the sequence data itself used in pipelines.
Results:We tested how using different types of reads from the ones used to assemble a de novo transcriptome (both differing in length and pairing attributes) could potentially affect differential expression (DE) results. To investigate this, we created artificial datasets out of long paired-end RNA-seq datasets initially used to build the assembly. All datasets were compared via DE analyses and because all samples come from the same sequencing run, DE of genes or isoforms can be interpreted as false positives resulting from sequence attributes. If the false positive rate for differential gene expression does not seem to be strongly affected by sequencing strategy (max. of 3.5%), it could reach 12.2% or 28.1% for differential isoform expression depending of the pipeline used. The effect of paired-end vs. single-end strategy was found to have a much greater impact in terms of false positives than sequence length.
Conclusion:In light of false positive rate results, we recommend using paired-end over single-end sequences in differential expression studies, even if the impact is less serious for differential gene expression.
Keywords:de novotranscriptome assembly, Differential gene expression, Differential isoform expression, Non-model organisms, False positive rates, RNA-seq
Background
Recent advances in massively parallel sequencing tech-nologies have created huge opportunities in the field of transcriptomics [1-4]. High-throughput RNA sequencing, or RNA-seq, together with the development of powerful computational methods, have given researchers the oppor-tunity to study non-model organisms by assembling de novo transcriptomes, i.e. without a reference genome or transcriptome [5-7]. Such computational methods are be-ing increasbe-ingly used as species for which a referenced genome or transcriptome exists represent a tiny fraction of all species.
Beyond transcriptome assembly, one of the great advan-tages of RNA-seq is to allow gene or isoform expression
quantification and the evaluation of their differential ex-pression under different conditions. By providing direct quantification of all transcripts of a sample, RNA-seq data has the potential to overcome several limitations of previ-ous approaches that were limited to small scaled studies (quantitative PCR) or that required important genomic knowledge and resources (microarrays) [8]. For instance, RNA-seq data has been rapidly found to outperform mi-croarrays approaches [9].
Despite these great promises, accurate and reliable dif-ferential expression studies are still challenging and a lot of attention has been given to bioinformatics tools [10,11]. These challenges involve, for example, mapping sequen-cing reads to a reference transcriptome and statistically testing for differential expression. Yet, surprisingly little at-tention has been given to the impact of sequence types used as input on differential expression analyses. Practic-ally, differential expression studies requires two decisions * Correspondence:[email protected]
1
Institut de recherche en biologie végétale, Université de Montréal, 4101 Sherbrooke E, Montréal H1X 2B2, (QC), Canada
Full list of author information is available at the end of the article
in terms of sequencing parameters, i.e. RNA-seq reads length and the possibility of sequencing RNA fragments from one end (single-end reads) or both ends (paired-end reads). Of course, long paired-end reads are the best choice for constructing an assembly as they outperform single-end alignment in terms of both sensitivity and specificity [12]. However, single-end reads might be favored for eco-nomic reasons, especially for gene quantification as an in-crease in sensitivity and specificity might not always be required. For instance, although paired-end reads are gen-erally thought to be imperative for correctly estimating isoform-specific expression, they might not be required for gene expression. As such, it could seem appropriate to as-semble a transcriptome using paired-end reads, but to use single-end reads when quantifying gene expression on bio-logical replicates. This common belief has rarely been tested and little is known about the impact of sequencing decisions on differential expression results accuracy.
The objective of this study is to test how sequencing strategies (i.e. sequencing length and pairing options) af-fects false positive rates in differential expression results at both gene and isoform level. We created different types of sequence datasets from a long paired-end sequencing run and analyzed the datasets with each other to evaluate the impact of the sequence type on false positive rates. Our results show that the choice of sequence used in differential gene expression studies can sometimes have an important impact on the accuracy of the results.
Results and discussion Transcriptome assembly
Two samples consisting of different tissues from distant plants were studied: RNA was extracted from willow (Salix purpurea L.; Salicaceae; Rosids) buds, as well as from all stages of flower development ofRhytidophyllum vernicosumUrb. & Ekman (Gesneriaceae; Asterids) using a modified CTAB method [13]. Both samples were se-quenced using 100 bp paired-end strategy on an Illu-mina Hiseq 2000 sequencer at the Genome Quebec Innovation Centre (Montreal, Canada). After removing poor quality sequences and nucleotides, a de novo tran-scriptome was built with Trinity [4]. To evaluate whether different types of sequences used in the transcriptome as-sembly could affect false positive rates in DE analyses, we assembled two transcriptomes, that is with and without pairing information (Table 1).
Bioinformatics pipelines
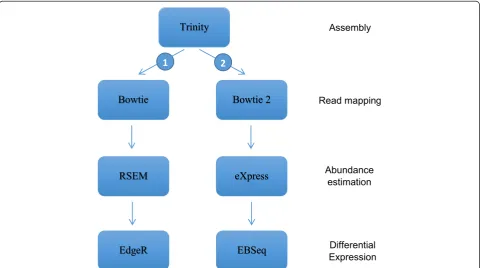
Starting from the transcriptome assemblies, two differ-ent pipelines were used to calculate contig abundances and differential expressions (Figure 1). The first one is directly available from within the Trinity suite and is composed of the ungapped aligner Bowtie [14], RSEM [15] for calculating transcript abundances, and EdgeR
[16] for testing differential expression. Trinity being widely used, we thought it was relevant to test this pipeline that might represent the default option in many studies. The second pipeline used Bowtie2 [17], eXpress [18] for esti-mating transcripts abundances, and EBSeq [19] for differ-ential expression. This pipeline is based on a gapped aligner known to perform well [20] and recommended for use with eXpress [18]. One advantage of this second pipeline is speed: bowtie2 + eXpress is very fast compared to Bowtie + RSEM as implemented in Trinity pipeline. We decided not to use EdgeR in the second pipeline as EdgeR requires setting a dispersion factor that was hard to evaluate for our artificial samples. EBSeq is an empirical Bayesian approach that directly models differential variabil-ity as a function of the number of isoforms, providing a good approach for isoform level inference. No assumption has to be made as the expectation–maximization algorithm is used for estimating all parameters through an it-erative procedure until convergence. EBSeq is also capable to identifying DE genes. We acknowledge that several other pipelines could have been tested. Yet, evaluating pipelines is beyond the scope of this study that focuses on the impact of sequence type. We chose two different pipe-lines to make sure they did not affect our results.
Short-read sequences mapping
To simulate 50 base pairs paired-end (50 bp PE), 100 bp single-end (100 bp SE) and 50 bp single-end (50 bp SE) reads, initial 100 bp PE RNA-seq reads were trimmed or pairing information removed. Each different set of reads was mapped back to thede novotranscriptomes (Table 2). The ca. 10% difference between paired-end and single-end mapping can be explained by the fact that single-end map-ping doesn’t have any pairing constraint. Paired-end back mapping percentages are thus lower as any repetitive short read sequence should be placed more reliably since its mate contributes to mapping information. Both species showed similar back mapping percentages between assem-blies built from paired-end reads and assemassem-blies built from single-end reads (PE and SE assemblies; Table 2), al-though statistics show that the PE assembly is substantially larger than the SE assembly (Table 1). Furthermore, genes and isoforms are longer in PE assembly compared to SE assembly. This supports previous observations that PE as-sembly outperforms SE asas-sembly in terms of sensitivity and specificity [12].
Differential expression analyses
the different datasets should have exactly the same genes and isoforms abundance and no differential expression should be observed. As shown in Figures 2 and 3, only sets that are exactly of the same length and pairing type show this trend (“same data”line). False positives appear when modified RNA-seq datasets are compared. Any ob-servation of differential gene expression means that strat-egies between data sets affect the abundance estimates.
Comparing Figures 2 and 3 shows that pipeline strat-egies do not have much impact on DE at gene level: dif-ferences observed in false positive rates are minor. Interestingly, these results suggest that the use of a gapped alignment, which may seem unnecessary as reads are directly mapped to transcripts, does not affect the re-sults. In fact, Bowtie2 showed extremely good results when coupled to eXpress, the latter handling multimap-ping very well. At the isoform level, on the contrary,
the second pipeline clearly outperforms the first one (Figures 2 and 3). This result is not totally unexpected as EBSeq approach was developed mainly for isoform differ-ential expression studies [19]. Because pipeline 2 gives better results at the isoform level compared to pipeline 1, only results from this pipeline will be discussed in the fol-lowing for concision and clarity purposes. However, the pipeline choice does not affect our conclusions.
Sequence length
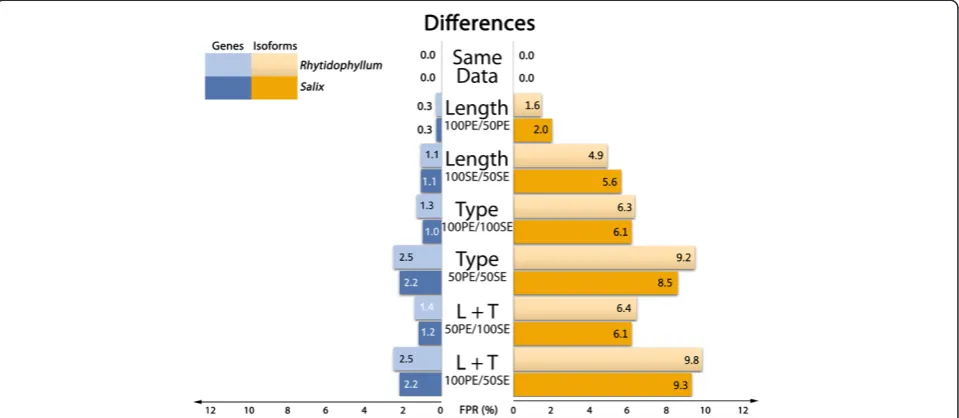
[image:3.595.57.540.99.198.2]In both species, reducing sequence length had little im-pact on gene expressions (Figure 3, “Length” lines): FPR adds up to 0.3% for PE sequences and about 1% for SE sequences. In the isoform approach, FPR gets approxi-mately six times higher: about 2% for PE sequences and 6% for SE sequences. Sequence length influences FPR as shorter reads have potentially more multimapping events Table 1 Raw data and trinity assemblies statistics
Paired-end assembly Single-end assembly
Salix purpurea Rhytidophyllum vernicosum Salix purpurea Rhytidophyllum vernicosum
Number of sequences 72,121,862 74,653,202 72,121,862 74,653,202
Isoforms 185,052 165,516 157,076 135,863
Genes 92,450 70,662 86,087 66,261
Transcriptome length (bp) 249,828,609 289,064,658 192,652,014 214,836,625
N50 2,235 2,800 2,091 2,583
[image:3.595.58.539.444.712.2]than longer reads as they are less specific. This uncer-tainty results in different estimated counts for genes or isoforms compared to longer sequences.
Paired-end vs. single end reads
To investigate the effect of reads pairing in differential expression analyses, DE was tested between samples in which counts were estimated with paired-end sequences (100 and 50 bp) to samples in which counts were estimated with single-end sequences (100 and 50 bp). Gene DE ana-lysis of paired versus unpaired sequences resulted in FPR of 1.7% and 1.6% (100 bp) and 3.1% and 2.7% (50 bp), for Salix and Rhytidophyllum respectively (Figure 3, “Type” lines). Whereas shortening sequence lengths had little con-sequences in gene DE analyses, removing pairing attributes had more impact on FDR. As for sequence length, isoform DE is more affected in terms of FDR: for Salix, FPR reaches 8.9% (100 bp) and 12.2% (50 bp), while it is 8.2% (100 bp) and 11.3% (50 bp) for Rhytidophyllum. Again, shorter hence less specific sequences result in higher FPR.
Lastly, DE results between datasets that varied in both sequence types and lengths produced the expected results
given the previous observations on length and pairing attri-butes. The highest FPR were observed when longest PE se-quences (100 bp) were tested against the shortest SE sequences (50 bp). BothRhytidophyllumandSalixshowed a FPR of 2.9% for gene analysis and close to 12% for iso-form analysis (Figure 3,“L + T”lines). When shorter PE se-quences (50 bp) were tested against longer SE sese-quences (100 bp), false positive rates were slightly lower both for genes (1.8% and 1.9% for Rhytidophyllum and Salix, re-spectively) and isoforms (8.4% and 9.4% for Rhytidophyl-lumandSalix, respectively).
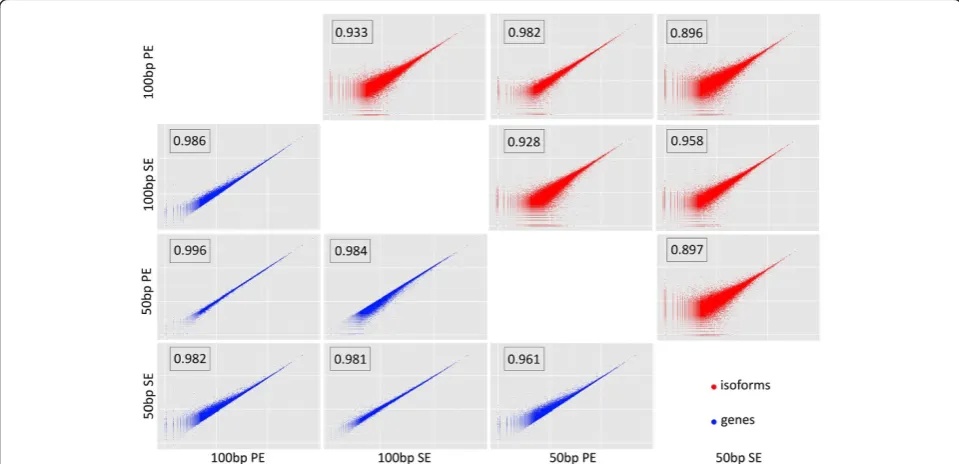
Although the main results are given in terms of FDR, the overall pattern is the same when considering the cor-relation in transcripts or genes counts for pairs of data-sets (Figure 4). That is, scatterplots are more scattered and correlations smaller for isoforms than for genes, and the strong effect of sequence type can also be observed (Figure 4).
Gene or isoform expression
[image:4.595.56.293.113.180.2]FDR suggest that the impact of the type of sequence used on DE is greater for isoforms than for genes (Figures 2, 3). Overall, isoform DE analysis onSalixled to 4.6 times more false positives than gene DE analysis. Interestingly, very similar proportions were found forRhytidophyllum(4.7 ×). These results are not really surprising. Indeed, mapping uncertainty resulting from smaller and SE sequences is ex-pected to be most important between isoforms of a single gene and less rarely among genes. Consequently, it is re-assuring that gene DE is less affected by sequence type. Nevertheless, one could argue that 1% of false positive is not completely trivial considering the number of genes in-volved in such analyses.
Table 2 Percentage of initial reads mapped back to the
de novotranscriptome
100PE 50PE 100SE 50SE
Salix purpurea PE assembly 83% 81% 90% 89%
SE assembly 83% 81% 91% 90% Rhytidophyllum
vernicosum
PE assembly 88% 88% 95% 95%
SE assembly 89% 88% 95% 95% PE assembly and SE assembly relate to the transcriptomes assembled with paired-end or single-end reads respectively.
[image:4.595.65.540.504.723.2]Effect of the transcriptome assembly strategy
Our results show that FPR are at their highest when sequences of different pairing attributes are involved (Figures 2, 3;“Type”lines). Considering that our obser-vations were so far based on a transcriptome that was assembled using PE sequences, an ensuing interroga-tion is whether the intrinsic PE nature of the assembly could inflate FDR for SE sequences datasets. We thus performed the same analyses as above on another de
[image:5.595.58.541.89.307.2]novo transcriptome assembled from 100 bp SE RNA-seq data using pipeline 2 (Table 1; Figure 5). The results obtained with this SE transcriptome are very similar to those described above (Figure 3): for both species, over-all gene FPR are lower by a ratio of 0.008 and overover-all isoform FPR are lower by a ratio of 0.2. Moreover, both figures display a very similar profile, suggesting that the type of data used to assemble the transcriptome did not affect our results on FDR. The slight decrease of the
[image:5.595.57.537.472.704.2]Figure 3False positive ratios in DE experiment (pipeline 2) as a function of input data type.
FPR observed with the SE transcriptome assembly could potentially be attributed to its smaller size in terms of genes and isoforms relative to the PE assembly (Table 1), which is likely to decrease read mapping uncertainty.
p-value threshold
Given that all previous calculations were based on a standard p-value of 0.05, we investigated whether this arbitrary threshold could affect our conclusions. This could be the case, for instance, if the significant results were always marginally significant; that is if p-value for significant genes mostly fell between 0.05 and 0.01. The distribution of p-values for all Salix isoforms and genes clearly show that a more conservative p-value would not affect our conclusions as the majority of the p-values were below 0.001 (Figure 6). The distribution of p-values for allRhytidophyllumisoforms and genes, although not reproduced here, show the same trend.
Limitations of the study
Our objective here was not to thoroughly explore all possible parameters that could affect DE analyses with respect to the sequencing strategy (e.g. sensitivity). Instead, we wanted to investigate whether DE analyses could be af-fected by the choice in sequencing strategy and broadly quantify this error. We thus acknowledge that there are limitations to the extrapolation of our conclusions to other conditions or organisms. A first limitation is related to the number of DE analyses pipelines investigated. Al-though more pipelines could have been explored, this was clearly not the aim of the study as aspects of differ-ent pipelines have been compared elsewhere [1,3,21-24].
Our approach was to use very distinct approaches to val-idate our results. Because the two pipelines gave similar results, we think the bioinformatics aspects of this study did not affect the main conclusions. Another limitation comes from the fact that only two plants have been stud-ied and it consequently might be difficult to extrapolate our results to other organisms. Yet, because these two species diverged more than 100 mya [25] and because different tissues were used (buds and flowers), we think our results are probably quite general in plants and that they could even perhaps be extended to other eukaryotes that have similar transcriptome characteristics (e.g., size, isoform numbers, etc.). Finally, we purposely did not include any biological replicate. Such replicates are mandatory when analyzing differential expression as it al-lows distinguishing treatment effects from individual variance within treatments. Adding biological replicates would probably have resulted in finding fewer DE tran-scripts and genes in our analyses. But we deliberately chose to ignore any replicate because we want to solely observe the pure consequence of a given sequencing strategy. Hence, our results show the intrinsic error due to the sequence type in a DE experiment.
Conclusions
[image:6.595.59.539.90.299.2]With the limitations mentioned in the previous section in mind, our results show that the choice of sequence type does have an impact on differential expression re-sults. Interestingly, we found that using single-end in-stead of paired-end sequences had a greater impact than reducing the length of the sequences from 100 bp to 50 bp (Figure 3). These results make sense because the
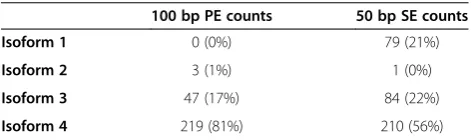
paired-end information reduces uncertainty during read mapping. For instance, if a pair of reads is essential for the accurate mapping of this pair to one specific isoform of a gene, then disrupting the pair will result in one read being mapped ambiguously to two or more isoforms of the gene. This uncertainty results in biased estimated abundance frequencies of isoforms. For instance, Table 3 reports the abundance estimates for the four isoforms of one randomly chosen Rhytidophyllum vernicosum gene (i.e. Trinity cluster), which illustrates how relative abun-dances can differ between SE and PE datasets. The total number of transcript counts, which was found to be higher for SE than for PE datasets (Table 3), also high-lights the greater uncertainty resulting from SE reads. The fact that such uncertainty in mapping occurs less frequently among genes likely explains why the FDR was less important for genes than for isoforms. Finally, the smaller impact of sequence length on FDR than pairing type can probably be explained because the distance covered on the transcript by the length reduction is less important than when pairing information is removed.
Overall, our results suggest that paired-end sequence is relatively crucial for obtaining precise isoform differ-ential expression. We also suggest using paired-end
sequences for gene DE, even though this is less critical. Indeed, the mapping uncertainty remains important for gene count estimation with single-end sequences: com-parisons of counts obtained with paired-end vs. single-end resulted in almost 2% false positives. If someone is to make economies, the best solution seems to be to se-quence 50 bp ends rather than 100 bp paired-ends (for fragments of the same length). This approach seems to result in very small differences in count estima-tion for both genes and isoforms.
Methods
Transcriptome assembly
Prior to assembling reads, Trimmomatic [26] was used to remove bad quality Illumina RNA-seq data and trim poor quality nucleotides at the beginning and the end of each sequence. The following parameters were used in the command line: LEADING:15 TRAILING:15 SLIDINGWINDOW:5:15 MINLEN:40. For the assembly, Trinity software [4] was used to reconstruct the transcrip-tomede novousing default settings. Gene sequences were obtained using isoform union method consisting on quali-fying as“gene”, the union of transcripts identified by Trin-ity as isoforms of the same gene.
Read mapping
[image:7.595.58.540.89.277.2]We used two different approaches to map RNA-seq reads to the reference transcriptome: Bowtie [14] that maps reads to a reference without allowing any gap, and Bowtie2 [17] that allows gaps during mapping. Bowtie was run as a part of Trinity pipeline. The fol-lowing parameters were used in the command line: alignReads.pl –left R1.fastq –right R2.fastq –target Trinity.fasta –seqType fq –aligner bowtie –max_dist_ between_pairs 800 –-p 16. In Bowtie 2, the following Table 3Rhytidophyllum vernicosumtranscript counts for a
gene and total number of transcript counts for 100 bp PE and 50 bp SE sequence datasets
100 bp PE counts 50 bp SE counts
Isoform 1 0 (0%) 79 (21%)
Isoform 2 3 (1%) 1 (0%)
Isoform 3 47 (17%) 84 (22%)
[image:7.595.56.292.654.724.2]Isoform 4 219 (81%) 210 (56%) Numbers represent raw counts and relative frequencies are given in parentheses.
parameters were used: Bowtie2 -X 800 -p 16 -x Bowtie_ Index−1 R1.fastq−2 R2.fastq | samtools view -Sb.
Transcript abundances
We used two different algorithms to compute abundances: an expectation-maximization algorithm (RSEM [15]) and an online method algorithm (eXpress [18]). As part of Trinity proposed pipeline (pipeline 1), RSEM was used to calculate isoform and gene abundances. The following parameters were used in the command line: run_RSEM_ align_n_estimate.pl –transcripts Trinity.fasta –seqType fq –left R1.fq –right R2.fq. In pipeline 2, eXpress was coupled to bowtie2 aligner to calculate isoforms and genes abundances.
Differential expression
The function of differential expression analysis is to point up isoforms or genes for which abundances changed sig-nificantly across experimental conditions. EdgeR [16], used in pipeline 1, handles the lack of biological replicate by simulating it, although the variance parameter was hard to evaluate. We chose to use 0.01 for this parameter since this is the value proposed for technical replicates. We ran EdgeR as part of the Trinity pipeline with the following command line: run_DE_analysis.pl –matrix counts.matrix –method edgeR –dispersion 0.01. EBSeq [19], used in pipeline 2, was developed specifically to counter biases in isoform differential expressions. We followed the EBSeq user manual instructions and used 15 iterations for convergence at a FDR of 5%.
Competing interests
The authors declare that they have no competing interests.
Authors’contributions
EG carried out the bioinformatics calculations, wrote the manuscript, and designed figures and tables throughout the article. SJ designed the experiment and participated in writing the manuscript. Both authors read and approved the final manuscript.
Acknowledgements
The authors to thank Julie Marleau and Hermine Alexandre for laboratory work, Werther Guidi for providing willow plant material, and Adriana Almeida-Rodriguez, Frederic Pitre and Michel Labrecque for support with this project. The authors also acknowledge the help of the Genome Québec Innovation Centre for advices and sequencing. This study was supported by a Genome Canada and Genome Quebec grant (Genorem Project) and a NSERC discovery grant (SJ).
Author details
1
Institut de recherche en biologie végétale, Université de Montréal, 4101 Sherbrooke E, Montréal H1X 2B2, (QC), Canada.2Montreal Botanical Garden,
4101 Sherbrooke E, Montréal, QC H1X 2B2, Canada.
Received: 18 June 2013 Accepted: 20 November 2013 Published: 3 December 2013
References
1. Martin JA, Wang Z:Next-generation transcriptome assembly.Nat Rev Genet2011,12:671–682.
2. Gahlan P, Singh HR, Shankar R, Sharma N, Kumari A, Chawla V, Ahuja PS, Kumar S:De novo sequencing and characterization of Picrorhiza kurrooa
transcriptome at two temperatures showed major transcriptome adjustments.BMC Genomics2012,13:126.
3. Ward JA, Ponnala L, Weber CA:Strategies for transcriptome analysis in nonmodel plants.Am J Bot2012,99:267–276.
4. Grabherr MG, Haas BJ, Yassour M, Levin JZ, Thompson DA, Amit I, Adiconis X, Fan L, Raychowdhury R, Zeng Q,et al:Full-length transcriptome assembly from RNA-Seq data without a reference genome.Nat Biotechnol2011, 29:644–652.
5. Lin Y, Li J, Shen H, Zhang L, Papasian CJ, Deng HW:Comparative studies of de novo assembly tools for next-generaten sequencing technologies. Bioinformatics2011,27:2031–2037.
6. Robertson G, Schein J, Chiu R, Corbett R, Field M, Jackman SD, Mungall K, Lee S, Okada HM, Qian JQ,et al:De novo assembly and analysis of RNA-seq data.Nat Methods2010,7:909–912.
7. Schulz MH, Zerbino DR, Vingron M, Birney E:Oases: robust de novo RNA-seq assembly across the dynamic range of expression levels.Bioinformatics2012, 28:1086–1092.
8. Wang Z, Gerstein M, Snyder M:RNA-Seq: a revolutionary tool for transcriptomics.Nat Rev Genet2009,10:57–63.
9. Marioni JC, Mason CE, Mane SM, Stephens M, Gilad Y:RNA-seq: an assessment of technical reproducibility and comparison with gene expression arrays.Genome Res2008,18:1509–1517.
10. Fonseca NA, Rung J, Brazma A, Marioni JC:Tools for mapping high-throughput sequencing data.Bioinformatics2012,28:3169–3177.
11. Tarazona S, Garcia-Alcalde F, Dopazo J, Ferrer A, Conesa A:Differential expression in RNA-seq: a matter of depth.Genome Res2011,21:2213–2223. 12. Li H, Homer N:A survey of sequence alignment algorithms for
next-generation sequencing.Brief Bioinform2010,11:473–483.
13. Chang S, Puryear J, Cairney J:A simple and efficient method for isolating RNA from pine trees.Plant Mol Biol Report1993,11:113–116.
14. Langmead B, Trapnell C, Pop M, Salzberg SL:Ultrafast and memory-efficient alignment of short DNA sequences to the human genome.Genome Biol 2009,10:R25.
15. Li B, Dewey CN:RSEM: accurate transcript quantification from RNA-Seq data with or without a reference genome.BMC Bioinforma2011,12:323. 16. Robinson MD, McCarthy DJ, Smyth GK:edgeR: a Bioconductor package for
differential expression analysis of digital gene expression data.Bioinformatics 2010,26:139–140.
17. Langmead B, Salzberg SL:Fast gapped-read alignment with Bowtie 2. Nat Methods2012,9:357–359.
18. Trapnell C, Roberts A, Goff L, Pertea G, Kim D, Kelley DR, Pimentel H, Salzberg SL, Rinn JL, Pachter L:Differential gene and transcript expression analysis of RNA-seq experiments with TopHat and Cufflinks.Nat Protoc 2012,7:562–578.
19. Leng N, Dawson JA, Thomson JA, Ruotti V, Rissman AI, Smits BM, Haag JD, Gould MN, Stewart RM, Kendziorski C:EBSeq: an empirical Bayes hierarchical model for inference in RNA-seq experiments.Bioinformatics 2013,29(8):1035–1043.
20. Lindner R, Friedel CC:A comprehensive evaluation of alignment algorithms in the context of RNA-seq.PLoS One2012,7:e52403. 21. Garber M, Grabherr MG, Guttman M, Trapnell C:Computational methods
for transcriptome annotation and quantification using RNA-seq.Nat Methods 2011,8:469–477.
22. Zhao QY, Wang Y, Kong YM, Luo D, Li X, Hao P:Optimizing de novo transcriptome assembly from short-read RNA-Seq data: a comparative study.BMC Bioinforma2011,12(14):S2.
23. Oshlack A, Robinson MD, Young MD:From RNA-seq reads to differential expression results.Genome Biol2010,11:220.
24. Soneson C, Delorenzi M:A comparison of methods for differential expression analysis of RNA-seq data.BMC Bioinforma2013,14:91. 25. Soltis DE, Bell CD, Kim S, Soltis PS:Origin and early evolution of
angiosperms.Ann N Y Acad Sci2008,1133:3–25.
26. Lohse M, Bolger AM, Nagel A, Fernie AR, Lunn JE, Stitt M, Usadel B: RobiNA: a user-friendly, integrated software solution for RNA-Seq-based transcriptomics.Nucleic Acids Res2012,40:W622–W627.
doi:10.1186/1756-0500-6-503