The effects of water and microstructure on the performance of
polymer electrolyte fuel cells
A.A. Shah
a,∗, G.-S. Kim
b, W. Gervais
b, A. Young
b, K. Promislow
c, J. Li
b, S. Ye
baDepartment of Mathematics, Simon Fraser University, 8888 University Drive, BC, Canada V5A 1S6 bBallard Power Systems, 4343 North Fraser Way, Burnaby BC, Canada V5J 5J9 cDepartment of Mathematics, Michigan State University, East Lansing, MI 48824, USA
Received 3 February 2006; received in revised form 21 February 2006; accepted 24 February 2006 Available online 18 April 2006
Abstract
In this paper, we present a comprehensive non-isothermal, one-dimensional model of the cathode side of a Polymer Electrolyte Fuel Cell. We explicitly include the catalyst layer, gas diffusion layer and the membrane. The catalyst layer and gas diffusion layer are characterized by several measurable microstructural parameters. We model all three phases of water, with a view to capturing the effect that each has on the performance of the cell. A comparison with experiment is presented, demonstrating excellent agreement, particularly with regard to the effects of water activity in the channels and how it impacts flooding and membrane hydration. We present several results pertaining to the effects of water on the current density (or cell voltage), demonstrating the role of micro-structure, liquid water removal from the channel, water activity, membrane and gas diffusion layer thickness and channel temperature. These results provide an indication of the changes that are required to achieve optimal performance through improved water management and MEA-component design. Moreover, with its level of detail, the model we develop forms an excellent basis for a multi-dimensional model of the entire membrane electrode assembly.
© 2006 Elsevier B.V. All rights reserved.
Keywords:PEMFC; Cathode catalyst layer; Water; Microstructure; Operating conditions; Performance prediction
1. Introduction
The fuel cell, in its various forms, is a promising alternative to the use of hydrocarbon fuels for energy production, motivated largely by concern for the environment. The proton exchange membrane fuel cell (PEMFC) receives a great deal of attention, particularly because it attains a relatively high power density and electrical efficiency. Before the benefits of this technology can be realized, several important practical issues need to be resolved, with the overarching aims of reducing the manufacturing cost and improving the performance and durability. A key concern, which we address in this paper, is the management of water in its various phases.
The heart of a single PEMFC is composed of a proton con-ducting membrane sandwiched between an anode and cathode. The anode and cathode are thin sheets of porous graphite paper, onto which a catalyst layer, composed roughly of carbon-grain
∗Corresponding author. Tel.:+1 778 288 4292; fax: +1 604 268 6657.
E-mail address:[email protected](A.A. Shah).
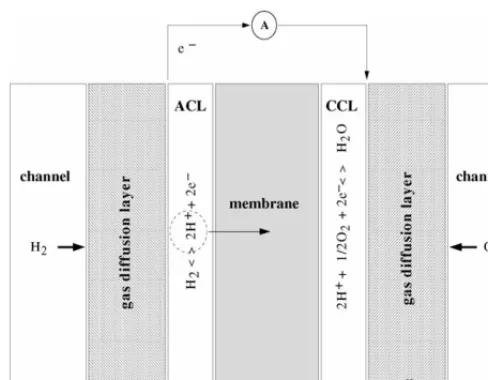
supported Platinum particles, is pressed. The basic principle of the PEMFC, or indeed any other fuel cell, is to convert chemi-cal into electrichemi-cal energy. At the anode, hydrogen is fed through the graphite paper, termed the gas diffusion layer (GDL), and is oxidized in the anode catalyst layer (ACL), producing hy-drogen ions and free electrons. The electrons pass through an external circuit and the ions through the membrane, eventually combining with electrons and oxygen in the cathode catalyst layer (CCL) to form water. The oxygen is fed through a GDL at the cathode side. The membrane electrode assembly (MEA) is depicted inFig. 1. Because of the low operating temperatures the Platinum (Pt) catalyst is required to enhance the rate of re-action by providing an alternative pathway to the final products. The cost of Pt is clearly a concern; though the required amount of Pt has been reduced ten-fold reduction in the last few years, the percentage that is utilized is still very low (approximately 20%).
The catalyst layers are amongst the most complex compo-nents of the fuel cell. Through the solid compocompo-nents (carbon grains, supporting smaller catalyst particles, and electrolyte), flow components of air and water vapor. Liquid water resides
Fig. 1. Schematic representation of the MEA and a description of the geometry. in the gas pores and dissolved water within the electrolyte. The electrons migrate through the carbon components of the layer while the protons migrate through pathways provided by the electrolyte. The latter is typically Nafion (a sulphonated Teflon), which contains both hydrophobic and hydrophilic regions, the second of which are vital in ensuring the free flow of the protons. The CCL is the more studied of the two catalyst layers for several reasons. The oxygen–reduction reaction (ORR) takes place at a much slower rate than the hydrogen oxidation at the anode and produces water. The hydrophilic regions in the CCL can cause water retention, which restricts the ingress of oxygen. Moreover, reaction is limited by the availability of Pt, and can only occur at points of contact between the Pt, carbon and electrolyte. Be-cause of the importance of the CCL it is included explicitly in our model, with an attempt to capture some of the micro-scale features of its structure.
The properties of the membrane and the GDL also play a central role in the control of water. It is essential that the protons generated at the anode can reach the cathode freely, and in order to attain the high conductivity necessary to achieve this, the membrane must remain well hydrated. The GDL must allow sufficient oxygen from the cathode channel to enter the CCL, but must be sufficiently hydrophobic to expel any build-up of liquid water.
The preceding discussion underlines the unquestionable im-portance of water management, which in turn explains the grow-ing emphasis placed on (particularly) liquid water in modellgrow-ing studies,[1–9]. Though many of the issues are difficult to sepa-rate, they may be summarized as follows:
1. Flooding of the CCL and GDL and its impact on the perfor-mance;
2. The relationship between humidification of the cell and per-formance;
3. Hydration of the membrane and electrolyte (ionomer); 4. The trend of PEMFC operating conditions toward higher
tem-perature and lower water activity, and their impact on satu-ration levels (optimal conditions for performance).
One of the difficulties associated with PEMFC modelling lies in accurately describing the structure of the CCL. The closest approximation to the structure is one of clumps of carbon grains (agglomerates) coated with and connected by electrolyte,[6,10– 14]. A widely employed approach in modelling the CCL is to assume that the agglomerates are spherical in shape,[6,7,15–20], and to incorporate the agglomerate-level activity into a homo-geneous model by assuming that a thin film of electrolyte (or water) introduces a local resistance to the oxygen—motivated by the well-established theory of porous catalysts (see Chapter 3 of[21]). The three main variants are as follows:
• Include external resistance to the oxygen movement arising from the film(s)—this yields an expression for the limiting current density (or reaction rate) as a function of the agglom-erate characteristics,[3,6,7,15,18].
• Include internal resistance to the oxygen movement, due to flooding of the agglomerates with electrolyte or liquid water—this yields an effectiveness factor for the oxygen dif-fusion coefficient,[16,17].
• Include both internal and external resistances, as described above,[19,20].
Explicit incorporation of such resistances distinguishes these models from those in[22–28], which treat the CCL as a homo-geneous porous medium, i.e., each phase exists in each reference control volume and is specified solely by a volume fraction. Such models are not able to capture the limiting-current-density phe-nomena.
concentrate on the GDL, treat the CCL as an interface and only introduce the membrane through the boundary conditions. They provide a thorough and rigorous discussion on the role of micro-structural parameters in liquid-water movement. Pasaogullari et al.,[33], employ the M2model in a detailed study of water ef-fects in the membrane and GDL, incorporating both anode and cathode. Their model is isothermal and treats the catalyst layer as an interface, focussing primarily on the effect of a micro-porous layer attached to the GDL.
In this paper we develop a comprehensive one-dimensional model, explicitly incorporating a GDL, CCL and membrane. Most of the features separately considered in detail in the mod-els described above are included, as well as several new fea-tures, such as a separate equation for dissolved oxygen, non-equilibrium between water in the membrane and vapour, and membrane swelling. Our aim in this paper is to present the basic features of the model, and to demonstrate its success in captur-ing the convoluted water-driven phenomena. Extension of the model to two dimensions and to one of the entire MEA can be achieved in a straightforward manner.
The outline of this paper is as follows. In the next section we list the assumptions adopted in deriving the model and discuss the broader issues faced in MEA modelling. In Section3 we present the model, with complete details and explanations. In Section4we describe the experimental procedure. The design of the cell is such that variations down the channel are minimal, i.e., pseudo one-dimensional, which allows comparison between modelling and experimental results to be made. The numerical results are then presented in Section5, in which we first demon-strate agreement with the experiments. Finally, in Section6we provide a discussion and outline future work.
2. Model description and assumptions
Before embarking on the derivation of the model, it is in-structive to list the factors that are commonly believed to impact MEA performance:
• the diffusion of oxygen through the pores of the GDL and CCL
• the transport of oxygen as a species dissolved in liquid water and electrolyte
• water production
• operating temperature and temperature variations • the micro-structure of the GDL and CCL
• bulk convective motion of liquid water in response to pressure gradients
• water vapour in the channels and in the pores of the GDL and CCL
• hydration of the membrane • electro-osmotic drag (migration)
• condensation/evaporation and absorption/desorption (to and from the electrolyte)
• the transport of protons and electrons • flooding of the GDL and CCL pores • membrane swelling
• non-uniform proton concentrations
• degradation issues, such as carbon oxidation and hydrogen peroxide production
• transient effects.
To simplify matters, we have chosen to neglect the last two items in this work. Their incorporation is the subject of current activity, in which the entire MEA is explicitly modelled. We say more on this in Section6. We now describe the model and list the assumptions adopted in its derivation.
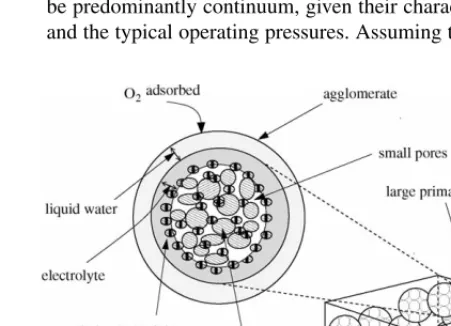
1. CCL characterization. As in the class of models discussed in the introduction, we assume that the carbon grains form spherical clusters (agglomerates) separated byprimary pores. Surrounding the agglomerates is an electrolyte layer, on which a layer of liquid water can also exist. We assume that the contact between the carbon agglomerates is sufficient to ensure the free flow of protons and electrons, and that the connecting paths posses a negligible volume fraction. Within the agglomerates exists a fraction of the electrolyte. High-resolution electron microscopy confirms that the agglomer-ate structures are coagglomer-ated with electrolyte and some liquid water. Middelman,[34], postulates that the oxygen does not have access to the Pt particles located within the agglom-erates, particularly those close to their centres. For reaction to occur within the agglomerates, sufficient electrolyte must be present, the quantity of which depends on the prepara-tion process,[10,12,35], but is typically low (though[12,35] are two examples of efforts directed at increased electrolyte penetration into the agglomerates). We therefore assume that the Pt within the agglomerates is not active, i.e., that it does not contribute to the bulk reaction. It is possible to derive an effectiveness factor to remove this assumption. However, since it is unclear that significant reaction occurs within the agglomerates, and for the sake of simplicity, we continue with our assumption. If needed or justified, the inclusion of an effectiveness factor is straightforward.
2. Oxygen transport. Diffusion in large pores is assumed to be predominantly continuum, given their characteristic size and the typical operating pressures. Assuming that the
[image:3.637.324.550.563.726.2]gen and water vapour are small concentrations in a nitrogen gas, we employ Fick’s law. The oxygen in the primary pores reaches the Platinum particles on the agglomerate surface by dissolving in the water/electrolyte and diffusing across the layer(s). Henry’s law is used to describe the equilibrium in oxygen concentration at the interface between the gas and liquid/solid phases (seeFig. 2).
3. Non-uniformity of proton concentration. The protons are transported in the form of hydronium ions, H3O+. We assume electro-neutrality (the number of negative charges equals the number of positive charges) but we donotmake the typical assumption of a homogeneous distribution of charged sites in the electrolyte, which would allow us to take the concen-tration of H3O+as constant.
4. Water. The model accounts for water in all three forms; as a dissolved species, as vapour and as liquid. Liquid water resides in the primary pores. The water dissolved in the elec-trolyte is transported by diffusion (concentration gradients) and electro-osmotic drag (migration). As do Seigel et al., [6], we assume that thenetwater produced is either in liq-uid or vapour form. Condensation and evaporation are mod-elled using the approach in[2,4,5], and references therein. In this representation the transfer occurs at a finite rate, dic-tated by the deviation of the local thermodynamic state from equilibrium. In a similar fashion, we introduce phase change between vapour and dissolved water by considering the devi-ation from equilibrium between dissolved water and vapour. Details for each are presented later.
5. Electrolyte volume. We include the effects of swelling on the volume of electrolyte in the CCL.
6. Temperature. The model is non-isothermal, which is neces-sary to model phase change accurately and to study the effects of water activity. We do however assume a single temperature for all phases.
Other assumptions are (a) negligibly small viscous flows, [36], and (b) a negligible ohmic potential drop in the electron-ically conducting carbon phase, justified by the relatively high carbon conductivity.
3. Model derivation
3.1. Catalyst layer
The geometry is depicted in Fig. 1, showing x as the space variable, with the cathode channel placed at x=0, the GDL/CCL interface atx=L1, the membrane/CCL interface at x=L2and the membrane/ACL interface atx=L3.
Letsbe the saturation (fraction of primary pore volume occu-pied by liquid water), the concentrations of oxygen and nitrogen in the primary pores beCpandCN, respectively, and the concen-tration of oxygen in the electrolyte beCe. Taking into account reaction, diffusion and absorption, mass balances yield:
−d dx
(1−s)DpdCp dx
= − hpe(HCp−Ce)
interfacial mass transfer
, (1)
−d dx
eDedCe dx
= − 1
4R(ηc, T, C s e)
reactant consumption
+hpe(HCp−Ce),
(2)
−d dx
(1−s)DNdCN dx
=0, (3)
whereeis the volume fraction of electrolyte andDp,DNandDe are the molecular diffusion coefficients of oxygen and nitrogen through the primary pores and of oxygen through the electrolyte. The first are subject to a Bruggeman correction (in the absence of a value for the tortuosity of the flow path) and their dependence on temperature and pressure follows the Chapman-Enskog for-mula (in m2s−1),[37],
Dp=3.8×10⁻⁹T 3/2 P
3/2
p , DN=3.6×10⁻⁹ T3/2
P 3/2 p , (4) wherepis the volume fraction of primary pores,Tis temper-ature andPis the gas pressure. The variations ofDpandDN with temperature and pressure are neglected, that is, we use a constant value based on the temperature at the cathode channel. Since temperature and pressure variations are weak, the corre-spondingly small changes inDpandDNhave a negligible effect. The coefficientDehas the following form (taken form[38]):
De=3.1×10⁻⁷e−2768/T, (5) where once again we approximate temperature in this expression by its value at the cathode channel.
R(ηc, T, Ces) is the reaction rate, based on the Butler-Volmer law,hpe is a volumetric mass transfer coefficient from gas to electrolyte (on the air side), and His a dimensionless Henry constant. The diffusive flux of oxygen from the pore space to the interface between the gas and electrolyte/water is balanced by the amount adsorbed into the electrolyte/water.
To prescribe the mass-transfer coefficient, hpe, we use the formula for the Sherwood number given in[37]for flow past a spherical particle.
Sh=2+0.6Re1/3Sc2/3,
whereReis the Reynolds number andScis the Schmidt num-ber. For a predominantly diffusive process, we can approximate Sh=2. From the formulahpesa=ShDp/Dag, whereDagis the agglomerate diameter andsais the specific surface area of the agglomerates, we obtainhpe=O(105). It should be noted that estimating mass transfer coefficients is itself a great challenge, a detailed discussion of which is beyond the scope of the present paper.
the electrolyte is assumed to impact on the thickness of the elec-trolyte film. To incorporate it we use the following approximate relationship:
e=0e+ksλ, (6)
whereks =0.0126, andλis the membrane water content (mol H2O/mol SO−3), given by
λ= Cd
1−ksCd, (7)
whereCdis the dissolved water concentration in the electrolyte, normalized with respect toν=1800 mol m−3, the fixed-charge site concentration of the membrane,[39].
To derive an equation for the electrolyte potential in the CCL, φ, we consider a mass balance for H3O+. With the assumption of a negligible convective flux, the contribution to the movement comes from migration and concentration gradients:
−d dx eσe F dφ
dx +eDHCd dCH
dx
diffusive flux of H3O+
= − R(ηc, T, Cs e)
H3O+consumption
, (8)
whereCHis the H3O+concentration,σeis the protonic conduc-tivity of the electrolyte,DHis the H3O+diffusion coefficient and
Fis Faraday’s constant.CHandCdare related as follows[40]
CH= −1 2keCd+
1 2keCd
2
+keCd, (9)
where the temperature dependentkeis given by
ke=k0exp H0 R 1 T − 1 298 . (10)
As an approximation we assume thatkeis constant. Note that Eq.(9)is derived with the assumption of electro-neutrality. We refer to[41]for details. The diffusion coefficient DHis taken from[40]:
DH=1.6×10⁻⁸e−1683/TCd, (11) where once again we neglect the dependence on temperature variations. Forσewe use the law derived in[39],
σe=exp 1268 1 303− 1 T
(5.14λ−0.326). (12)
The algebraic term on the right-hand side of(12)accounts for the effect of hydration on the conductivity. It is based on empirical data collected by Springer et al.[39].
An equation for the temperature,T, is derived from an energy balance of conduction, convective heat flux from liquid water movement and heat sources
− d dx
kdT
dx −spρlClvlT
=
(−δs)T ne +Fη
R(ηc, T, Cse)
reaction and activation loss +eσe dφ dx 2 ohmic heating
+hglhpc(RTCv−Psat)
phase change
[image:5.637.318.557.66.227.2]. (13)
Fig. 3. A schematic representation of the interactions between water in the three phases.
In this equation,−(δs) is the entropy associated with ORR, Cv1is the water vapour concentration,ne=4 is the number of electrons transferred in one reaction,hpcis a mass transfer co-efficient, defined below,hglis the liquid-gas enthalpy change,ρl
is the density of liquid water,Clis the specific heat capacity of liquid water, andkis the effective thermal conductivity, found from a volume average of the individual conductivities. For sim-plicity, we use constant values fork. Finally, the quantityvlis the liquid-water interstitial velocity, which we define later.
3.1.1. Water in the catalyst layer
The schematic inFig. 3depicts the features of the liquid-water model and the assumptions we make in deriving it. For a detailed description of liquid-water transport in MEA we refer to Nam and Kaviany[32].
The mass balance for water dissolved in the electrolyte is written as follows:
− d dx
⎛ ⎜ ⎜
⎝eDddCd dx +
5 44Fνλeσe
dφ dx drag ⎞ ⎟ ⎟
⎠= −hdv(Cd −C∗d) vapour↔dissolved ,
(14)
whereDdis the diffusion coefficient for dissolved water. The water vapour mass balance is expressed as follows:
− d dx
(1−s)DvdC v 1 dx
= −hpc(RTCv−Psat)
liquid↔gas +hdvν(Cd−C∗d)+
3
2 R(ηc, T, C s e)
H2O production
, (15)
whereDvis the vapour diffusion coefficient. The switch function satisfies:
=
0aw>1
1aw≤1 . (16)
provided in[42](with temperature and pressure approximated by their values at the cathode channel):
Dd=3.5×10⁻⁵λe−2436/T, Dv=4.1×10⁻⁹T 3/2 P
3/2 p .
(17)
For liquid water, the mass balance is
− d dx pρl Wl vl capillary action
=−hpc(RTCv−Psat)+3( −1)
2 R(ηc, T, C s e)
H2O production ,
(18)
where vl andWl are respectively the interstitial velocity and molar mass of liquid water.vlis determined by the Darcy-law approximation to momentum conservation:
vl= κl µl
dp
dx, (19)
where κl, µl and p are respectively the relative permeability, viscosity and pressure of the liquid. The latter is given byp= P−pc, so that differentiating Eq.(18)and using Eq.(19)yields:
− ρl µlWl
d dx
pκl(s)
−dpc ds ds dx + dP dx
=−hpc(RTCv−Psat)
+3( −1)
2 R(ηc, T, C s
e). (20)
There is a great deal of debate surrounding both the form and magnitude of the permeability and capillary pressure. Mazumder and Cole[4], compare the Leverett model employed in[5]with the empirical relationship in[9], in which both of these quantities assume entirely different forms, yielding markedly different pre-dicted levels of saturation. There are also other models of liquid transport in porous media, of varying degrees of sophistication. For example, Nam and Kaviany,[32], scale saturation against an immobile value (below which the liquid water is discontinuous and therefore does not move), and place the scaled saturation inside the Leverett function. All of the forms mentioned can be easily implemented in our model but we choose to follow that in[4,30,33](and references therein).
pc=σcJ(s), κl(s)=κcs3, (21) whereκc is the absolute permeability of the CCL andJ(s) is the capillary-pressure function. The quantity σc is defined as follows:
σc=σcosθcc
p
κc, (22)
whereθccis the contact angle for the CCL (0< θcc< π/2) and σis the surface tension. The grouping 2p/κc is then equal to the characteristic capillary radius.
The Leverett function for a hydrophilic medium, for which the wetting phase is the liquid, is given by
J(s)=1.417(1−s)−2.12(1−s)2+1.262(1−s)3. (23) The liquid–vapour phase-change term, derived from that given in [4]and references therein, is driven by the deviation
from equilibrium,RTCv−Psat, wherePsatis the saturation pres-sure of water and the first term is equivalent to the partial prespres-sure of the vapour. The latter is defined byXvP, wherePis the pres-sure of the gas phase andXv is the molar fraction of vapour. Using the ideal gas law,P =CRT, Xvis given by
Xv=Cv C =
CvRT
P , (24)
whereC=Cv+CN+Cp is the molar density of the gas. A relationship for the saturation pressure is provided in the discus-sion of the boundary conditions. In order to distinguish between evaporation and condensation, the mass-transfer coefficienthpc depends on the sign of the driving forceRTCv−Psatand its precise form is
hpc=
κcp(1RT−s)Xv RTCv> Psat κepsρl
Wl RTCv< Psat
, (25)
whereκcandκeare the condensation and evaporation rate con-stants. The values ofkeandkcare taken from[2]. We use a con-tinuously differentiable implementation of the following form:
hpc= κcp(1−s)Xv 2RT
1+|RTCv−Psat| RTCv−Psat
+κepsρl 2Wl
1−|RTCv−Psat| RTCv−Psat
. (26)
In a similar fashion, the vapour-dissolved phase-change term in Eqs.(14) and (15)is driven by the deviation from equilibrium, Cd−C∗d, whereCd∗is the concentration of dissolved water in equilibrium with vapour. The latter is derived from the following law for the equilibrium water content measured at 80◦C (found in[43]):
λ∗=0.3+10.8aw−16a2w+14.1a3w, C∗d=
λ∗
1+0.0126λ∗, (27)
whereaw is the water vapour activity. To distinguish between desorption and water-uptake of the electrolyte (absorption), the mass-transfer coefficienthdvdepends on the sign of the driving forceCd−C∗d. From the experimental and numerical results in[44], we can approximate the coefficients of absorption and desorption as follows:
hdv=
κa(1−s)λ Cd−C∗d<0 κd(1−s)λ Cd−C∗d>0
, (28)
whereκdandκeare given inTable 1. Their weak dependence on temperature variations is neglected. The factor 1−s ac-counts for the blockage of the pores by the liquid water. To implement this approach we use a continuously differentiable form of
hdv =κd(1−s)λ
1+|Cd−C
∗
d| Cd−C∗d
+κd(1−s)λ
1−|Cd−C
∗
d| Cd−C∗d
Table 1
A list of model parameter values
Symbol Quantity Size References
L Catalyst layer thickness 22.5m
Lm Membrane thickness 62.5m
LG Cathode GDL thickness 200m
Ta(Tc) Anode (cathode) channel temperature 70◦C
aw,c(aw,a) Cathode (anode) channel water activity 1 (1) ¯
C Total gas concentration in cathode channel Pc/(RTc) mol m−3 ¯
Cp Oxygen concentration in cathode channel 0.05 ¯Cmol m−3
Pc Gas pressure in the cathode channel 30 psig (206.842 kPa)
p Volume fraction of primary pores 0.6 [10–12]
i
e Electrolyte volume fraction in agglomerates 0.2 [10–12]
a Volume fraction of C, Pt and small pores 0.3 [10–12]
g Porosity of the GDL 0.75 [49]
cO2,ref Reference oxygen concentration 4.55 mol m−3 [6]
Dl Oxygen diffusivity in liquid water (60◦C) 4.82×10⁻⁹m2s−1 [37]
αc Cathodic transfer coefficient 0.55
αa Anodic transfer coefficient 0.45
E0 Open circuit potential 0.95 V
Dag Agglomerate diameter=2Rag 0.4m [10–12]
δ0 Electrolyte film thickness without swelling 15 nm [17]
N Number of agglomerates per unit volume 1.257×10¹⁹m−3 Est.
apt Specific surface area of Pt 1000 cm2(mg Pt)−1 [50]
mpt Pt loading 0.4 (mg Pt) cm−2 [3]
hpe Oxygen mass transfer rate 105s−1 Est.
H O2Henry’s law constant (dimensionless) 0.3 [51]
κa(κd) Absorption (desorption) constant 10−5/9 (10−5/3) m s−1 [2]
θc c(θ
g
c) CCL (GDL) contact angle 90◦(120◦) ([33])
κc(κg) Absolute permeability of CCL (GDL) 10−13(8.7×10⁻¹²) m2 [52]([49])
µl Liquid-water viscosity 10−3Kg m−1s−1 [4]
σ Surface tension 0.07 N m−1 [4]
k Thermal conductivity of CCL 2 W m−1K−1 [29]
km Thermal conductivity of membrane 1 W m−1K−1 [29]
kG Thermal conductivity of GDL 4 W m−1K−1 [29]
Liquid-water removal constant 0.075 m−1 Fitted
iO2,c Reference cathode exchange current density 40 A m−2 Fitted
ρlCl Heat capacitance of water 4.184×10⁶J m−3K−1 Est.
−δs Entropy associated with ORR 162.2 J mol−1K−1 [53]
3.1.2. Schroeder’s paradox
It is well known that the water contentλdepends on the water activity,aw=XvP/Psat. The precise relationship was correlated by Hinatsu et al. in[43],
λv=λa=0.3+10.8aw−16a2w+14.1a3w (at 353 K), (30) which has a maximum ofλv=9.1 at equilibrium with vapour. However, when the electrolyte is submerged in liquid water its equilibrium water content appears to jump discontinuously to a higher value, which, following[44], we take to beλ=16.8.
In an attempt to capture this anomaly, known as Schroeder’s paradox, we define a critical saturation,s∗, at which the agglom-erates are entirely coated with liquid water and equilibrium with liquid water is achieved. This critical value isapproximatedas theimmobile saturation, below which the water mass is not con-tinuous (and therefore does not flow). We point out that this is an approximation, based on the assumption that the electrolyte is continuously covered by water fors > s∗. We use the value ofs∗=0.1 given in[32], and refer to that paper for references related to its measurement. The water content at the boundary between the CCL and membrane is kept continuous by
enforc-ing equilibrium between the membrane and liquid water when s(L2)=s∗. Alternatively, we may assume that the water content in the membrane drops continuously to a vapour-equilibrated value atx=L3, but this does not qualitatively alter the results. We therefore make the simpler choice and avoid further assump-tions in specifying the rate of decrease.
A list of parameters and their values can be found inTable 1.
3.2. Reaction rate and limiting current density
The ORR rate (in mol m−3s−1) is given by the Butler-Volmer law and first-order kinetics in oxygen concentration:
R(ηc, T, Cse)= aiO2,c FcO2,refeC
s e
eαaFηc/RT −e−αcFηc/RT
, (31)
whereiO2,cis the cathode exchange current density,αaandαcare the anodic and cathodic transfer coefficients,cO2,refis a reference oxygen molar concentration,ais the surface area of catalyst per unit volume of catalyst layer,ηc is the overpotential andRis the universal gas constant (8.314 J mol−1K−1)). The quantitya
thickness,L:
a=aptmpt/L.
However, theactiveplatinum surface area is much more diffi-cult to characterize. The overpotential,ηc, is defined precisely through the relationship:
ηc=Uc−E0−φ, (32)
whereUcis the potential of the carbon matrix (constant by as-sumption) and E0 is the so-called open circuit potential, as-sumed constant. The value of oxygen concentration in the Butler-Volmer expression,(31), ought to reflect accurately that reaction takes place at the surfaces of the carbon agglomerates. The con-centration at these surfaces,Cse, is generally different from the bulk value in the electrolyte, particularly given the restricted diffusion of oxygen.Cse can be related to the bulk value,Ce, by balancing the rate of reaction with the rate of diffusion of oxygen to the surface of the agglomerates (at steady state). This mass balance can be approximated as follows:
γ(Ce−Ces)= 1
4R(ηc, T, C s
e), (33)
where γ is the rate of oxygen diffusion through the elec-trolyte/water film to the surface of the agglomerates (in s−1). Using the definition ofR(ηc, T, Cse) and solving the resulting equation forCsethen yields:
Cse=
γCe
γ+ereαaFηc/RT −e−αcFηc/RT where
r= aiO2,c 4FcO2,ref,
(34)
so that the final form of the reaction rate is
R(ηc, T, Cs
e)≡R(ηc, T, Ce) = γerCe
eαaFηc/RT −e−αcFηc/RT
γ+ereαaFηc/RT −e−αcFηc/RT. (35)
In order to relate the diffusion rate γ to the microscopic properties of the CCL, we define an electrolyte film thickness, δe, an agglomerate radius,Rag, and the number of agglomerates per unit volume,N:
γ(Ce−Ces)≈A De
δe(Ce−C s e)
molar flux
so that γ= ADe δe , (36)
whereAis the specific surface area of agglomerates (we assume that all of the surface area is covered, whereuponA=4πR2agN). The volume of electrolyte attached to the surface of each agglom-erate isfe/N, which, from our assumptions, covers the entire surface of the agglomerate. The thicknessδe0(without swelling) andf0are therefore related as follows:
δe0=
R3ag+ 3f0 4πN
1/3
−Rag. (37)
The electrolyte swelling results in a volume change equal to (per agglomerate) (fe−f0)/N. The electrolyte film thickness is then given by
δe=
(Rag+δe0)
3+3(fe−f0) 4πN
1/3
−Rag. (38)
Whens > s∗, as previously defined, the liquid water present in the catalyst layer will provide additional resistance to the oxygen, with a different diffusion coefficientDl. Given the hy-drophilic nature of the electrolyte, we assume that any liquid water coats the entire surface of the agglomerates. Based on these assumptions, the thickness of the water layer is given by
δl=
(Rag+δe)3+ 3sp 4πN
1/3
−Rag, (39)
with a total film thickness
δ=δe+δl (40)
The quantityγthen has to be modified; it is decomposed into a term arising from diffusion through the water layer,γl, and a term of the type described above,γe. To approximate the concen-tration of oxygen at the agglomerate surfaces two balances need to be performed, one for diffusion through the water, to relate the bulk concentration to concentration at the water/electrolyte interface, and one between diffusion through the electrolyte and reaction, to relate the latter concentration toCse. The reaction rate then takes the form(35)with
γ= γ
lγe γl+γe
, where γl= ADl
δl ,
γe = ADe
δe , A
=4π(Rag+δe)2
N. (41)
The Henry constantHwould likewise require modification. It is approximately 0.3 for water under typical operating condi-tions, and was assigned the value 0.15 for Nafion in[27]. For simplicity, we assume the water-based value throughout and ap-proximate it as a constant.
Note that the quantityNis a function of both the radius of the agglomerates and their distribution, for example, the more densely packed the agglomerates the largerN.
The current flow is the reverse of the H3O+flow, so that the current density,IA m−2, is
I=4Fr L
0
γeCeeαaFηc/RT −e−αcFηcRT
γ+ereαaFηc/RT −e−αcFηc/RTdx. (42)
3.3. Membrane
We now describe the equations employed in the membrane, L2< x < L3, within which we assume that oxygen and vapour do not exist, i.e., the membrane is impenetrable to both. The membrane potential is modelled in a manner similar to the elec-trolyte potential in the CCL, Eq.(8),
−d dx
σe
F dφ
dx +DHCd dCH
dx
whereσeandDH were previously defined. The movement of water in the membrane is either as a dissolved species or pos-sibly by convection as a liquid, the latter depending on the state of the membrane. It has been postulated by Weber and Newman,[45], that the convective movement increases with in-creased water content because the membrane walls are inflated by the action of the water. However, as Mazumder demon-strates in[46], the role of convection is typically outweighed by both diffusion and electro-osmotic drag, even when a pres-sure increase of 2 atm from anode to cathode is maintained. We therefore neglect it, particularly since we will not consider such substantial pressure drops. The equation for dissolved water is then
−d dx
DddCd
dx + 5 44Fνλσe
dφ dx
=0. (44)
The equation for temperature now involves only a conduction term and ohmic losses
−d dx kmdT dx =σe dφ dx 2 , (45)
wherekmis the effective thermal conductivity of the membrane. At the interface between the membrane and CCL a further con-dition is enforced to ensure the continuity of the water content, λ. This condition was discussed above.
3.4. Gas diffusion layer
In the GDL, 0< x < L1, we specify balances for the masses of oxygen, nitrogen, vapour and liquid water, together with an energy balance. Equations for the first two are
−d dx
DGp(1−s) dCp dx =− d dx
DGN(1−s) dCN
dx
=0, (46)
whereDpGandDGNare the effective molecular diffusion coeffi-cients for oxygen and nitrogen in the GDL, andgis the GDL porosity.
The equation for vapour concentration is
−d dx
(1−s)DGv dCv1
dx
= −hpc(RTCv−Psat),
(47)
whereDGv is the effective molecular diffusion coefficient for vapour in the GDL.DGp, DGN andDGv are approximated as in (4) and (17)(withpreplaced withg), evaluated at the cathode channel conditions. The phase-change term on the right-hand side of(47)is defined as in(25) and (26), withpreplaced with g.
The energy equation balances conduction, convective heat flow arising from the liquid water motion and heating from phase change,
−d dx
kGdT
dx −sgρlClvlT
=hglhpc(RTCv−Psat), (48)
wherekGis the effective thermal conductivity of the GDL.
Finally, the equation for liquid water is
− ρl µlWl d dx gκl(s) −dpc ds ds dx + dP dx =−hpc(RTCv−Psat), (49) with
pc=σgJ(s), κl(s)=κgs3, σg=σcosθcg
g
κg, (50)
where κg is the absolute permeability of the GDL andθcg is the contact angle (π/2< θcg< π). The Leverett function for a hydrophobic medium, for which the wetting phase is the gas phase, is given by
J(s)=1.417s−2.12s2+1.262s3. (51)
3.5. Boundary conditions
For the discussion of the boundary conditions we recallFig. 1, which depicts the geometry. At the interface between the mem-brane and CCL,x=L2, the fluxes of oxygen (in the pores), water vapour, nitrogen and liquid water are taken to be zero; that is, these species are assumed not to penetrate the mem-brane. It is possible that small amounts of the dissolved oxygen reach the anode and small amounts of hydrogen reach the cath-ode. These are primarily degradation issues, which are dealt with in a forthcoming paper. Since protons have no effective transport mechanism in the GDL, the flux of protons at the in-terface between the GDL and CCL,x=L1, is zero. Similarly, the dissolved-water and oxygen fluxes must be zero atx=L1 in order to ensure their continuity:
dCe dx =Dd
dCd dx + 5 44Fνλσe dφ dx = dφ
dx =0, x=L1 dCp dx = dCe dx = dCv dx = ds
dx =0, x=L2.
(52)
At the interface between the cathode channel and the GDL interface,x=0, the oxygen and vapour concentrations are pre-scribed. At the membrane/ACL interface,x=L3, the membrane potential is approximated as zero
Cp(0)=Cp,¯ Cv(0)=Cv,¯ φ(L3)=0. (53)
The value of ¯Cvis calculated from the water activity of the cathode channel, aw,c, which is defined as ¯XvPc/Psat, where
¯
Xvis the molar fraction of vapour in the cathode channel,Pc is the cathode-channel gas pressure andPsat,cis the cathode-channel saturation pressure. The saturation pressure, a function of temperature, is given by the formula in[39]:
log10Psat= −2.1794+0.02953(T −273)−9.1837 ×10⁻⁵(T −273)2+1.4454×10⁻⁷(T−273)3.
(54)
From these relationships we derive ¯Cvas follows:
¯
Cv= RTcPsat,c Pc
¯
where ¯Cis the total gas molar concentration in the cathode chan-nel, calculated from the cathode-channel pressure:
¯ C= Pc
RTc. (56)
The dissolved-water concentration at the membrane/ACL in-terface is assumed to be in equilibrium with the vapour-phase concentration ifs(L2)< s∗, and to be in equilibrium with water if s(L2)≥s∗. The water activity at x=L2,aw,a, is approxi-mated by the anode-channel value (since water is not produced in the ACL), yielding the following expression forCd:
λ=λa=0.3+10.8aw,a−16a2w,a+14.1aw,a3 , Cd(L3)= λa
1+0.0126λa. (57)
In the cathode channel the temperature is prescribed. The flux of heat atx=L3is approximated using the anode channel temperatureTa. We assume that the heat flux is constant across the anode GDL and ACL, yielding:
T(0)=Tc, kmdT dx(L3)=
kG
LG(Ta−T(L3)). (58) We are assuming the that the anode gas diffusion layer is identical to that on the cathode side. This is not necessarily so and this assumption can easily be relaxed.
The final boundary condition is that for the liquid water at the interface between the cathode channel and the GDL. It is common in modelling studies, for example[3,5–7], to assume either a zero saturation or zero liquid-water flux at this location, or along portions of the channel/GDL interface in two dimen-sions. In [47], Weng and Wang specify the saturation at the GDL/channel interface, which, as they state, is likely to depend sensitively on the gas flow in the channel, current density and wettability. According to their results, high levels of saturation are possible only if the prescribed value at the boundary is high or the GDL permeability is unrealistically small. In our model, the counterpart to this boundary condition depends on the gas flow and wettability, and is written as a flux. We show that high saturation levels are possible within a broad range of realistic parameter space.
The accumulation and removal of liquid water along the chan-nel is a complicated process. Water is expelled from the GDL through preferential openings and forms droplets attached to the surface. These droplets can grow or coalesce to a form larger droplets comparable in size to the channel dimensions, which results is the formation of a liquid film,[48]. Ultimately, the film is wicked along the channel walls toward the exit. The greater the flow velocity in the channel, the more effective the removal of liquid water. A detailed model of this process, accounting for the surface properties of the GDL, phase change, surface ten-sion, two dimensional gas flow and hydrophilicity of the chan-nel walls, is clearly a challenge in its own right that will not be attempted here. Instead, we approximate the process with the following steady-state flux condition atx=0:
ds
dx(0)−s(0)=0, (59)
where=0 corresponds to zero water removal. This form is motivated in two ways. Firstly, there should be no removal at zero saturation. Secondly, the parametercan be seen naturally as (in an average sense) the reciprocal of a water film thickness on the surface of the GDL. When this thickness approaches zero, the saturation is physically zero, which is expressed by 1/→0 in Eq.(59). The thickness, and therefore, is likely to depend sensitively on the flow rate in the channel,[48](also by analogy with the theory of Ekman transport in ocean modelling).
4. Experimental details
The fuel cell was prepared with carbon fibre paper (GDL), carbon supported Platinum catalyst and Nafion membrane, with a 50 cm2 anode geometric area and a masked cathode with a 4 cm2 geometric area. The MEA and cell hardware were de-signed to minimize any temperature, pressure and concentration gradients in the cell. The small cathode geometric area ensures minimal heat generation and concentration change along the length of the flow-field channels. To further ensure that there was no concentration change along the length of the flow field, we used a stoichiometry of greater than 60 (compared to a nor-mal operating value of approximately 2). Thus, the design was such that variations were predominantly through the MEA, and therefore one-dimensional. Note also that the flow rate was the same in all cases.
Using a load bank, a series of polarization curves were pro-duced under varying conditions to demonstrate the change in the polarization losses relative to oxygen concentration, water activity and temperature.
The oxygen concentration was varied between 3% and 5%, balanced in nitrogen. A separate investigation was performed at the same concentrations with oxygen balanced with helium. These results are not discussed here.
Three different water activity conditions were tested at a cell temperature of 70◦C:aw=0.6 anode/aw=0.7 cathode,aw= 0.7 anode/aw=0.8 cathode, and aw=1 on both anode and cathode. Three different cell temperatures were tested ataw=1 to validate the effect of temperature on performance: 70, 45 and 25◦C. Only results pertaining to the first are discussed here.
5. Numerical results
5.1. Finite element solution strategy
Fig. 4. Electrolyte potential and oxygen concentration profiles corresponding toaw=1 inFig. 7, as the cell potential is decreased.
In order to compare the modelling with the experimental re-sults, all parameter values were fixed as specified below with the exception of the exchange current density,iO2,c. The latter was
then adjusted to match the experimental data displayed inFigs. 6 and 7. This fitting was required only once, i.e.,iO2,c=40 A m−2 in both figures. The motivation for this fitting procedure stems from the lack of a consistent value foriO2,c in the literature (426 A m−2in[41]and 1.5×10⁻⁴A m−2in[26]). Similar dis-crepancies exist in the values of the transfer coefficients and cO2,ref. The difficulties associated with measuring or estimat-ing these quantities are numerous. For example,iO2,cchanges from one cathode structure to another (active surface area of platinum), as well as with temperature. The value we derive for iO2,cfalls well within the broad range of values that appear in the literature. A more detailed discussion of the issues surrounding the measurement of these quantities can be found in[54]and [55].
It should be mentioned thatwas fixed at 0.075 m−1. Since a value foris difficult to determine theoretically, we later present a parametric study of its effect. The flow rate in the cathode
channel is assumed to be constant (as in the experiments), which justifies the use of a constantin all calculations.
5.2. Experimental validation
For the modelling results of this section, the parameters values that were used are shown in Table 1, unless otherwise stated.
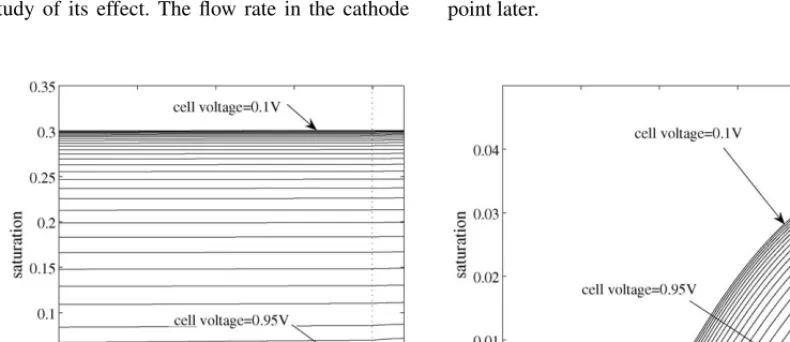
We begin with the set of results demonstrated inFigs. 4 and 5, the first of which shows profiles of electrolyte potential and oxygen concentration as the cell voltage (approximated by the carbon potentialUc) is decreased from 0.95 to 0.1 V. In the cal-culations, both channels are ataw=1 and 70◦C, and the oxygen concentration in the cathode channel is 5% of the total. The sec-ond figure shows the saturation levels for both the case above and withaw=0.7 anode/aw=0.8 cathode, indicating the ef-fect that the water activity in the channels has on the flooding of the cathode: that saturation levels can be high at low cell voltage and with high water activity in the channels. We return to this point later.
[image:11.637.110.505.545.716.2]Fig. 6. Comparison of the modelling and experimental polarization curves at 5 and 3% oxygen concentration (seeTable 1for a full list of parameter values).
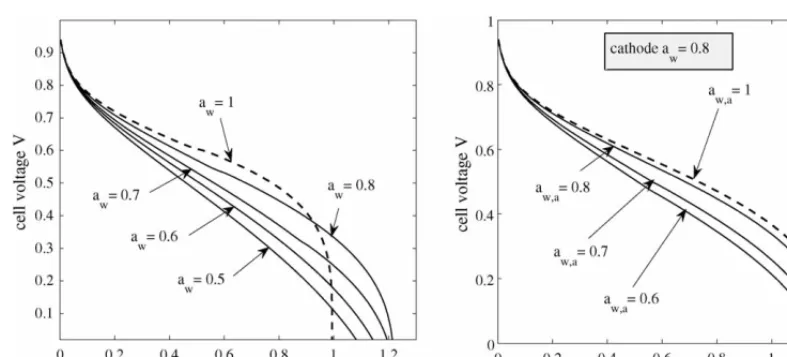
To demonstrate the comparison between the modelling re-sults and those of the experimental procedure described in the previous section, we refer toFigs. 6 and 7. The first of these fig-ures shows the polarization curves at two different oxygen con-centrations, withaw =0.7 anode/aw=0.8 cathode. The sec-ond figure shows polarization curves at two different values of water activity in the channels, with a 5% oxygen concentration. In both of these figures, the conditions not specified are as in Table 1, except that the thickness of the CCL is 25m.
The agreement between the modelling results and the exper-imental data is excellent. The second figure clearly underlines the ability of the model to capture the impact of water on both the membrane and CCL/GDL. The modelling and experimental results strongly suggest that the increased hydration of the mem-brane at high water activity leads to improved performance at high and mid-range cell voltages. However, as the current
den-Fig. 7. Comparison of the modelling and experimental polarization curves for twoawconfigurations at 5% concentration of oxygen (seeTable 1for a full list of parameter values).
sity increases so does the water generated in the CCL, which leads to significant oxygen diffusion limitation from flooding, and ultimately to a better performance at low water activity. These features are very well captured by the model. Below we say more on the effects of changes in the channel water activity, particularly when coupled to changes in the channel tempera-tures.
5.3. Effects of GDL and CCL structures
The magnitudes of the permeabilities,κcandκg, and capillary diffusion coefficients,σcandσg, are subject to a great deal of uncertainty. The effect that changes in these quantities have on the flooding behaviour, and therefore performance, are not well understood. In this subsection make an attempt to quantify the liquid-water effects as these quantities are varied. The benefit of such information is clearly in predicting the performance of different media, namely in the GDL and CCL, whose proper-ties can be classified in relation to contact angle (hydrophobic-ity/hydrophilicity), permeability and porosity. Let us return to thedefinitions (21), (22) and (50)and now define the quantities:
dc= κcσc
µ , dg= κgσg
µ . (60)
Changes in these quantities can arise from changes in several underlying parameters, namely the absolute permeabilities,κc andκg, the porosities,pandg, and the contact anglesθcand θg. The permeabilities can be decomposed using the Kozeny-Carman relation,[32],
κc= 3 pdp,c2
16Kc(1−p)2, κg=
3gdp,g2
16Kg(1−g)2, (61) wheredp,c anddp,g are the mean pore diameters in the CCL and GDL, respectively. Kc and Kg are the so-called Kozeny constants. Ultimately
dg∝dp,g, dg∝cosθgc, dg∝ 2g
1−g, (62)
so thatdgincreases with increasing porosity, contact angle (in the hydrophobic range) and mean pore diameter of the GDL. The same is true fordcexcept that adecreasein the contact angle, θcc, leads to an increase indc. Thus, the results obtained from varyingdganddccontain a quite general degree of information. For typical values (those used by Mazumder,[4]),dgis of the order 10−4–10−5. In the CCL, where the pores are much smaller (O(10−7m)),dcis likely to be one or two orders of magnitude smaller thandg.
[image:12.637.40.279.512.705.2]Fig. 8. The effect on the maximum saturation and current density at 0.1 and 0.6 V of changes in the contact angles, absolute permeabilities and porosities of the CCL and GDL.dganddcare defined in(60)and both channels are ataw=1.
changes indc, at fixeddg, particularly on the minimum satura-tion. It can further be seen that for a fixeddc there is a lower limit to the saturation and an upper limit to the current density asdgis increased. The difference in the lower limit of maximum saturation asdcis increased is quite appreciable, but the effect on the current density, measured at both 0.1 and 0.6 V, is neg-ligible. It appears then that changes in the contact angle, pore radius and porosity in the GDL have a far greater impact than changes in the same quantities in the CCL (possibly because of the far greater thickness of the GDL). In fact they can alter the accumulation of liquid water and consequently the performance quite dramatically.
We note finally that in the range−8.5<log10dg<−6, the current density measured at 0.6 V does not decrease as rapidly as the current density at 0.1 V. This appears once more to be the consequence of the competition between flooding and hydration of the membrane.
5.4. Effects of GDL and membrane thickness
The effects of membrane and GDL thickness changes can be inferred fromFig. 9. For these calculations both channels are ataw=1 and other parameters are given inTable 1, unless otherwise stated. The left-hand figure demonstrates the polar-ization curves for an increasing range of membrane thickness, with a GDL thickness of 200m. It can be seen from the right-hand figure that decreasing Lm improves the performance by increasing the slope of the polarization curve. Quite substantial improvements are possible. The right-hand figure demonstrates that decreasing the GDL thickness improves performance. Inter-estingly, this is despite a simultaneous increase in the maximum saturation. This implies that improving the oxygen supply to the CCL, by reducing the mass-transport resistance from the GDL, can to some extent mitigate the effects of flooding, another ex-ample of the competing effects in the MEA.
Fig. 9. The left-hand figure shows the polarization curves for a decreasing range of membrane thickness, with a GDL thickness of 200m and both channels at
[image:13.637.106.502.532.706.2]Fig. 10. The effect on the performance of changes in the channel water activity, when maintained at the same value in both channels (left figure) and at different values (right figure).
5.5. Effects of water activity
InFig. 10we plot the polarization curves for several values of water activity in the channels. The left-hand figure demon-strates that changes in water activity, with the same values in both channels, have a convoluted effect on the performance. At fully humidified conditions the effects of flooding are strongly felt at low cell voltages. However, the performance at high and mid-range voltages is good. At lower humidification lev-els down to approximatelyaw=0.8 the performance improves at low cell voltages, with minor deterioration at higher voltages. However, when the water activity is reduced further, the per-formance deteriorates, particularly at high and mid-range cell voltages but also now at lower cell voltages (compared toaw= 0.8).
Maintaining the cathode-channel water activity and varying that for the anode channel leads to the polarization curves in the right-hand plot ofFig. 10. The best performance is seen at aw,a=1, with only a minor deterioration down toaw,a=0.8. Once below this value, the increased resistivity of the mem-brane degrades the performance substantially, particularly at mid-range cell voltages.
5.6. Combined effects of temperature and water activity
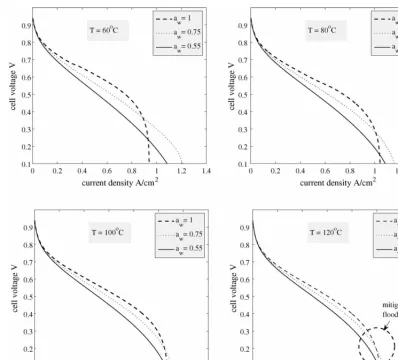
Fig. 11demonstrates the effects of simultaneous changes in the operating temperatures and water activities, at constant pres-sure in the channels. It appears that at as we increase temperature, changes in water activity are less strongly felt. AtT =60◦C, significant improvements in performance are possible at mid-range and high cell voltages if the water activity of the channels is high, as already seen in the previous subsection. AtT =120◦C, while improvements are still possible, they are not as dramatic. One implication of this result is that in some measure it is possi-ble to mitigate the effects of flooding (dramatic deterioration in performance at low cell voltage) by increasing the temperature in the channels, and therefore the average temperature of the
system. InFig. 12we see the reason for this. AtT =60◦C the saturation levels are high at low cell voltage, causing the drop in performance seen inFig. 11. However, due to decreased con-densation, atT =120◦C even at low cell voltage the saturations levels are too low to lead to flooding.
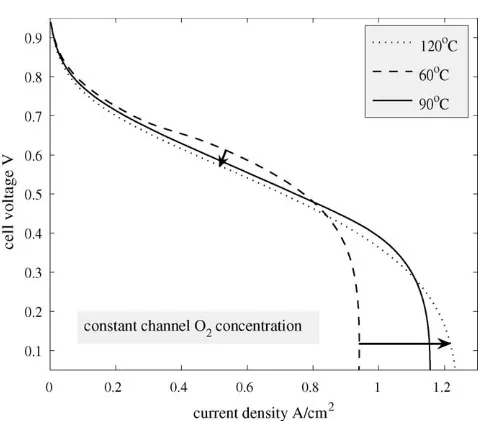
We note that inFig. 11, the gas pressure in the channel is constant, so an increase in temperature leads to a decrease in the molar density of the gas, and therefore in total oxygen avail-able. More importantly, an increase in temperature causes a substantial increase in the saturation vapour pressure at high temperatures. At fixed water activity, there are correspondingly large increases in the vapour density.Fig. 13shows the polar-ization curves ataw =1 as the temperature is increased from 60 to 120◦C, while the gas pressure, Pc, and the concentra-tion of oxygen in the cathode channel, ¯Cpare kept constant at 30 psig (206.842 kPa) and 3.75 mol m−3, respectively. We see that the current density increases dramatically at low cell volt-age because of the reduction in the saturation levels. At higher cell voltages the performance deteriorates, but not substantially, possibly because of the increase in the vapour density and its corresponding effect on the membrane conductivity.
5.7. Effects of water removal from channel
Fig. 11. The effect on the performance of combined changes in the channel water activity and temperature (both channels at the same water activity).
6. Discussion
Capturing the effects of (particularly liquid) water is a non-trivial issue in PEMFC modelling. In this paper we have provided the outline of a model that incorporates many of the difficult aspects associated with these effects. In doing so, we found it necessary to explicitly include many of the MEA features that are often subject to approximation, such as a detailed catalyst layer model, temperature variations and the multi-phase nature of the problem.
We have demonstrated through comparison with experi-ment that the model we have developed qualitatively captures the correct behaviour with respect to flooding and membrane hydration (see Fig. 7). This result, which appears to be ab-sent in previous modelling studies, underlines the competi-tion between hydracompeti-tion of the membrane and flooding, and is clearly an effect which has to be captured in any model that is aimed at predicting or aiding water management. To show the benefits of our modelling approach we performed several studies focussed on water management, particularly with re-gard to the effects that micro-structure and operating condi-tions have on performance. We now highlight a few of our findings:
(1) From the results depicted in Fig. 8 and the relation-ships(60)–(62), it appears that the most influential micro-structural property to affect saturation levels is the pore di-ameter,dp,g for the GDL and dp,c for the CCL. Provided that they do not approach extreme values (θcc, θcg→90◦), the contact angles play only a minor role since the maxi-mum saturation is quite insensitive to changes indcanddg that are not at least an order of magnitude. Nevertheless, combined changes in the microstructural properties of the GDL can be employed to improve performance quite sub-stantially.
(2) Reducing the thickness of the membrane improves perfor-mance. However, this practice must be treated with cau-tion. If the thickness is reduced by too much, oxygen and hydrogen cross-over will also increase and will lead to se-vere degradation. Likewise, decreasing the GDL thickness improves performance, with the increased oxygen supply outweighing the increased saturation levels.
approach-Fig. 12. Saturation profiles corresponding to the calculations ataw=1 inFig. 11. ing unity in both channels, the flooding becomes an issue if
the cell is operated at low voltage. However, at mid-range voltages, above approximately 0.4 V, the performance is op-timized ataw=1.
(4) If the cell is operated at water activities in the channel that are close to unity, temperature can be used in some measure to offset the effects of flooding by lowering the condensa-tion rate and therefore the saturacondensa-tion levels (see Figs. 11 and 12). FromFig. 13we see that performance at low cell voltages can therefore be enhanced significantly, while the corresponding deterioration in performance at higher cell voltages is minor. The latter result is possibly due to the in-creased vapour molar concentration at higher temperature and the corresponding improvement in membrane conduc-tivity.
[image:16.637.96.493.63.431.2](5) Fig. 14suggests that at high water activity significant per-formance improvements can be made by increasing the re-moval rate of liquid water from the cathode channel, which although not solely controlled by, is directly linked to the flow rate of gas down the channel. Under these conditions, if no liquid water is removed (=0) flooding severely im-pacts the current density at low cell voltage. The greater the removal of the liquid water the higher the current density at
[image:16.637.308.549.490.701.2]Fig. 14. The effect of the removal constant, defined in(59), on the maximum saturation and the current density measured at 0.1 and 0.6 V. Both channels are ataw=1.
low cell voltage, which eventually plateaus asincreases. Furthermore, the performance at higher cell voltage is not dramatically affected as the removal increases (seeFig. 15).
Though we have concentrated on water effects in this paper there are several other aspects to the model that can be exploited. For example, a parametric study with respect to the microstruc-tural properties of the CCL and conditions under which proton migration is limiting. Our purpose has been to demonstrate the ability of the model to capture complex phenomena. There are several extensions to the model that we are currently pursuing. In order to study effects such as hydrogen and oxygen (as well as water) crossover, the anode catalyst and gas-diffusion layers must be included. In addition, extension to two dimensions will provide details of the non-uniformities down the channels.
Fig. 15. The effect on the polarization curve of changes in, the removal rate constant.
Acknowledgements
The authors are grateful to MITACS and Ballard Power Sys-tems for their financial support and experimental facilities. We would particularly like to acknowledge Dr. Jean St. Pierre (for-merly of Ballard Power Systems), Professor Brian Wetton and Dr. John Stockie (MITACS) for their involvement in the many fruitful discussions leading to this paper.
References
[1] J. Cao, N. Djilali, Computational simulation of water transport in PEM fuel cells using an improved membrane model, Proceedings of the 10th Canadian Hydrogen Conference (2000) 447–456.
[2] W. He, J. Yi, T.V. Nguyen, Two-phase flow model of the cathode of PEM fuel cells using interdigitated flow fields, AIChE J. 46 (10) (2000) 2053– 2064.
[3] G. Lin, W. He, T. Van Nguyen, Modelling liquid water effects in the gas dif-fusion and catalyst layers of the cathode of a PEM fuel cell, J. Electrochem. Soc. 151 (11) (2004) A1999–A2006.
[4] S. Mazumder, J.V. Cole, Rigorous 3D mathematical modelling of PEM fuel cells: 2 model predictions with liquid water transport, J. Electrochem. Soc. 150 (11) (2004) A1510–A1517.
[5] D. Natarajan, T.V. Nguyen, A two-dimensional, two-phase, multicompo-nent, transient model for the cathode of a proton exchange membrane fuel cell using conventional gas distributors, J. Electrochem. Soc. 148 (12) (2001) A1324–A1335.
[6] N.P. Siegel, M.W. Ellis, D.J. Nelson, M.R. von Spakovsky, Single domain PEMFC model based on agglomerate catalyst geometry, J. Power Sources 115 (1) (2003) 81–89.
[7] N.P. Siegel, M.W. Ellis, D.J. Nelson, M.R. von Spakovsky, A two-dimensional computational model of a PEMFC with liquid water transport, J. Power Sources 128 (1) (2004) 173–184.
[8] L.B. Wang, N.I. Wakayama, T. Okada, Numerical simulation of enhance-ment of mass transfer in the cathode electrode of a PEM fuel cell by magnet particles deposited in the cathode-side catalyst layer, Chem. Eng. Sci. 60 (2005) 4453–4467.
[9] Z.H. Wang, C-Y. Wang, K.S. Chen, Two-phase flow and transport in the air cathode of proton exchange membrane fuel cells, J. Power Sources 94 (2001) 40–50.
[10] S. Lister, G. McLean, Review: PEM fuel cell electrodes, J. Power Sources 130 (2004) 61–76.
[11] F. Liu, B. Yi, D. Xing, J. Yu, Z. Hou, Y. Fu, Development of novel self-humidifying composite membranes for fuel cells, J. Power Sources 124 (2003) 81–89.
[12] M. Uchida, Y. Aoyama, N. Eda, O. Akira, Investigation of the microstruc-ture in the catalyst layer and effects of both perfluorosulfonate ionomer and PTFE-loaded carbon on the catalyst layer of polymer electrolyte fuel cells, J. Electrochem. Soc. 142 (12) (1995) A4143–A4149.
[13] M. Uchida, Y. Fukuota, Y. Sugawara, H. Ohara, O. Akira, Improved preparation process of very-low-platinum-loading electrodes for poly-mer electrolyte fuel cells, J. Electrochem. Soc. 145 (11) (1998) A3708– A3713.
[14] A.Z. Weber, J. Newman, Modelling transport in polymer-electrolyte fuel cells, Chem. Rev. 104 (2004) 4679–4726.
[15] K. Broka, P. Ekdunge, Modelling the PEM fuel cell cathode, J. Appl. Elec-trochem. 27 (1997) 281–289.
[16] Q. Guo, R. White, A steady-state impedance model for a PEMFC cathode, J. Electrochem. Soc. 151 (4) (2004) E133–E149.
[17] F. Jaouen, G. Lindbergh, G. Sundholm, Investigation of mass-transport limitations in the solid polymer fuel cell cathode: I. mathematical model, J. Electrochem. Soc. 149 (4) (2002) A437–A447.
[image:17.637.50.288.515.716.2]