eurostat
ERLOSPREISE LANDWIRTSCHAFTLICHER
ERZEUGNISSE
UNIT VALUES OF AGRICULTURAL
PRODUCTS
VALEURS UNITAIRES DES PRODUITS
AGRICOLES
eurostat
STATISTISCHES AMT DER EUROPÄISCHEN GEMEINSCHAFTEN
STATISTICAL OFFICE OF THE EUROPEAN COMMUNITIES
OFFICE STATISTIQUE DES COMMUNAUTÉS EUROPÉENNES
L-2920 Luxembourg — Tél. (352) 43 01-1 — Télex COMEUR LU 3423
B-1049 Bruxelles, rue de la Loi 200 — Tél. (32-2) 299 11 11
Eurostat hat die Aufgabe, den
Informa-tionsbedarf der Kommission und aller am
Aufbau des Binnenmarktes Beteiligten
mit Hilfe des europäischen statistischen
Systems zu decken.
Um der Öffentlichkeit die große Menge an
verfügbaren Daten zugänglich zu machen
und Benutzem die Orientierung zu
erleichtem, werden zwei Arten von
Publi-kationen angeboten: Statistische
Doku-mente und Veröffentlichungen.
Statistische Dokumente sind für den
Fachmann konzipiert und enthalten das
ausführliche Datenmaterial:
Bezugs-daten, bei denen die Konzepte allgemein
bekannt, standardisiert und
wissenschaft-lich fundiert sind. Diese Daten werden in
einer sehr tiefen Gliederung dargeboten.
Die Statistischen Dokumente wenden
sich an Fachleute, die in der Lage sind,
selbständig die benötigten Daten aus der
Fülle des dargebotenen Materials
auszu-wählen. Diese Daten sind in gedruckter
Form und/oder auf Diskette,
Magnet-band, CD-ROM verfügbar. Statistische
Dokumente unterscheiden sich auch
optisch von anderen Veröffentlichungen
durch den mit einer stilisierten Graphik
versehenen weißen Einband.
Veröffentlichungen wenden sich an eine
ganz bestimmte Zielgruppe, wie zum
Beispiel an den Bildungsbereich oder an
Entscheidungsträger in Politik und
Ver-waltung. Sie enthalten ausgewählte und
auf die Bedürfnisse einer Zielgruppe
abgestellte und kommentierte
Informa-tionen. Eurostat übernimmt hier also eine
Art Beraterrolle.
Für einen breiteren Benutzerkreis gibt
Eurostat Jahrbücher und periodische
Veröffentlichungen heraus. Diese
enthal-ten statistische Ergebnisse für eine erste
Analyse sowie Hinweise auf weiteres
Datenmaterial für vertiefende
Unter-suchungen. Diese Veröffentlichungen
werden in gedruckter Form und in
Daten-banken angeboten, die in Menütechnik
zugänglich sind.
Um Benutzem die Datensuche zu
erleich-tem, hat Eurostat Themenkreise, d. h.
eine Untergliederung nach Sachgebieten,
eingeführt. Daneben sind sowohl die
Statistischen Dokumente als auch die
Veröffentlichungen in bestimmte Reihen,
wie zum Beispiel „Jahrbücher",
„Kon-junktur", „Methoden", untergliedert, um
den Zugriff auf die statistischen
Informa-tionen zu erleichtem.
Y. Franchet
It is Eurostat's responsibility to use the
European statistical system to meet the
requirements of the Commission and all
parties involved in the development of the
single market.
To ensure that the vast quantity of
ac-cessible data is made widely available,
and to help each user make proper use of
this information, Eurostat has set up two
main categories of document: statistical
documents and publications.
The statistical document is aimed at
spe-cialists and provides the most complete
sets of data: reference data where the
methodology is well-established,
stand-ardized, uniform and scientific. These
data are presented in great detail. The
statistical document is intended for
ex-perts who are capable of using their own
means to seek out what they require. The
information is provided on paper and/or
on diskette, magnetic tape, CD-ROM. The
white cover sheet bears a stylized motif
which distinguishes the statistical
docu-ment from other publications.
The publications proper tend to be
com-piled for a well-defined and targeted
public, such as educational circles or
political and administrative
decision-makers. The information in these
docu-ments is selected, sorted and annotated
to suit the target public. In this instance,
therefore, Eurostat works in an advisory
capacity.
Where the readership is wider and less
well-defined, Eurostat provides the
infor-mation required for an initial analysis,
such as yearbooks and periodicals which
contain data permitting more in-depth
studies. These publications are available
on paper or in videotext databases.
To help the user focus his research,
Eurostat has created 'themes', i.e. subject
classifications. The statistical documents
and publications are listed by series: e.g.
yearbooks, short-term trends or
method-ology in order to facilitate access to the
statistical data.
Y. Franchet
Director-General
Pour établir, évaluer ou apprécier les
dif-férentes politiques communautaires, la
Commission européenne a besoin
d'infor-mations.
Eurostat a pour mission, à travers le
sys-tème statistique européen, de répondre
aux besoins de la Commission et de
l'en-semble des personnes impliquées dans
le développement du marché unique.
Pour mettre à la disposition de tous
l'im-portante quantité de données accessibles
et faire en sorte que chacun puisse
s'orienter correctement dans cet
ensem-ble, deux grandes catégories de
docu-ments ont été créées: les docudocu-ments
statistiques et les publications.
Le document statistique s'adresse aux
spécialistes. Il fournit les données les plus
complètes: données de référence où la
méthodologie est bien connue,
standar-disée, normalisée et scientifique. Ces
données sont présentées à un niveau très
détaillé. Le document statistique est
des-tiné aux experts capables de rechercher,
par leurs propres moyens, les données
requises. Les informations sont alors
disponibles sur papier et/ou sur disquette,
bande magnétique, CD-ROM. La
couver-ture blanche ornée d'un graphisme stylisé
démarque le document statistique des
autres publications.
Les publications proprement dites
peu-vent, elles, être réalisées pour un public
bien déterminé, ciblé, par exemple
l'enseignement ou les décideurs
politi-ques ou administratifs. Des informations
sélectionnées, triées et commentées en
fonction de ce public lui sont apportées.
Eurostat joue, dès lors, le rôle de
conseil-ler.
Dans le cas d'un public plus large, moins
défini, Eurostat procure des éléments
nécessaires à une première analyse, les
annuaires et les périodiques, dans
les-quels figurent les renseignements
adé-quats pour approfondir l'étude. Ces
publications sont présentées sur papier
ou dans des banques de données de type
vidéotex.
Pour aider l'utilisateur à s'orienter dans
ses recherches, Eurostat a créé les
thèmes, c'est-à-dire une classification
par sujet. Les documents statistiques et
les publications sont répertoriés par
série — par exemple, annuaire,
conjonc-ture, méthodologie — afin de faciliter
l'accès aux informations statistiques.
ERLÖSPREISE LANDWIRTSCHAFTLICHER
ERZEUGNISSE
UNIT VALUES OF AGRICULTURAL
PRODUCTS
VALEURS UNITAIRES DES PRODUITS
AGRICOLES
1985-1993
Themenkreis / Theme / Thème
Land- und Forstwirtschaft, Fischerei / Agriculture, forestry and fisheries / Agriculture, sylviculture et pêche
Reihe / Series / Série
Konten und Erhebungen / Accounts and surveys / Comptes et enquêtes
Bibliographische Daten befinden sich am Ende der Veröffentlichung.
Cataloguing data can be found at the end of this publication.
Une fiche bibliographique figure à la fin de l'ouvrage.
Luxembourg: Office des publications officielles des Communautés européennes, 1995
ISBN 92-826-9835-1
© CECA-CE-CEEA, Bruxelles · Luxembourg, 1995
Reproduction autorisée, sauf à des fins commerciales, moyennant mention de la source.
Inhaltsverzeichnis
Seite
Seite
Verwendete Zeichen und Abkürzungen
Vorbemerkungen
Glossar in neun Sprachen
Umrechnungskurse in ECU
1. Erlöspreise landwirtschaftlicher
Erzeugnisse nach Mitgliedstaaten
1.01 Belgien
1.02 Dänemark
1.03.0 Deutschland vor dem 03.10.1990
1.03.1 Deutschland nach dem 03.10.1990
1.04 Griechenland
1.05 Spanien
1.06 Frankreich
1.07 Irland
1.08 Italien
1.09 Luxemburg
1.10 Niederlande
1.11 Portugal
1.12 Vereinigtes Königreich
2. Erlöspreise landwirtschaftlicher
Erzeugnisse nach Erzeugnissen
2.01 Getreide (ohne Reis)
2.02 Weizen
2.03 Weichweizen
2.04 Hartweizen
2.05 Roggen
2.06 Gerste
2.07 Hafer
2.08 Körnermais
2.09 Reis
4
5
21
25
29
35
39
44
47
53
59
65
69
77
81
87
91
96
98
100
102
104
106
108
110
112
2.10
2.11
2.12
2.13
2.14
2.15
2.16
2.17
2.18
2.19
2.20
2.21
2.22
2.23
2.24
2.25
2.26
2.27
2.28
2.29
2.30
2.31
2.32
2.33
2.34
2.35
2.36
2.37
2.38
2.39
2.40
2.41
2.42
2.43
Speiseerbsen
Gartenbohnen
Kartoffeln
Zuckerrüben
Ölsaaten
Rapssaat
Sonnenblumenkerne
Sojabohnen
Textilpflanzen
Tabak
Hopfen
Blumenkohl
Tomaten
Tafeläpfel
Tafelbirnen
Pfirsiche
Orangen
Mandarinen
Zitronen
Trauben
Traubenmost und Wein
Tafelwein
Qualitätswein
Oliven
Olivenöl
Rinder (ohne Kälber)
Kälber
Schweine
Einhufer
Schafe und Ziegen
Geflügel
Milch
Eier
Rohwolle
Verwendete Zeichen
und Abkürzungen
0
Nichts oder weniger als die Hälfte der verwendeten Einheit
Kein Nachweis vorhanden
ECU
t
B
DK
D11
D16
EL/GR
E
F
IRL
I
L
NL
Ρ
UK
Europäische Währungseinheit
Tonne
Belgien
Dänemark
Deutschland vor dem 03.10.1991
Deutschland nach dem 03.10.1990
Griechenland
Spanien
Frankreich
Irland
Italien
Luxemburg
Niederlande
Portugal
Gegenstand dieser Vorbemerkungen sind die Ziele und Eigenschaften ("nature") der neuen
Statistik der Erlöspreise landwirtschaftlicher Produkte. Die Zeitreihen der Erlöspreise, die zugleich
Preiselemente im eigentlichen Sinn sowie die den Produkten innewohnenden Eigenschaften
erfassen, stellen - gemeinsam mit den korrespondierenden vermarkteten Mengen - ein
grundlegendes Instrument für Wirtschaftsstudien, vor allem für die Arbeiten mit Modellen, dar.
1. Ziel der Erlöspreisstatistik
Die Entwicklung einer Statistik der Erlöspreise landwirtschaftlicher Erzeugnisse steht in
Zusam-menhang mit der Umstrukturierung der Statistik der absoluten Agrarpreise, für die sie ein
zusätzli-ches statistiszusätzli-ches Instrument darstellt. Sie liefert neue Informationen über die Merkmale der
Wert-änderungen bei den landwirtschaftlichen Erzeugnissen, die über die Preiselemente im
eigentli-chen Sinne hinausgehen (und über die Änderungen der homogenen physiseigentli-chen Mengen), und
ermöglicht dadurch eine Annäherung an die in der Landwirtschaftlichen Gesamtrechnung
gemes-senen und erfaßten wirtschaftlichen Größen. Mit Blick auf ihre Verwendung für
Wirtschaftsanalysen (und besonders für die Arbeiten mit Modellen) erschien es zweckmäßig,
auch Zeitreihen über die entsprechenden vermarkteten Mengen (Verkaufsmengen) zu erstellen
1.
2. Eigenschaften der Erlöspreise
Die Erlöspreise ergeben sich aus der Division eines Wertelements durch das entsprechende
Mengenelement und stellen somit keine Preise im eigentlichen Sinne dar. Neben den "reinen"
Preisbestandteilen spiegeln die Erlöspreise die Änderungen in den sonstigen Merkmalen wider,
die die Erzeugnisse bestimmen und die Preise beeinflussen können. Deshalb ist es zweckmäßig,
bestimmte Elemente im Zusammenhang mit dem Unterschied zwischen dem Preiskonzept und
dem Erlöspreiskonzept zu erläutern.
In der Gemeinschaftsstatistik der absoluten Preise wird der Preis eines Erzeugnisses definiert als
der Durchschnittswert einer Einheit dieses Erzeugnisses, dessen Eigenschaften in ihrer
Gesamtheit bestimmt und unveränderlich sind. Hierbei handelt es sich insbesondere um
physische Eigenschaften (Sorte, Größe, Qualität etc.) und Vermarktungsmerkmale
(Vermarktungsstufe, Zahlungsmodalitäten etc.), ebenso wie um die Zusammensetzung der
Gruppe von Grundprodukten, die zur Preisberechnung dient. Die Preisstatistik soll die
Preisbewegungen im eigentlichen Sinne deutlich machen. Dies ist nur dann möglich, wenn der
Preis für jedes Erzeugnis (oder jede Erzeugnisgruppe) von den sonstigen
Vermarktungsmerkmalen dieses Erzeugnisses getrennt dargestellt wird und diese sonstigen
Merkmale konstant gehalten werden. Wenn sich der Wert aufgrund einer Änderung eines oder
mehrerer sonstiger Merkmale ändert, handelt es sich nicht um eine echte Preisänderung. So
zahlt der Käufer beispielsweise, wenn er eine höhere Qualität erhält, zwar einen höheren Betrag,
aber er erhält ebenso eine höhere Leistung. In der Preisstatistik müssen diese Preisänderungen
theoretisch eliminiert werden.
Der Erlöspreis eines landwirtschaftlichen Erzeugnisses (oder einer Erzeugnisgruppe) erlaubt es,
den Änderungen der vermarkteten Mengen alle Änderungen gegenüberzustellen, die nicht von
jenen Mengenänderungen herrühren, und sie mit Hilfe eines einzigen Ausdrucks zu messen.
Dieser Ausdruck entspricht dem Erlöspreis. Eine Änderung des Erlöspreises drückt also sowohl
die durch die Preisstatistik ausgewiesenen Preisbewegungen als auch die Änderungen des
"Volumens", die nicht aus Mengenänderungen herrühren, aus.
Besonders geeignet sind die Erlöspreise für die Gruppen von ähnlichen Erzeugnissen oder für
die Gruppen von verschiedenen Arten ein und desselben Erzeugnisses
2. In diesen Fällen
erfassen die Erlöspreise auch die gegebenenfalls in der Zusammensetzung der
Erzeugnisgruppen (oder des Erzeugnisses) hinsichtlich Quantität oder Qualität jedes
Erzeugnisses (oder der verschiedenen Arten und Qualitäten eines bestimmten Erzeugnisses)
eingetretenen Änderungen. So wird der Einfluß der Zusammensetzung des Sortiments
gemessen.
3. Datenquellen, Berechnungsmethoden und Produktliste
Die Landwirtschaftliche Gesamtrechnung (LGR), die auf dem ESVG aufbaut, stellt die
Hauptda-tenquelle für diese Statistik dar. Die Verwendung der Landwirtschaftlichen Gesamtrechnung als
Datenquelle für die Erlöspreise und die entsprechenden Mengendaten ermöglicht die Erstellung
dieser Statistik nach denselben Begriffen, Regeln und Grundsätzen, wie sie für die Erstellung der
LGR verwendet werden.
Die Erlöspreise beziehen sich nur auf die Verkäufe (Inlands- und Auslandsabsatz) an
Einheiten außerhalb des Agrarbereichs . Folgende Elemente bleiben somit unberücksichtigt:
Eigenverbrauch, Bestandsveränderungen, selbsterstellte landwirtschaftliche Anlagen.
Bei der Verbuchung der Produktionssubventionen und -steuern wird dieselbe Methode
angewandt, die derzeit für die Landwirtschaftliche Gesamtrechnung gilt. Damit werden die
Gütersteuern von den Erlöspreisen nicht abgezogen, und auch die Gütersubventionen bleiben
unberücksichtigt (werden nicht hinzugerechnet). Wie in den übrigen agrarwirtschaftlichen
Statistiken (LGR und Agrarpreisstatistik) enthalten die Erlöspreise keine Mehrwertsteuer.
Die Erlöspreisstatistik wird jährlich erstellt, wobei wie bei den übrigen Preisstatistiken und der
landwirtschaftlichen Gesamtrechnung das Kalenderjahr zugrunde gelegt wird.
Die Erlöspreisstatistik erfaßt Erzeugnisse oder Erzeugnisgruppen der Produktliste, die den
land-wirtschaftlichen Produktionsbereich gemäß der Landland-wirtschaftlichen Gesamtrechnung definiert.
Für alle Länder ist eine gemeinsame Minimalliste, bestehend aus etwa 40 Erzeugnissen,
aufgestellt worden, die im Rahmen der Tabellen nach Mitgliedstaaten (Ländertabellen) durch für
die einzelnen Länder der Europäischen Union besonders typische Erzeugnisse ergänzt wird.
Aufgrund methodischer Unterschiede zwischen den einzelnen Ländern können die Erlöspreise
verschiedener Länder nicht vollständig vergleichbar sein, insbesondere im Rahmen dieser ersten
Veröffentlichung. Zudem sei daran erinnert, daß die Unterschiede zwischen den Erlöspreisen
ver-schiedener Länder aus dem Zusammenwirken einer Vielzahl von Parametern herrühren:
Unter-schiede in der Qualität und der Aufmachung der Erzeugnisse, der Vermarktungswege und des
Vermarktungszeitraums und, für alle Produktgruppen, Unterschiede in der Zusammensetzung
dieser Gruppen. Der Benutzer dieser Statistiken hat sich beim Vergleich mehrerer Mitgliedstaaten
vor jeglichem voreiligen Schluß zu hüten, der aus einer Verwechslung der Begriffe von Erlöspreis
und Preis resultieren kann.
Table of contents
Page
Page
Symbols and abbreviations used
Preliminary Remarks
Glossary in nine languages
Conversion rates in ECU
1. Unit Value of agricultural
products by country
1.01 Belgium
1.02 Denmark
1.03.0 Germany before 03.10.1990
1.03.1 Germany after 03.10.1990
1.04 Greece
1.05 Spain
1.06 France
1.07 Ireland
1.08 Italy
1.09 Luxembourg
1.10 Netherlands
1.11 Portugal
1.12 United Kingdom
2. Unit Value of agricultural
products by product
2.01 Cereals (excl. rice)
2.02 Wheat
2.03 Soft wheat
2.04 Durum wheat
2.05 Rye
2.06 Barley
2.07 Oats
2.08 Grain maize
2.09 Rice
10
11
21
25
29
35
39
44
47
53
59
65
69
77
81
87
91
96
98
100
102
104
106
108
110
112
2.10
2.11
2.12
2.13
2.14
2.15
2.16
2.17
2.18
2.19
2.20
2.21
2.22
2.23
2.24
2.25
2.26
2.27
2.28
2.29
2.30
2.31
2.32
2.33
2.34
2.35
2.36
2.37
2.38
2.39
2.40
2.41
2.42
2.43
Dried peas
Haricot beans
Potatoes
Sugar beet
Oil seeds
Rape seeds
Sunflowers seeds
Soya beans
Fibre plants
Tobacco
Hop cones
Cauliflowers
Tomatoes
Dessert apples
Dessert pears
Peaches
Sweet oranges
Mandarines
Lemons
Grapes
Grape must and wine
Table wine
Quality wine
Olives
Olive oil
Cattle (excl. calves)
Calves
Pigs
Equines
Sheep and goats
Poultry
Milk
Eggs
Raw wool
Symbols and
abbreviations used
ECU
Nil or figure less than half the unit used
No data available
European currency unit
tonne
B
DK
D11
D16
EL/GR
E
F
IRL
I
L
NL
Ρ
UK
Belgium
Denmark
Germany before 03.10.1990
Germany after 03.10.1990
Greece
Spain
France
Ireland
Italy
The aim of these preliminary remarks is to specify the purpose and the nature of these new unit
value statistics. Including both price components as such and the intrinsic characteristics of
products, the time series of unit values constitute a basic instrument in economic analysis,
particularly for modelling, together with the corresponding series of marketed quantities.
1. Purpose of the unit value statistics
Developing unit value statistics for agricultural products forms part of the restructuring of
agricultural price statistics in absolute values; it constitutes a supplementary statistical
instrument in this restructuring. Supplying further information on the characteristics of the
changes in value of agricultural products other than the price components as such (and the
variations in physical quantities), brings one closer to the economic parameters measured and
recorded in the Economic Accounts for Agriculture. Since these parameters are used in
economic analyses - and, more particularly, in modelling - it also appeared appropriate to
establish time series for the corresponding quantities marketed
1.
2. Nature of unit values
Unit values are obtained by dividing a value component by the corresponding quantity
component, and therefore they are not prices in the true sense of the term. Apart from the
"pure" price components, they reflect the other factors which determine products and can affect
these prices. A number of components relating to the difference between price and unit values
should therefore be specified.
In the Community statistics of absolute prices, the price of a product is defined as the average
value of a unit of that product, all of whose characteristics are determined and constant. It
concerns particularly the physical (variety, calibre, quality ...) and commercial characteristics
(marketing stage, sale conditions ...), as well as the structure of the sample of elementary
products which are used to calculate it. The aim of price statistics is to highlight price
movements as such. This can only be done by isolating the price of each product (or group of
products) from the other marketing characteristics and keeping them constant. If the value
changes because of a change in one or more of a number of characteristics, this is not a true
price change. For example, if buyers receive a better quality then they generally pay more, but
they also obtain a higher benefit. In price statistics, these changes must theoretically be
eliminated.
This concept of price is specified in the European System of Integrated Economic Accounts
(ESA), which provides an appropriate framework for constructing price and volume indices. In
time comparisons, these indices can be used to isolate, in the changes of the values of flows of
goods and services, the changes which reflect "pure" prices changes in relation to "volume"
changes. These latter changes reflect the changes in quantity and quality of products and the
changes in the circumstances under which the products are used.
The unit value of an agricultural product (or group of products) can be used for comparing
changes in marketed quantities with all the changes other than those coming from quantities
themselves and to measure them in one expression. This expression corresponds to the unit
value. Accordingly, a change in the unit value reflects both the price movements shown up by
the price statistics and developments in "volume" other than those determined by quantities.
Unit values are particularly suitable for groups of similar products or groups of varieties of the
same product
2. In this case, they include any changes in the composition of the groups of
products (or the product) in terms of quantity or quality of each product (or the varieties and
qualities of a given product). In this way the effect of the composition of the mix can be
measured.
3. Data sources, calculation methods and product list
The Economic Accounts for Agriculture (EAA), which are based on the ESA, are the main data
source for these statistics. By using the EAA as a data source for unit values and the
corresponding quantities, these statistics can be established in accordance with the same
concepts, rules and principles as for the EAA.
Unit values must refer only to sales (domestic and exports) to units outside the agriculture
branch. This rules out own-consumption, changes in stocks and agricultural fixed capital goods
produced for own-account.
The method for recording subsidies and taxes linked to production must be that currently used
in the Economic Accounts for Agriculture. Accordingly, unit values include taxes on products
(which are not deducted) but not subsidies on products (which are not added). Following the
practice in other agricultural economic statistics (the Economic Accounts for Agriculture and
agricultural prices), unit values are recorded excluding VAT.
These unit value statistics are annual, based on the calendar year, like all the other price and
EAA statistics.
Unit value statistics cover a set of products or groups of products on the list of products which
defines the agricultural branch of the Economic Accounts for Agriculture. There is a minimum list
of products, which is common to all countries and comprises some 40 items. In the tables for
individual Member States other products are added, which are more specific to each of the
European Union countries.
Because of methodological differences between countries, the unit values may not be fully
comparable from one country to another, particularly in the framework of this new publication.
Moreover, it should be reminded that differences in unit values between countries come through
their construction from a great number of parameters: differences in quality and presentation of
products, of sale channels and marketing period, and for all products groups, differences in the
composition of these groups. The users of these statistics should avoid any quick conclusions in
such comparison exercises between countries, by not confusing the notion of unit value with
that of prices.
When unit values are established for a group of products there must be a basic minimum of
homogeneity among the products.
Table des matières
Page
Page
Signes et abréviations employés
Remarques préliminaires
Glossaire en neuf langues
Taux de conversion en ECU
1. Valeurs Unitaires des produits
agricoles par pays
1.01 Belgique
1.02 Danemark
1.03.0 Allemagne avant le 03.10.1990
1.03.1 Allemagne après le 03.10.1990
1.04 Grèce
1.05 Espagne
1.06 France
1.07 Irlande
1.08 Italie
1.09 Luxembourg
1.10 Pays-Bas
1.11 Portugal
1.12 Royaume-Uni
2. Valeurs Unitaires des produits
agricoles par produit
2.01 Céréales (sans riz)
2.02 Blé
2.03 Blé tendre
2.04 Blé dur
2.05 Seigle
2.06 Orge
2.07 Avoine
2.08 Maïs-grain
2.09 Riz
16
17
21
25
29
35
39
44
47
53
59
65
69
77
81
87
91
96
98
100
102
104
106
108
110
112
2.10
2.11
2.12
2.13
2.14
2.15
2.16
2.17
2.18
2.19
2.20
2.21
2.22
2.23
2.24
2.25
2.26
2.27
2.28
2.29
2.30
2.31
2.32
2.33
2.34
2.35
2.36
2.37
2.38
2.39
2.40
2.41
2.42
2.43
Pois secs
Haricots secs
Pommes de terre
Betteraves sucrières
Graines oléagineuses
Graines de colza
Graines de tournesol
Fèves de soja
Plantes textiles
Tabac
Houblon
Choux-fleurs
Tomates
Pommes de table
Poires de table
Pêches
Oranges douces
Mandarines
Citrons
Raisins
Moût de raisins et vin
Vin de table
Vin de qualité
Olives
Huile d'olive
Bovins (veaux exclus)
Veaux
Porcins
Equidés
Ovins et caprins
Volaille
Lait
Oeufs
Laine brute
114
116
118
120
122
124
126
128
130
132
134
136
138
140
142
144
146
148
150
152
154
156
158
160
162
164
166
168
170
172
174
176
178
180
Signes et
abbreviations employés
0
ECU
t
B
DK
D11
D16
EL/GR
E
F
IRL
I
L
NL
Ρ
UK
Néant ou donnée inférieure à la moitié de l'unité utilisée
Donnée non disponible
Unité monétaire européenne
tonne
Belgique
Danemark
Allemagne avant le 03.10.1990
Allemagne après le 03.10.1990
Grèce
Espagne
France
Irlande
Italie
Ces remarques préliminaires visent à préciser les objectifs et la nature de cette nouvelle
statistique des valeurs unitaires. Intégrant à la fois des éléments de prix proprement dits et les
caractéristiques intrinsèques des produits, les séries temporelles de valeurs unitaires constituent
un instrument de base dans les études économiques, notamment les travaux de modélisation,
conjointement avec les séries correspondantes de quantités commercialisées.
1
.
Objectifs de la statistique des valeurs unitaires
Le développement d'une statistique de valeurs unitaires de produits agricoles s'inscrit dans le
cadre de la restructuration de la statistique des prix agricoles en valeur absolue pour laquelle elle
constitue un instrument statistique complémentaire. En apportant de nouvelles informations sur
les caractéristiques des variations de valeur des produits agricoles autres que les éléments de
prix proprement dits (et les variations de quantité physique homogène), elle permet de se
rapprocher des grandeurs économiques telles qu'elles sont mesurées et enregistrées dans les
comptes économiques de l'agriculture. Dans la perspective de leur utilisation dans des analyses
économiques (et plus particulièrement dans des travaux de modélisation), il est apparu opportun
d'établir également des séries temporelles sur les quantités commercialisées correspondantes!.
2. Nature des valeurs unitaires
Les valeurs unitaires résultent de la
division d'un élément de valeur par l'élément de quantité
correspondant
et ne constituent donc pas des prix au sens propre. Elles reflètent, en dehors
des éléments "purs" constitutifs des prix, les modifications intervenues dans les autres
caractéristiques qui déterminent les produits et qui peuvent influencer ces prix. Il convient ainsi
de préciser certains éléments relatifs à la différence entre les concepts de prix et de valeurs
unitaires.
Dans la statistique communautaire de prix absolus, le prix d'un produit se définit comme la valeur
moyenne d'une unité de ce produit dont l'ensemble des caractéristiques sont déterminées et
constantes. Il s'agit notamment des caractéristiques physiques (variété, calibre, qualité ..) et
commerciales (stade de commercialisation, modalités de paiement ...), ainsi que de la structure
de l'échantillon de produits élémentaires qui sert à le calculer. La statistique de prix a pour objet
de mettre en évidence les mouvements de prix proprement dits. Ceci n'est possible qu'à la
condition d'isoler le prix de chaque produit (ou groupe de produits) des autres caractéristiques de
commercialisation de ce produit et de les maintenir constantes. Si la valeur se modifie à la suite
d'une variation de l'une ou de plusieurs caractéristiques, il ne s'agit pas de véritables variations
de prix. Ainsi par exemple lorsque l'acheteur bénéficie d'une qualité supérieure, il paie
généralement un montant plus élevé certes mais il obtient une prestation également plus élevée.
Dans la statistique de prix, ces variations doivent être théoriquement éliminées.
La valeur unitaire d'un produit agricole (ou d'un groupe de produits) permet de confronter aux
variations des quantités commercialisées toutes les variations autres que celles venant des
quantités ellesmêmes et de les mesurer dans une seule expression. Celleci correspond à la
valeur unitaire. Une variation de valeur unitaire traduit donc à la fois les mouvements de prix mis
en évidence par les statistiques de prix et les évolutions de "volume" autres que celles
s'expliquant par les quantités.
Les valeurs unitaires sont particulièrement appropriées pour les groupes de produits similaires ou
pour les groupes de variétés d'un même produits. Dans ce caslà, les valeurs unitaires intègrent
également les variations éventuelles intervenues dans la composition des groupes de produits
(ou du produit) sur le plan de la quantité ou de la qualité de chacun des produits (ou des variétés
et qualités d'un produit déterminé). On mesure ainsi l'influence de la composition de l'assortiment.
3. Sources de données, méthodes de calcul et liste de produits
Les comptes économiques de l'agriculture (CE.Α.), qui se fondent sur le SEC, constituent la
source de données principale de cette statistique. L'utilisation des comptes économiques de
l'agriculture comme source de données des valeurs unitaires et des données de quantités
correspondantes permet d'établir cette statistique selon les mêmes concepts, règles et principes
d'élaboration que ceux des CE.Α..
Les valeurs unitaires doivent se rapporter uniquement aux
ventes (domestiques et
exportations) aux unités en dehors de la branche agricole.
Ainsi, en sont exclus les éléments
suivants: l'autoconsommation, la variation de stocks et les biens de capital fixe agricoles produits
pour compte propre.
La méthode de comptabilisation des subventions et des impôts liés à la production doit être celle
actuellement utilisée dans les comptes économiques de l'agriculture. Ainsi, on inclut dans les
valeurs unitaires les impôts sur les produits (qui ne sont pas déduits) mais on exclut les
subventions sur les produits (qui ne sont pas ajoutés). Comme cela est réalisé dans les autres
statistiques économiques agricoles (CE.A. et prix agricoles), les valeurs unitaires sont
enregistrées hors TVA.
Cette statistique de valeurs unitaires est une statistique à fréquence annuelle avec l'année
civile
comme période référence, comme toutes les autres statistiques de prix et de comptes
économiques agricoles.
La statistique de valeurs unitaires couvre un ensemble de produits ou groupes de produits faisant
partie de la liste des produits définissant la branche agricole des comptes économiques de
l'agriculture. Une liste minimum de produits, commune à tous les pays et constituée d'une
quarantaine de produits, a été définie à laquelle sont ajoutés, dans le cadre des tableaux par Etat
membre, d'autres produits plus spécifiques à chacun des pays de l'Union européenne.
En raison de différences méthodologiques entre pays, les valeurs unitaires peuvent ne pas être
totalement comparables d'un pays à l'autre, notamment dans le cadre de cette première
publication. De plus, il convient de rappeler que les différences de valeur unitaire entre pays
proviennent par construction d'un grand nombre de paramètres: différences de qualité et de
présentation des produits, de circuits et de période de commercialisation, et pour tous les
groupes de produits, différences dans la composition de ces groupes. L'utilisateur de ces
statistiques devra se garder de toute conclusion hâtive dans tout exercice de comparaison entre
Etats membres, en ne confondant pas la notion de valeur unitaire avec celle de prix.
L'établissement de valeurs unitaires pour un groupe de produits impose un minimum d'homogénéité
entre ces produits.
Glosario
Glosar
Glossar
Γλωσσάρι
Glossary
Glossaire
Glossario
Woordenlijst
GLOSARIO - GLOSAR - GLOSSAR - ΓΛΩΣΣΑΡΙ
Español
Cereales, excluido el arroz
Trigo
Trigo blando
Trigo duro
Centeno
Cebada
Avena
Mätemgjnw
Arroz
Guisantes secos
Judías secas
Patatas
Remolacha azucarera
Semillas y frutos
oleaginosos
Semillas de colza
Semillas de girasol
Semillas de soja
Plantas textiles
Tobaco
Lúpulo
Coliflores
Tomates
Manzanas de mesa
Peras de mesa
Melocotones
Naranjas
Mandarinas
Limones
Uvas
Mosto de uva y vio
Vino de mesa
Vino con denominación de
origen
Aceitunas de mesa
Aceite de oliva
Ganado bovino (excl. la
ternera)
Ternera
Cerdos
Caballos
Ovino y caprino
Aves
Leche
Huevos
Lana
Dansk
Korn, undtagen ris
Hvede
Blød hvede
Hård hvede
Rug
Byg
Havre
Majs til modenhed
Ris
Foderærter
Hertebønner
Kartofler
Sukkerroer
Olieholdige frø
Raps
Solsikkekerner
Sojabønner
Tekstilplanter
Tobak
Humle
Blomkål
Tomater
Spiseæbler
Spisepæbler
Ferskner
Appelsiner
Mandariner
Citroner
Druer
Druemost og vin
Bordvin
Klassificeret vin
Oliven til spisebrug
Olivenolie
Kvæg (exkl. kalve)
Kalve
Svin
Heste, æsler, mulæsler
og muldyr
Får og geder
Fjerkræ
Mælk
Æg
Uld
Deutsch
Getreide ohne Reis
Weizen
Weichweizen
Hartweizen
Roggen
Gerste
Hafer
Körnermais
Reis
Speiseerbsen
Speisebohnen
Kartoffeln
Zuckerrüben
Ölsaaten
Rapssaat
Sonenblumenkerne
Sojabohnen
Textilpflanzen
Tabak
Hopfen
Blumenkohl
Tomaten
Tafeläpfel
Tafelbirnen
Pfirsiche
Orangen
Mandarinen
Zitronen
Trauben
Traubenmost und Wein
Tafelwein
Qualitätswein
Oliven
Olivenöl
Rinder (ohne Kälber)
Kälber
Schweine
Einhufer
Schafe und Ziegen
Geflügel
Milch
Eier
Wolle
Ελληνικά
Δημητριακά χωρίς το ρύζι
Σιτάρι
Σιτάρι μαλακό
Σιτάρι σκληρό
Σίκαλη
Κριθάρι
Βρώμη
Αραβόσιτος σε σπόρους
Ρύζι
Ξηρά μπιςέλια
Ξηρά φασόλια
Πατάτες
Ζαχαρότευτλα
Ελαιώδη φυτά και σπόροι
Ελαιούχοι σπόροι
Ηλιόσπορος
Σπέρματα σόγιας
Υφαντουρνκά φυτά
Καπνά
Λυκίσκος
Κουνουπίδια
Τομάτες
Επιτραπέςια μήλα
Επιτραπέςια αχλάδια
Ροδάκινα
Πορτοκάλια
Μανταρίνια
Λεμόνια
Σταφύλια
Μούστος και κρασί
Επιτραπέςιος οίνος
Οίνοι ποιότητας
Επιραπέζιες ελιές
Ελαιόλαδο
Βοοειδή (περιλαμβανομένων
και των μοσχαριών)
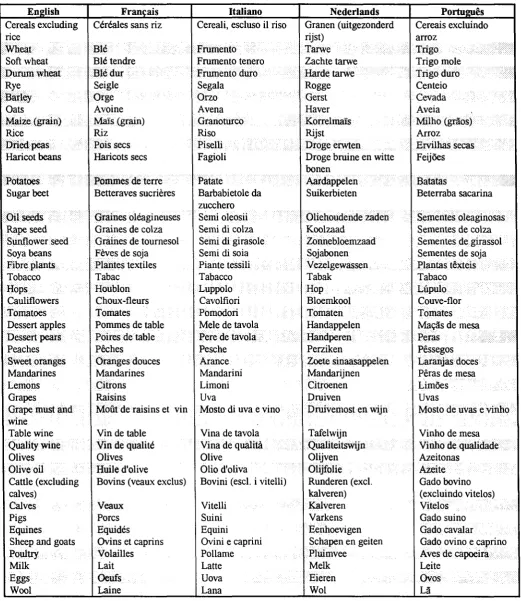
GLOSSARY - GLOSSAIRE - GLOSSARIO - WOORDENLIJST - GLOSSARIO
English
Cereals excluding
rice
Wheat
Soft wheat
Durum wheat
Rye
Barley
Oats
Maize (grain)
Rice
Dried peas
Haricot beans
Potatoes
Sugar beet
Oil seeds
Rape seed
Sunflower seed
Soya beans
Fibre plants
Tobacco
Hops
Cauliflowers
Tomatoes
Dessert apples
Dessert pears
Peaches
Sweet oranges
Mandarines
Lemons
Grapes
[image:25.595.32.554.93.695.2]Grape must and
wine
Table wine
Quality wine
Olives
Olive oil
Cattle (excluding
calves)
Calves
Pigs
Equines
Sheep and goats
Poultry
Milk
Eggs
Wool
Français
Céréales sans riz
Blé
Blé tendre
Blé dur
Seigle
Orge
Avoine
Mais (grain)
Riz
Pois secs
Haricots secs
Pommes de terre
Betteraves sucrières
Graines oléagineuses
Graines de colza
Graines de tournesol
Fèves de soja
Plantes textiles
Tabac
Houblon
Choux-fleurs
Tomates
Pommes de table
Poires de table
Pêches
Oranges douces
Mandarines
Citrons
Raisins
Moût de raisins et vin
Vin de table
Vin de qualité
Olives
Huile d'olive
Bovins (veaux exclus)
Veaux
Porcs
Equidés
Ovins et caprins
Volailles
Lait
Oeufs
Laine
Italiano
Cereali, escluso il riso
Frumento
Frumento tenero
Frumento duro
Segala
Orzo
Avena
Granoturco
Riso
Piselli
Fagioli
Patate
Barbabietole da
zucchero
Semi oleosii
Semi di colza
Semi di girasole
Semi di soia
Piante tessili
Tabacco
Luppolo
Cavolfiori
Pomodori
Mele de tavola
Pere de tavola
Pesche
Arance
Mandarini
Limoni
Uva
Mosto di uva e vino
Vina de tavola
Vina de qualità
Olive
Olio d'oliva
Bovini (esci, i vitelli)
Vitelli
Suini
Equini
Ovini e caprini
Pollame
Latte
Uova
Lana
Nederlands
Granen (uitgezonderd
rijst)
Tarwe
Zachte tarwe
Harde tarwe
Rogge
Gerst
Haver
Korrelmaïs
Rijst
Droge erwten
Droge bruine en witte
bonen
Aardappelen
Suikerbieten
Oliehoudende zaden
Koolzaad
Zonnebloemzaad
Sojabonen
Vezelgewassen
Tabak
Hop
Bloemkool
Tomaten
Handappelen
Handperen
Perziken
Zoete sinaasappelen
Mandarijnen
Citroenen
Druiven
Druivemost en wijn
Tafelwijn
Qualiteitswijn
Olijven
Olijfolie
Runderen (excl.
kalveren)
Kalveren
Varkens
Eehhoevigen
Schapen en geiten
Pluimvee
Melk
Eieren
Wol
Português
Cereais excluindo
arroz
Trigo
Trigo mole
Trigo duro
Centeio
Cevada
Aveia
Milho (grãos)
Arroz
Ervilhas secas
Feijões
Batatas
Beterraba sacarina
Sementes oleaginosas
Sementes de colza
Sementes de girassol
Sementes de soja
Plantas têxteis
Tabaco
Lúpulo
Couve-flor
Tomates
Maçãs de mesa
Peras
Pêssegos
Laranjas doces
Pêras de mesa
Limões
Uvas
Mosto de uvas e vinho
Vinho de mesa
Vinho de qualidade
Azeitonas
Azeite
Gado bovino
(excluindo vitelos)
Vitelos
Gado suino
Gado cavalar
Gado ovino e caprino
Aves de capoeira
Leite
Ovos
Lã
UMRECHNUNGSKURSE
CONVERSION RATES
1 ECU =
BFR
DKR
DM
DR
PTA
FF
IRL
LIT
LFR
HFL
ESC
UKL
1985
44.91360
8.01876
2.22632
105.73900
129.16450
6.79502
0.71517
1447.98700
44.91360
2.51101
130.25150
0.58898
1986
43.79780
7.93565
2.12819
137.42460
137.45630
6.79976
0.73353
1461.87400
43.79780
2.40089
147.08840
0.67154
1987
43.03920
7.88413
2.07159
156.22040
142.19150
6.92848
0.77544
1494.70800
43.03920
2.33428
162.58110
0.70468
1988
43.42840
7.95152
2.07440
167.57560
137.60070
7.03643
0.77567
1537.33300
43.42840
2.33479
170.05920
0.66443
1989
43.38060
8.04928
2.07015
178.84040
130.40580
7.02387
0.77682
1510.46900
43.38060
2.33526
173.41310
0.67330
1990
42.42520
7.85645
2.05211
201.41200
129.31560
6.91416
0.76777
1521.94100
42.42520
2.31214
181.10760
0.71386
Γ\3
1. ERLÖSPREISE LANDWIRTSCHAFLICHER
ERZEUGNISSE NACH MITGLIEDSTAATEN
1. UNIT VALUES OF AGRICULTURAL PRODUCTS
BY COUNTRY
Tabelle 1.01 /Table 1.01 /Tableau 1.01
Β
LANDWIRTSCHAFTLICHE ERLÖSPREISE
(ohne MwSt) und korrespondierende Mengen
AGRICULTURAL UNIT VALUES
VALEURS UNITAIRES AGRICOLES
(excl. VAT) and corresponding quantities
(hors TVA) et quantités correspondantes
Getreide (ohne Rel·)
Cereal« (excl. rice)
Céréales (sane rlz)
Weizen Wheat Bl« Roggen Ry« Seigle Garete Barley Orge Hafer Oats Avoine Speiseerbsen
Dried peas Poissées
Gartenbohnen
Haricot beans
Haricot« secs Kartoffeln
Potatoes
Pomme« de terre
Ölsaaten
Oilseeds
Landeswahrung/1 Nat. currency/t Monnaie nationale / t
ECU /tonne Quantität/1000 t Quantity /1000 t Quantité/1000 t Landeswährung / 1
Nat. currency/t Monnaie nationale IX
ECU /tonne Quantität /1000 t
Quantity /1000 t Quantité /1000 t Landeswährung/t Nat. currency/t Monnaie nationale /1
ECU /tonne Quantität/1000 t
Quantity /1000 t Quantité /1000 t Landeswährung/t Nat. currency/t Monnaie nationale/t
ECU/tonne Quantität /1000 t Quantity/1000 t Quantité /1000 t Landeswährung/t Nat. currency/t Monnaie nationale /1
ECU/tonne Quantität/10001 Quantity/10001 Quantité /1000 t Landeswährung/t Nat. currency/t Monnaie nationale/t
ECU /tonne Quantität/1000! Quantity /1000 t Quantité /1000 t Landeswährung/t
Nat. currency /1 Monnaie nationale/t
ECU /tonne Quantität /1000 t
Quantity /1000 t Quantité /1000 t Landeswährung /1
Nat. currency /1 Monnaie nationale / t
ECU/tonne Quantität /1000 t
Quantity /1000 t Quantité /1000 t Landeswährung /1
Nat. currency /1 Monnaie nationale /1
ECU/tonne Quantität /1000 t
1985
8 075.0 179.8 1 609.9 8 238.0 183.4 1 093.8 7 798.0 173.6 7.9 7 804.6 173.8 470.1 6 546.0 145.7 31.2 15 010.0 334.2 1.5 28 090.0 625.4 1.5 2 700.2 60.1 1 453.4 19 560.0 435.5
1986
8 092.1 184.8 1 820.5 8 219.0 187.7 1 208.6 8 482.0 193.7 10.6 7 819.8 178.5 574.3 7 996.0 182.6 1Θ.5 13 700.0 312.8 6.4 21 400.0 488.6 1.5 3 667.3 83.7 1 370.7 19 760.0 451.2
1987
7 551.3 175.5 1 548.9 7 679.0 178.4 988.4 7 336.0 170.4 10.1 7 211.3 167.6 489.8 8 350.0 194.0 25.9 13 000.0 302.1 12.4 17 700.0 411.3 2.4 2 518.8 58.5 1 559.8 19 590.0 455.2
1988
7 642.0 176.0 1 799.2 7 834.0 180.4 1 194.8 7 312.0 168.4 8.8 7 249.5 166.9 545.7 7311.0 168.3
28.1
12 500.0 287.8 9.7 20 800.0 478.9 2.1 3 231.4 74.4 1 594.4 19 682.0 453.2
1889
7 318.0 168.7 1 884.3 7 462.0 172.0 1 344.5 7 047.0 162.4 8.8 6 944.0 160.1 494.9 7 001.0 161.4 14.1 12 400.0 285.8 6.9 31 900.0 735.4 2.3 5 501.8 126.8 1 424.6 17 820.0 410.B
1990
7 124.6 167.9 1 658.9 7 332.0 172.8 1 215.7 6 547.0 154.3 10.3 6 526.8 153.8 398.7 6 216.0 146.5 7.3 10 600.0 249.9 9.8 28 900.0 681.2 1.1 4 326.1 102.0 1 650.5 15 190.0 358.0
1991
6 983.0 165.4 1 726.5 7 141.0 169.1 1 309.2 6 536.0 154.8 8.5 6 442.2 152.6 366.2 6 796.0 161.0 10.2 10 400.0 246.3 16.2 22 700.0 537.6 0.7 4 008.3 94.9 1 793.5 13 880.0 328.7
1992
6 710.7 161.3 1 682.5 6 832.0 164.3 1 281.9 6 271.0 150.8 7.4 6 261.5 150.5 350.9 7 305.0 175.6 15.8 11 100.0 266.9 12.9 17 900.0 430.3 0.6 3 079.9 74.0 2 325.2 8 824.0 212.1
1993
5 414.2
Tabelle 1.01 /Table 1.01 /Tableau 1.01
(Folge / Continued / Suite)
Β
LANDWIRTSCHAFTLICHE ERLÖSPREISE
(ohne MwSt) und korrespondierende Mengen
AGRICULTURAL UNIT VALUES
VALEURS UNITAIRES AGRICOLES
(excl. VAT) and corresponding quantities
(hors TVA) et quantités correspondantes
Rapssaat
Rape«eed«
Graines de colza
Taxtilpflanzen Fibre plants Plantes textiles Tabak Tobacco Tabac Hopfen Hops Houblon Blumenkohl Cauliflowers Chouxfleurs Tomaten Tomatoes Tomate« Tafellptel
Dessert apple«
Pomme« de table
Tafelblmen
Dessort peers
Poires de teble
Trauben
Grapes
Raisin«
Landeswährung/1 Nat. currency /1 Monnaie nationale / t
ECU /tonne Quantität/10001
Quantity/1000 t Quantité /1000 t Landeswährung IX
Nat. currency IX
Monnaie nationale IX
ECU /tonne Quantität /1000 t
Quantity /1000 t Quantité /1000 t Landeswährung /1
Nat. currency /1 Monnaie nationale /1
ECU / tonne Quantität /1000 t
Quantity /1000 t Quantité /1000 t Landeswährung / 1
Nat. currency lx
Monnaie nationale /1 ECU/tonne Quantität/1000 t
Quantity /1000 t Quantité /1000 t Landeswährung /1
Nat. currency lx
Monnaie nationale /1 ECU/tonne Quantität /1000 t Quantity/1000 t Quantité /1000 t Landeswährung /1
Nat. currency /1 Monnaie nationale /1
ECU /tonne Quantität /1000 t Quantity /1000 t Quantité /1000 t Landeswährung /1
Nat. cunency /1 Monnaie nationale IX
ECU/tonne Quantität/10001 Quantity/1000 t Quantité/1000 t Landeswährung /1
Nat. currency lx
Monnaie nationale /1 ECU/tonne Quantität/10001 Quantity/1000 t Quantité /1000 t Landeswährung /1
Nat. currency /1 Monnaie nationale /1
ECU/tonne Quantität/10001
Quantity/ 1000 t Quantité /1000 t
1985
19 560.0 435.5 6.0 6 428.0 143.1 69.1 148 800.0 3 313.0 1.9 70 920.0 1 579.0 1.2 19 875.7 442.5 61.7 30 960.0 689.3 159.0 14 790.0 329.3 215.6 18 090.0 402.8 78.3 67 150.0 1 495.1 3.2
1986
19 760.0 451.2 8.0 5 985.9 136.7 49.8 140 810.0 3 215.0 2.0 51 330.0 1 172.0 1.0 14 991.4 342.3 70.7 33 720.0 769.9 180.0 10 950.0 250.0 262.5 15 650.0 357.3 80.6 58 940.0 1 345.7 2.6
1987
19 590.0 455.2 12.3 5 599.3 130.1 66.2 131 180.0 3 047.9 1.1 113 970.0 2 648.1 0.8 25 315.6 588.2 56.7 36 580.0 849 9 175.0 15 750.0 365.9 233.8 13 850.0 321.8 ! 91.3 85 420.0 1 984.7 2.3
1988
19 682.0 453.2 10.1 5 527.1 127.3 72.3 145 740.0 3 355.9 1.5 139 430.0 3 210.6 0.6 21 239.9 489.1 61.1 31 080.0 715.7 204.8 12 920.0 297.5 266.2 24 390.0 561.6 83.8 ; 113 530.0 2 614.2
:
2
·°
1989
17 820.0 410.8 11.9 6 733.0 155.2 60.9 149 660.0 3 449.9 1.5 117 130.0 2 700.1 0.6 16 724.6 385.5 69.0 30 000.0 691.6 225.2 15 040.0 346.7 315.2 31 900.0 735.4 86.9 99 7B0.0 2 300.1 1.8
1990
15 190.0 358.0 16.0 6 190.0 145.9 64.8 149 580.0 3 525.7 1.5 302 250.0 7 124.3 0.6 22 274.2 525.0 69.3 29 580.0 697.2 268.4 20 380.0 480.4 229.1 31 680.0 746.7 61.7
\ 158 420.0 3 734.1 1.7
1991
13 880.0 328.7 21.9 4 750.0 112.5 59.2 151 020.0 3 576.7 1.1 155 760.0 3 689.0 0.7 25 321.9 599.7 87.4 32 150.0 761.4 314.0 35 310.0 I 836.3 137.4 28 830.0 682.8 67.7 | 158 420.0 3 752.0 1.5
1992
8 224.0 197.7 17.4 5 075.0 122.0 44.9 153 370.0 3 687.2 1.5 188 600.0 4 534.2 0.8 20 764.1 499.2 95.9 24 130.0 580.1 329.5 7 930.0 190.6 481.8 19 600.0 471.2 111.3 ; 138 820.0 3 337.4 1.4
1993
7 915.0 195.6 12.6 5 182.0 128.0 57.9 38 380.0 948.3 1.6 94 760.0 2 341.4 0.8 21 006.0 519.0 1 117.5 24 000.0 593.0 346.8 10 590.0 261.7 492.5 15 460.0 382.0 151.7 I 137 550.0 3 398.7 1.3
Tabelle 1.01 /Table 1.01 /Tableau 1.01
(Folge / Continuad / Suite)
Β
LANDWIRTSCHAFTLICHE ERLÖSPREISE
(ohne MwSt) und korrespondierende Mengen
AGRICULTURAL UNIT VALUES
VALEURS UNITAIRES AGRICOLES
(excl. VAT) and corresponding quantities
(hors TVA) et quantités correspondantes
Rinder Cattle Bovins Ochsen Boeufs Stieren Bull Taureaux Kühe Cow Vaches Färsen Helfer Génisses Kälber Calves Veaux Schweine Pigs Porcins Einhufer Equine« Equldés
Schafe und Ziegen
Sheep and goat
Landeswährung IX
Nat. currency/t Monnaie nationale /1
ECU /tonne Quantität /1000 t
Quantity /1000 t Quantité /1000 t Landeswährung/t Nat. currency IX
Monnaie nationale/t ECU/tonne Quantität/1000 t Quantity/1000 t Quantité /1000 t Landeswährung/t Nat. currency IX
Monnaie nationale lx
ECU /tonne Quantität /1000 t Quantity /1000 t Quantité /1000 t Landeswährung IX
Nat. currency IX
Monnaie nationale lx
ECU/tonne Quantität /1000 t Quantity /1000 t Quantité/1000 t Landeswährung IX
Nat. currency IX
Monnaie nationale IX
ECU/tonne Quantität /1000 t
Quantity/1000 t Quantité/1000 t Landeswährung /1
Nat. currency IX
Monnaie nationale /1 ECU/tonne Quantität /1000 t
Quantity /1000 t Quantité /1000 t Landeswährung /1
Nat. currency /1 Monnaie nationale IX
ECU /tonne Quantität/10001
Quantity /1000 t Quantité/1000 t Landeswährung /1
Nat. currency IX
Monnaie nationale /1 ECU /tonne Quantität /1000 t
Quantity/1000 t Quantité/1000 t Landeswährung IX
Nat. currency IX
Monnaie nationale IX
ECU/tonne Quantität/1000 t
1985
76 934.1 1 712.9 555.9 82 738.0 1 842.2 28.8 90 665.0 2 018.7 182.0 57 531.0 1 280.9 217.4 89 092.0 1 983.6 127.6 100 891.0 2 246.3 85.3 58 327.0 1 298.6 850.9 65 555.0 1 459.6 2.5 57 873.0 1 288.5
1986
69 722.7 1 591.9 582.5 81 303.0 1 856.3 26.1 87 184.0 1 990.6 181.9 47 593.0 1 086.7 249.1 85 932.0 1 962.0 125.5 103 914.0 2 372.6 85.6 52 612.0 1 201.2 897.1 68 376.0 1 561.2 2.1 61 374.0 1 401.3
1987
65 560.5 1 523.3 547.1 76 219.0 1 770.9 29.4 84 394.0 1 960.9 181.4 41 462.0 963.4 233.1 83 860.0 1 948.5 103.2 103 486.0 2 404.5 92.7 45 315.0 1 052.9 980.0 67 382.0 1 565.6 2.4 45 301.0 1 052.6
1988
66 483.6 1 530.9 561.5 77 183.0 1 777.2 33.3 83 421.0 1 920.9 184.3 47 130.0 1 085.2 256.8 83 627.0 1 925.6 87.1 103 703.0 2 387.9 86.1 44 326.0 1 020.7 1 044.1 70 827.0 1 630.9 3.1 57 573.0 1 325.7
1989
75 451.9 1 739.3 540.7 81 977.0 1 889.7 32.9 89 300.0
1990
68 566.6 1 616.2 550.6 77 559.0 1 828.1 34.5 85 954.0 2 058.5 J 2 026.0
188.6 53 807.0 1 240.3 198.3 87 562.0 2 018.5 121.0 128 761.0
202.3 45 598.0 1 074.8 226.5 84 321.0 1 987.5 87.3 115 555.0 2 968.2 ; 2 723.7
76.2 56 659.0
99.8 51 298.0 1 306.1 I 1 209.1 1 075.3
77 724.0 1 791.7 2.4 48 939.0 1 128.1
948.5 77 009.0 1 815.2 1.6 45 820.0 1 080.0
1991
59 830.2 1 417.0 665.8 68 781.0 1 629.0 40.8 78 022.0 1 847.8 231.7 41 291.0 977.9 293.3 68 398.0 1 619.9 100.0 112 040.0 2 653.5 110.1 54 290.0 1 285.8 1 153.5 75 916.0 1 798.0 1.6 38 141.0 903.3
1992
61 297.7 1 473.7 630.7 69 307.0 1 666.2 33.7 77 994.0 1 875.1 213.6 46 483.0 1 117.5 298.7 68 239.0 1 640.6 84.8 120 046.0 2 886.1 112.2 55 556.0 1 335.7 1 190.6 75 564.0 1 816.7 1.1 38 506.0 925.7
1993
63 920.7 1 579.4 608.5 70 812.0 1 749.7 24.8 77 867.0 1 924.0 214.8 51 878.0 1 281.8 298.1 69 899.0 1 727.1 70.8 118 989.0 2 940.1 106.9 41 220.0 1 018.5 1 228.8 74 452.0 1 839.6 1.6
Tabelle 1.01 /Table 1.01 /Tableau 1.01
(Folge / Continued / Suite)
Β
LANDWIRTSCHAFTLICHE ERLÖSPREISE
(ohne MwSt) und korrespondierende Mengen
AGRICULTURAL UNIT VALUES
VALEURS UNITAIRES AGRICOLES
(excl. VAT) and corresponding quantities
(hors TVA) et quantités correspondantes
Geflügel
Poultry
Volaille
Hähnchen
Chicken
Poulets
Milch
Milk
Lalt
Eier
Egg«
Oeufs
Rohwolle
Raw wool
Laine brute
Landeswährung lx
Nat. currency/t Monnaie nationale /1
ECU / tonne Quantität /1000 t
Quantity/1000 t Quantité /1000 t Landeswährung /1
Nat. currency IX
Monnaie nationale/t ECU /tonne Quantität/1000 t
Quantity/1000 t Quantité/1000 t Landeswährung/t Nat. currency lx
Monnaie nationale /1 ECU/tonne Quantität/10001
Quantity/1000 t Quantité/1000 t Landeswährung IX
Nat. currency /1 Monnaie nationale lx
ECU/tonne Quantität /1000 t
Quantity/1000 t Quantité/1000 t Landeswährung /1
Nat. currency/1 μ Monnaie nationale /1
ECU/tonne Quantität /1000 t Quantity/1000 t Quantité/1000 t
1985
42 802.5 953.0 159.7 42 752.4 951.9 152.9 11 128.7 247.8 3 185.7 48 736.6 1 085.1 148.5 77 400.0 1 723.3 0.3
1986
41 004.7 936.2 163.4 40 959.1 935.2 156.6 11 406.6 260.4 3 321.6 46 374.7 1 058.8 150.1 47 500.0 1 084.5 0.3
1987
38 757.7 900.5 174.2 38 712.9 899.5 167.8 11 562.5 268.7 3 176.0 46 228.0 1 074.1 146.0 60 000.0 1 394.1 0.3
1988
38 311.8 882.2 187.3 38 267.6 881.2 181.1 12 258.5 282.3 3 084.0 43 770.1 1 007.9 138.2 63 000.0 1 450.7 0.3
1989
38 353.5 884.1 194.1 38 321.4 883.4 189.0 13 308.3 306.8 3 124.6 43 423.7 1 001.0 135.0 70 000.0 1 613.6 0.4
1990
36 425.2 858.6 211.5 36 391.1 857.8 205.7 11 904.5 280.6 3 009.0 43 017.3 1 014.0 149.9 26 000.0 612.8 0.3
1991
33 346.5 789.8 227.2 33 296.5 788.6 220.8 11 896.8 281.8 2 991.3 41 417.2 980.9 163.1 24 000.0 568.4 0.3
1992
33 292.6
1993
31 987.8 800.4 J 790.4 248.9
33 246.2 799.3 241.1 11 984.1 288.1 2 941.2 38 649.8 929.2 161.4 23 000.0 553.0 0.3
257.9 31 929.9 789.0 248.9 12 388.0 306.1 2 901.5 40 463.3 999.8 168.6 23 000.0 568.3 0.3