Subjective Experience of Music
.
White Rose Research Online URL for this paper:
http://eprints.whiterose.ac.uk/102547/
Version: Published Version
Article:
Irrgang, Melanie and Egermann, Hauke orcid.org/0000-0001-7014-7989 (2016) From
Motion to Emotion : Accelerometer Data Predict Subjective Experience of Music. PLoS
ONE. e0154360. ISSN 1932-6203
https://doi.org/10.1371/journal.pone.0154360
[email protected] https://eprints.whiterose.ac.uk/
Reuse
This article is distributed under the terms of the Creative Commons Attribution (CC BY) licence. This licence allows you to distribute, remix, tweak, and build upon the work, even commercially, as long as you credit the authors for the original work. More information and the full terms of the licence here:
https://creativecommons.org/licenses/
Takedown
If you consider content in White Rose Research Online to be in breach of UK law, please notify us by
From Motion to Emotion: Accelerometer
Data Predict Subjective Experience of Music
Melanie Irrgang1, Hauke Egermann1,2*
1Audio Communication Group, Technische Universität Berlin, Berlin, Germany,2Department of Music, University of York, York, United Kingdom
Abstract
Music is often discussed to be emotional because it reflects expressive movements in audible form. Thus, a valid approach to measure musical emotion could be to assess movement stim-ulated by music. In two experiments we evaluated the discriminative power of mobile-device generated acceleration data produced by free movement during music listening for the pre-diction of ratings on the Geneva Emotion Music Scales (GEMS-9). The quality of prepre-diction for different dimensions of GEMS varied between experiments fortenderness(R12(first
exper-iment) = 0.50, R22(second experiment) = 0.39),nostalgia(R12= 0.42, R22= 0.30),wonder
(R12= 0.25, R22= 0.34),sadness(R12= 0.24, R22= 0.35),peacefulness(R12= 0.20, R22=
0.35) andjoy(R12= 0.19, R22= 0.33) andtranscendence(R12= 0.14, R22= 0.00). For others
likepower(R12= 0.42, R22= 0.49) andtension(R12= 0.28, R22= 0.27) results could be
almost reproduced. Furthermore, we extracted two principle components from GEMS ratings, one representing arousal and the other one valence of the experienced feeling. Both qualities, arousal and valence, could be predicted by acceleration data, indicating, that they provide information on the quantity and quality of experience. On the one hand, these findings show how music-evoked movement patterns relate to music-evoked feelings. On the other hand, they contribute to integrate findings from the field of embodied music cognition into music rec-ommender systems.
Introduction
Music is often used to regulate emotions like reducing stress or to influence one’s mood as shown by [1] or [2]. This means that listening to music is highly linked to the experience of emotions [3–5]. Nonetheless, these subjective qualities of music do still play a minor role in the field of Music Information Retrieval (MIR) and Music Recommender Systems (MRS), i.e. for the retrieval and recommendation of music offered by web-based services [6].
In the field ofAffective Computing[6] there is increasing effort to connect the physical char-acteristics of music to emotionalvalenceandarousalvalues of the circumplex model from [7]. However, considering acoustical features of music and its implications on the perception of emotions does not yet consider themotor origin hypothesisof emotion in music as claimed a11111
OPEN ACCESS
Citation:Irrgang M, Egermann H (2016) From Motion to Emotion: Accelerometer Data Predict Subjective Experience of Music. PLoS ONE 11(7): e0154360. doi:10.1371/journal.pone.0154360
Editor:Gonzalo G. de Polavieja, Champalimaud Foundation, PORTUGAL
Received:November 3, 2015
Accepted:April 12, 2016
Published:July 14, 2016
Copyright:© 2016 Irrgang, Egermann. This is an open access article distributed under the terms of the
Creative Commons Attribution License, which permits unrestricted use, distribution, and reproduction in any medium, provided the original author and source are credited.
Data Availability Statement:Due to lack of consent to publish raw data from participants, data are available upon request from Melanie Irrgang, TU Berlin, Fachgebiet Audiokommunikation, Sekr. EN-8, Einsteinufer 17c, 10587 Berlin,
[email protected] for the app is available in the following repository:https://github. com/mirrgang/motion2emotioncc.
Funding:The authors have no support or funding to report.
by [8]. Accordingly, music is often discussed to be emotional because it reflects expressive movements in audible form [9–11]. Furthermore, the termemotioderived from the Latin
movere, to move, and is being used as a synonym forbeing moved. That is why Leman calls for new non-verbal, embodied possibilities to describe music and its experience [12]. He suggests to use corporeal articulations as a bridge between linguistic self-report measures and measure-ments of physical energy likepitch,loudnessortempobecause“human action can realize the transformation from physical energy to cultural abstraction, and vice versa”([12] p. 77).
Describing music by moving a mobile device like a smartphone, could build a bridge between physical energy and subjective experience. Smartphones are among the most increas-ingly popular devices to listen to music [13]. Once corporeal articulations are available from smartphone-assessed motion data and emotionally interpretable, missing emotional descrip-tions of music in MIR and MRS could be provided based on these embodied descripdescrip-tions. Hence, a model able to translate between corporeal and verbal descriptions of music would not only offer innovative, multimodal access to the retrieval of music, but also place additional semantic annotations about the emotional qualities of music at the disposal that also enrich the conventional verbal search.
1 Verbal Models of Musical Emotion
The most widespread models to describe the emotional qualities of music listening experience are thebasic emotions model, thecircumplex modeland theGeneva Emotion Music Scales (GEMS)[14].
The basic emotion model assumes, that there are four to six basic emotions that have evolu-tionary meaning and that are culturally universal. They often includefear,anger,happiness,
sadness,disgust, andsurprise[14]. The circumplex model maps these basic emotions and many other emotional feelings onto a two-dimensional space that is spanned byvalence(“how pleas-ant or unpleaspleas-ant is the experience?”) andarousal(“how intense is the experience?”) [7]. Accordingly, the quality of each emotion can be described by these two underlying qualities.
The GEMS have been iteratively developed and evaluated in four studies [15]. The aim for music-related emotions was to find“a more nuanced affect vocabulary and taxonomy than is provided by current scales and models of emotion”([15] p. 513). The original version of the GEMS comprises 45 terms includingfeeling of transcendence,nostalgic,solemnorimpatient
that are not part of any other emotional model. The GEMS-9, a shortened version of the GEMS-45, are, like the long-version, grouped into the categories ofsublimity(wonder, tran-scendence, tenderness, nostalgia, peacefulness),vitality(power, joyful activation) andunease
(tension, sadness) [15]. Torres-Eliard, Labbé and Grandjean collected self-report measures of the GEMS and suggest that it was a suitable model to assess musical emotion [16]. They con-cluded that“the results indicate a high reliability between listeners for different musical excerpts and for different contexts of listening including concerts, i.e. a social context, and lab-oratory experiments”([16] p. 252).
2 Corporeal Articulation of Musical Emotion
Several studies have shown that there is a close link between movement and emotion in music. Sievers et al. asked participants to adjust the featuresrate,jitter,consonance/smoothness,step sizeanddirectionfor each of the following five emotions:anger,happiness,peacefulness,sadness
Accordingly, the authors conclude that emotion expression in music and movement seem to be based on the same universal features. Giordano et al. studied the relationship between walking and emotion and its implications for the expression of musical performances [8]. Slow, quiet, and irregular walking sounds were associated with expressing sadness while fast, loud, and regu-lar walking sounds with happiness. Simiregu-lar patterns are also used in music performance (see [17]). Thus, they concluded that their findings“support the motor-origin hypothesis of musical emotion expression that states that musicians and listeners make use of general movement knowledge when expressing and recognizing emotions in music”([8] p. 29). This connection between musical rhythm and motor activities was supported by Parncutt already in 1987 [18].
There are many possibilities to express music listening experience in an embodied way. Among them are tapping or moving parts of the body along with the beat, singing, imitating to play a musical instrument or dancing. Hedder also evaluated an approach based on facial expression as form of embodiment [19]. Drawing as described in De Bruyn, Moelants, and Leman [20] and [12] is another alternative as a means of graphical attuning to the experience. Last but not least, the employment of acceleration sensor data generated by arm gestures as by Amelynck, Grachten, van Noorden and Leman [21] was described to be a very promising approach of multimodal querying on mobile devices.
Amelynck et al. [21] investigated how motion can be linked to emotion in the context of MIR. They asked participants to perform arm gestures while holding a Wii remote controller in order to describe the music. Afterwards the emotional qualities of the musical excerpts were rated on the dimensions ofvalenceandarousal. Using motion features recorded with the Wii controller generated fairly good predictions for the dimension ofarousal, but performed less precisely for the dimension ofvalence. The authors argue that this might be due to people ratingsadmusic as pleasant as described in [22]), and conclude that the circumplex model might be unsuitable to be used with musical emotions. Also Juslin and Vjästfjäll note that perceiving mixed emotions, that are positive and negative at the same time, limits that employability of the circumplex model [23]. Accordingly, Amelynck et al. suggest the GEMS as an alternative to this circumplex model.
Aims and Experimental Design
The goal of the presented study is to explore which and how well each of the GEMS can be pre-dicted by mobile-device generated acceleration data. That way, the present study continues the work of Amelynck [21], testing the use of an alternative emotion model and using different motion sensors. Hence, these findings will contribute to understand, how acceleration data can be used to integrate embodied music cognition into Music Recommender Systems. Further-more, it will test the often described similarities between certain motion features and emotional qualities [8][10].
First, a pilot study was conducted to develop a measurement instrument for the following experiments. Afterwards, we conducted two experiments to test if and how accelerometer data can be used to describe musical experience. Here, the second experiment tested if results could be replicated for different music samples and if results changed when participants were free to choose the songs they felt like moving to. Furthermore, we also tested how different GEMS qualities relate to different movement patterns (rhythmic vs. gestalt), e.g. if music experienced assadwas less suitable for rhythmic movement patterns.
General Methods
Ethics Statement
qualities. They gave oral consent to participating in the study and storing of the data collected during the experiment. No ethics approval was required from the Technical University Berlin for behavioral studies such as those reported in this manuscript. There was no institutional review board available at the department where the experiment was conducted. Neither of the experiments involved deception or stressful procedures. Participants were informed that they were free to leave the experiment at any time, and that their data was analyzed anonymously. Participants in both experiments were recruited on a voluntary basis from the students and acquainted interested persons. Some students got course credit for participation. Others shared a professional or private interest in the study and its methodology and therefore volunteered to participate. The research reported in this manuscript was carried out according to the princi-ples expressed in the Declaration of Helsinki. No other than the personal identifying informa-tion reported in this manuscript were collected (seeMethodssection).
Development of Measurement Smartphone App
We conducted a pilot study to design and accompany the development of the measurement instrument. In this phase, we interviewed 11 persons with different backgrounds, i.e. different age, gender, musicians and non-musicians, for their preferred way of describing music experi-ence in an embodied way. After testing two favorites in a prototypical stage, participants opted for performing free movements while holding their smartphone device over drawing lines. Hence, an Android App was developed iteratively applying the think-aloud method to inte-grate participants’feedback as described by [24].
The choice for Android was due to a wider spread of Android devices that could enable us to repeat the experiment with a lager sample size in the future. The app presented the music sti-muli to participants and simultaneously recorded accelerometer data from smartphone sensors (for more details, we want to refer to the documentation for Android Developers [25]). After-wards, it presented nine emotional attributes taken from the GEMS-9 short version. Here, par-ticipants were instructed to rate the emotional qualities of the music excerpts presented. Screenshots showing the App are available as Supporting InformationS2 Fig.
Stimulus Selection
Music used in both experiments was selected in a participatory approach [26] based on sugges-tions by the participants of the pilot study according to the following criteria:
1. account for a variety of field participants’preferences
2. cover the range of the GEMS-9
3. keep the balance betweenfemaleandmaleartists
4. do not let emotions be covered in a stereotypical way liketendernessbyfemaleartists or ten-sionbymaleartists
5. artists of different color
6. cover a variety of genres
For each musical piece, an excerpt of*40s duration was chosen such that it was as
homo-geneous as possible w.r.t GEMS qualities during this time.
Motion Data Analysis
1. get raw acceleration data from motion sensor for x, y and z in 3D space
2. cut beginning (first 5s) and end to standardize duration d of signals to d = 35s
3. resample with sample rate*5.7Hz
4. apply PCA to x, y and z
5. extract motion features
6. normalize range of motion features intra-individually
7. split data set into training (50%) and test (50%) set
8. stepwise select features on training set and fit linear regression model for each GEMS feeling
9. evaluate model quality on test set for each GEMS feeling
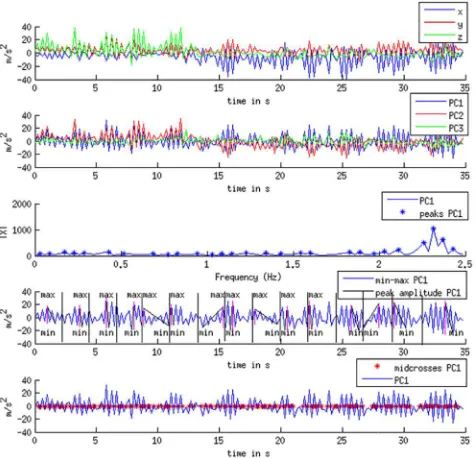
Motion Feature Extraction. As participants needed a few seconds to fully get into the movement, the first five seconds were cut from the beginning of the motion data. Prior to feature extraction we applied aPrinciple Component Analysis(PCA) to each recording of accelerometer data (per stimulus and participant). That way, the x-, y- and z-dimensions were transformed to three principal components PC1, PC2 and PC3. This helped to enhance the comparability of movements between participants, e.g. to account for different ways of holding a device. We did not apply PCA in order to compress data, all dimensions were kept. Furthermore, we did not extract direction-relevant features that would have spoken against applying a PCA.Table 1
shows an overview on the features extracted to characterize the movement, categorized into
tempo,size,regularityandsmoothness. The statistical featuresabsolute skewness,medianand
standard deviation (std)are computed to get a time compressed representation of the features extracted from the time series of motion data. As most features were not normally distributed, we chose to compute themedianover themean. During the selection of features we learned that thestandard deviationstill served as a significant feature to represent the degree of variance in the distribution. In order to remove any inter-individual differences in movement size, all fea-tures were subsequently range-normalized intra-individually to the interval [0-1].Fig 1shows an example of one accelerometer recording before and after applying PCA. Here, the extraction of different features is illustrated. When results are described, we will refer to positive accelera-tion in eigenspace asforwardand to negative acceleration in eigenspace asbackwardmovement.
Model Fitting. We fitted one linear regression model for every GEMS feeling, with all motion features as predictor variables. There was no strong multi-collinearity between motion features indicated by the fact, that for any predictor, theVariance Inflation Factorwas smaller than 10. Stimulus order effects could have resulted in anemotional aftergloweffect of stimuli (e.g. the rating of the second piece is influenced by the rating of the first one), violating the assumption of observational independence in linear regression models. However, no such effect could be observed in test plots on autocorrelation of residuals and test plots mappingorder
against residuals. Features were selected using the forward stepwise algorithm for linear regres-sion [27]. Before selecting the features and fitting the model, the data was partitioned into train-ing and test set,*50% each, in order to evaluate each model’s ability to generalize with unseen
data. The test set was compiled by randomly selecting five observations from each participant.
Experiment 1
2.1 Method
Stimuli. The musical stimuli for the first experiment were compiled by the pilot study’s participants according to the criteria described in the General Methods section.Table 2shows the final list of musical excerpts. The list of samples was presented in random order for each participant. However, they were then free to choose the preferred order in which to assess the samples.
[image:7.612.39.567.88.387.2]Participants. For this experiment, we recruited 22 participants from the Master of Science programAudio Communication and Technologyat TU Berlin. They had an average age of 27 years (SD = 2.36). 73% identified as‘male’, 18% as‘female’, 5% as‘rather male’and another 5% did not identify with any gender. 91% were experienced in playing an instrument, the produc-tion of music or singing in a choir. 5% only had short term experience in making music beyond classes in school and 5% indicated to have no experience at all. 36% already participated in dancing classes or similar activities for which movement is related to music. 50% were only dancing occasionally in clubs or on concerts. 14% had no experience at all in moving to music. 82% are regularly using a smartphone, 9% are experienced in using a smartphone but do not use one now and 9% are not using one at all. Participants also indicated, that for them they
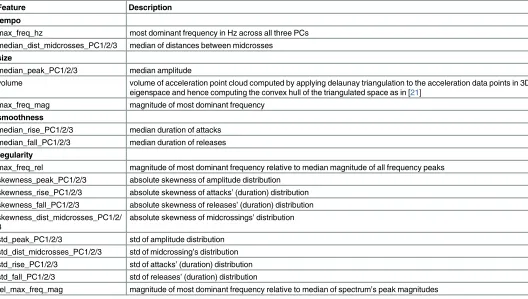
Table 1. List of Extracted Motion Features.
Feature Description tempo
max_freq_hz most dominant frequency in Hz across all three PCs median_dist_midcrosses_PC1/2/3 median of distances between midcrosses
size
median_peak_PC1/2/3 median amplitude
volume volume of acceleration point cloud computed by applying delaunay triangulation to the acceleration data points in 3D-eigenspace and hence computing the convex hull of the triangulated space as in [21]
max_freq_mag magnitude of most dominant frequency smoothness
median_rise_PC1/2/3 median duration of attacks median_fall_PC1/2/3 median duration of releases regularity
max_freq_rel magnitude of most dominant frequency relative to median magnitude of all frequency peaks skewness_peak_PC1/2/3 absolute skewness of amplitude distribution
skewness_rise_PC1/2/3 absolute skewness of attacks’(duration) distribution skewness_fall_PC1/2/3 absolute skewness of releases’(duration) distribution skewness_dist_midcrosses_PC1/2/
3
absolute skewness of midcrossings’distribution
std_peak_PC1/2/3 std of amplitude distribution std_dist_midcrosses_PC1/2/3 std of midcrossing’s distribution std_rise_PC1/2/3 std of attacks’(duration) distribution std_fall_PC1/2/3 std of releases’(duration) distribution
rel_max_freq_mag magnitude of most dominant frequency relative to median of spectrum’s peak magnitudes
Notes: PC1/2/3 =first, second, and third principal component of movement data. For the computation ofamplitudethe data series is split into N = 15 segments. For each segment, Matlab’speak2peakmethod is called to compute the absolute distance between minimum and maximum (see pink vertical line in fourth subplot ofFig 1). Midcrosses are the points in time when the signal crosses the mid reference level. They are computed by calling Matlab’s
midcrossesfunction with a tolerance level of 45%. The rise and fall times, computed with Matlab’srisetimeandfalltimefunctions, indicate the time passed between one local minimum and the following local maximum (rise) and vice versa for fall. Volume of the acceleration data point cloud is computed by Matlab’sdelaunayTriangulationandconvexHullfunctions. Matlab’s Fast Fourier Function (fft) was applied to determine the most dominant frequency.
most formative music genres were Rock(68%), Electro(55%), Hip Hop(32%), Classic
(27%), Metal (22%), Jazz (23%), Punk (23%), Pop(18%), Dub(step) (18%) and Reggae (14%).
(Note:several similar subgenres were grouped to one).
[image:8.612.202.440.79.308.2]Procedure. The laboratory used was illuminated only slightly and offered enough space to move freely. The app ran on a Motorola Moto G with Android Version 4.4. Participants wore AKG headphones featuring a 1,5m long cable. During the experiment, they were alone in the lab with doors closed. Before, a guided test tour through the app was given in order to familiarize participants with the experiment. They were informed that the study was about describing the music corporeally and to rate it in terms of the GEMS. They did not know that,
Fig 1. Example of Extracted Features for the Movements of one Participant to the Music Excerpt
Wargasm, Experiment 1: The figure shows a participant performing large and fast movements.After about 12s the direction of movement changed, probably for ergonomic reasons (first subplot). Principle components of accelerometer data are shown in the second subplot. The third subplot indicates that the maximum frequency magnitude lies at a high frequency. The fourth subplot visualizes the computation of the signals’amplitudes (only for PC1). The stars in the fifth subplot show the midcrosses of the motion signal.
doi:10.1371/journal.pone.0154360.g001
Table 2. List of Music Excerpts First Experiment.
Artist/Band Title Genre
L7 Wargasm Punk
Souad Massi Raoui Folk Rock
Adele Rolling in the Deep Pop
Bruno Mars Count on Me Pop
Air La Femme d’Argent Electronica
Two Fingers Sweden Grime
Bob Marley Corner Stone Reggae
Mel Bonis Berceuse Op.23 No.1 Classic
Andy Allo People Pleaser Funk
David Bowie Rebel Rebel Rock’n Roll
[image:8.612.200.571.554.697.2]subsequently their GEMS ratings would be predicted from movement. We also told them that there was no right or wrong way to move to the music.
After a participant selected a song, the first step was to listen to the song in order to be pre-pared for the corporeal articulation. Participants could stop the presentation of the excerpt early when they decided that they knew the music already well enough to describe it.
Afterwards, the movements were actually recorded by the device’s acceleration sensor syn-chronized to the music. For this part of the study participants were instructed as follows: “Please move now with the device according to the music. It is important that you stand and don’t sit during motion capturing. You can move freely, i.e. all parts of the body, but keep in mind that only movement of the device can be captured.”
After each embodied description participants rated the perceived emotional qualities of the musical excerpts according to the GEMS-9 on a 100-point, unipolar intensity scale initialized to‘0’(Table 3). They were instructed as follows:“Please rate the perceived emotional quality of the music according to the GEMS-9. Do not rate how youfeltduring listening.”Subsequent to the GEMS, participants were asked how suitable they considered both embodied and verbal descriptions for the music excerpt. At the end of the experiment participants were asked to fill out a short socio-biographical questionnaire.
Results and Discussion
[image:9.612.199.578.97.361.2]Similarities between Movements and GEMS for First Experiment. The fixed effects fromTable 4indicate that music perceived astranscendentwas related to a rather irregular tempo of movement (std_dist_midcrosses). Forwonderthe movement’s size (std_peak) was irregular in the second component and regular (skewness_peak) in the first principle compo-nent.Powerrelated to regular and large movements.Tendernesswas described by small
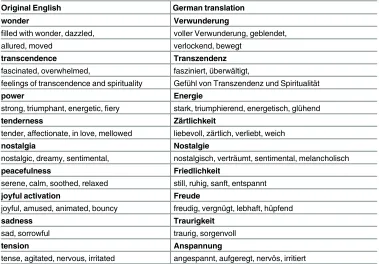
Table 3. Emotion Ratings Items: Participants rated their experience of nine German GEMS categories (each defined by three additional adjectives).
Original English German translation
wonder Verwunderung
filled with wonder, dazzled, voller Verwunderung, geblendet,
allured, moved verlockend, bewegt
transcendence Transzendenz fascinated, overwhelmed, fasziniert, überwältigt,
feelings of transcendence and spirituality Gefühl von Transzendenz und Spiritualität
power Energie
strong, triumphant, energetic,fiery stark, triumphierend, energetisch, glühend tenderness Zärtlichkeit
tender, affectionate, in love, mellowed liebevoll, zärtlich, verliebt, weich
nostalgia Nostalgie
nostalgic, dreamy, sentimental, nostalgisch, verträumt, sentimental, melancholisch peacefulness Friedlichkeit
serene, calm, soothed, relaxed still, ruhig, sanft, entspannt joyful activation Freude
joyful, amused, animated, bouncy freudig, vergnügt, lebhaft, hüpfend
sadness Traurigkeit
sad, sorrowful traurig, sorgenvoll
tension Anspannung
tense, agitated, nervous, irritated angespannt, aufgeregt, nervös, irritiert
Table 4. Fixed Effects Modeling Parameter Estimates for GEMS Ratings and their Principle Components of First Experiment Predicted via Motion Features Related toSize,Rate,RegularityandSmoothnessof the Movement.
fixed effects estimate SE t-statistic p-value
GEMS-9 transcendence
intercept 18.1 4.5 4.0 .0002
std_dist_midcrosses_PC1 32.5 11.1 2.9 .0050
wonder
intercept 20.7 6.0 3.4 .0012
skewness_peak_PC1 -22.9 9.8 -2.3 .0228
std_peak_PC2 36.7 9.6 3.8 .0004
power
intercept 21.1 5.6 3.7 .0005
median_peak_PC1 70.3 11.6 6.1 <.0001
std_peak_PC3 -29.5 12.1 -2.4 .0185
tenderness
intercept 69.9 6.1 11.5 <.0001
median_peak_PC1 -67.5 9.8 -6.9 <.0001
std_rise_PC3 38.4 12.1 3.2 .0025
std_fall_PC3 -32.6 14.0 -2.3 .0241
nostalgia
intercept 59.9 7.9 7.6 <.0001
median_peak_PC1 -57.1 10.6 -5.4 <.0001
skewness_fall_PC2 -23.0 10.5 -2.2 .0324
skewness_fall_PC3 28.4 11.2 2.5 .0147
peacefulness
intercept 60.3 7.3 8.3 <.0001
median_peak_PC1 -46.5 13.0 -3.6 .0007
joyful activation
intercept 42.7 4.5 9.5 <.0001
std_rise_PC3 42.8 12.4 3.5 .0011
std_fall_PC3 -39.6 14.6 -2.7 .0089
sadness
intercept 11.6 4.0 2.9 .0057
median_dist__midcrosses_PC1 36.3 8.9 4.1 .0002
tension
intercept -8.9 7.9 -1.1 .2649
std_dist_midcrosses_PC1 28.7 10.9 2.6 .0114
median_peak_PC1 30.5 10.1 3.0 .0040
skewness_fall_PC3 23.5 10.2 2.3 .0255
PRINCIPLECOMPONENTS OFGEMS-9
PC-1 relaxation
intercept 1.0 .2 5.6 <.0001
median_peak_PC1 -2.1 .3 -6.4 <.0001
PC-2 positive valence
intercept 0.3 .2 1.8 .0733
median_dist_midcrosses_PC2 -0.8 .4 -2.2 .0035
(median_peak) movements with regular backward (std_fall) and irregular forward (std_rise) gestures.Nostalgiawas also described by small movements (median_peak) with irregularly smooth backward movements in the third component and regular ones in the second compo-nent (skewness_fall). In contrast topower,peacefulnessis characterized by small movements. When participants rated music asjoyful, they performed movements with regular backward phases and less regular forward movements like jumping. Forsadnessmovements were slow while fortensionmovements were primarily large with irregular tempo.
Fig 2shows that participants preferred rating on GEMS to describe their experience when they perceivednostalgia, sadness, tenderness or peacefulness. Forjoy,powerandwonder partici-pants preferred embodied descriptions. Fortensionandtranscendencewe did not observe such an association between feeling rating and description preference.
[image:11.612.203.442.79.273.2]Prediction Results. Table 5indicates thattenderness,powerandnostalgiawere predicted best, followed bytension,wonderandsadness. Forpeacefulnessandjoyaround 20% of variance
Fig 2. Spearman Correlation of GEMS and Description Preferences (Embodied vs. GEMS) for First Experiment.
[image:11.612.34.580.519.700.2]doi:10.1371/journal.pone.0154360.g002
Table 5. R-Squared and RMSE for first experiment ranked according to theirR2on the training set.
rmse (training) R2(training) p-value (training) rmse (test) R2(test) GEMS-9
tenderness 22.8 .497 <.0001 31.9 .732
power 22.8 .423 <.0001 26.2 .538
nostalgia 24.7 .423 <.0001 27.2 .582
tension 22.6 .284 .0006 27.9 .206
wonder 23.5 .247 .0006 24.4 .574
sadness 22.1 .238 .0002 21.2 .240
peacefulness 30.8 .196 .0007 32.9 .230
joyful activation 23.9 .193 .0038 32.8 .205
transcendence 24.0 .139 .0051 24.4 .275
PCs of GEMS-9
PC-1 relaxation 0.8 .439 <.0001 0.8 .504
PC-2 positive valence 1.0 .082 .035 1.1 .079
in the data could be explained by the fitted regression models.Transcendencewas most difficult to predict because only 14% of the variance in the data could be explained through the motion data. Since for both, the training and test data set, a comparable amount of variance could be explained, there was no evidence for overfitting of the model to the data.
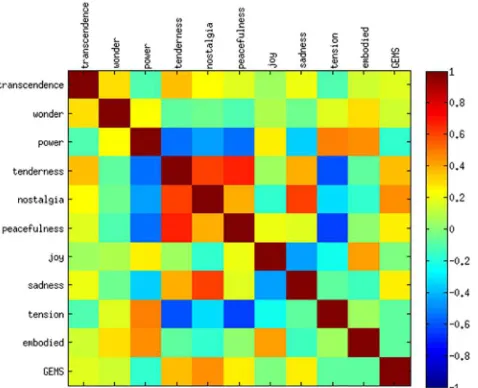
Since we asked participants to rate the intensity of experience of the different GEMS, most feelings are likely to be correlated with the overall intensity or arousal of emotional experience (seeFig 2). Here, most feelings show small to large correlations withpower. Therefore, we applied a PCA on these rating data, in order to represent emotional experience with less dimensions. A resulting arousal component in the GEMS rating could be interpreted as describing the quantity or intensity of the feeling, whereas a valence component as describing the quality. That way, we could identify, if there are potential differences in predicting the quantity/intensity and quality of emotional experience from movement data.
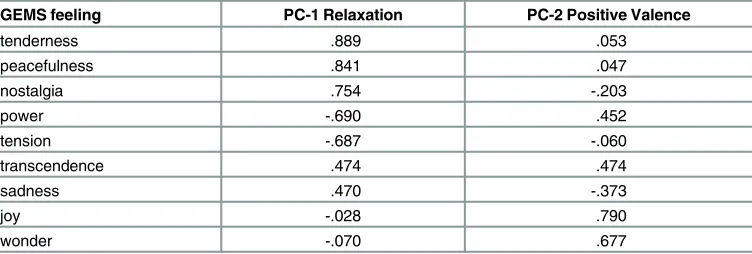
Based on the Elbow Method we extracted two components explaining most of the variance in the data.Table 6visualizes the item loadings of the eigenvectors having the highest eigenval-ues. The first PC might be interpreted as the degree ofrelaxationas it got high positive loadings fortenderness,peacefulnessandnostalgia, but high negative loadings forpowerandtension. Accordingly, it represents the opposite of arousal. The second PC might be interpreted as posi-tive valenceas it got high positive loads forjoyandwonder, but a negative loading forsadness. Hence, the interesting question was whether the motion features only predicted the degree of
relaxation(vs.arousalandactivation) or if they could also explain degrees ofvalenceinherent in the experienced emotionality. The estimates for the fixed effects inTable 4show that relaxa-tionwas expressed by small movements whilepositive valencerelated to fast movements. Fur-thermore, the prediction results fromTable 5indicate that forrelaxationabout 44% of the variance in data could be described by the fitted regression models, while only 8%positive valencevariance is explained. As prediciton accuracy is similar on both training and test set, there was no overfitting of the model to the data.
[image:12.612.200.576.88.215.2]Discussion. The findings in predicting the relaxation and valence components indicate, that not only arousal or intensity was predicted in the GEMS ratings, but also the quality of perceived emotion, i.e.positive valence. However, only 8% of the variance in valence were cov-ered by the approach. Therefore, these results are similar to those of [21]. This could be explained by the fact there were several GEMS with little mean intensity and little variance as can be seen from the polarity profile inFig 3. Examples aretranscendence,sadness,wonder, andtension. Even thoughjoyshowed a rather high degree of variance according to the polarity profile, its prediction turned out to be difficult in this experiment. There might not have been a
Table 6. Principle Component Loadings of GEMS Ratings of First Experiment.
GEMS feeling PC-1 Relaxation PC-2 Positive Valence
tenderness .889 .053
peacefulness .841 .047
nostalgia .754 -.203
power -.690 .452
tension -.687 -.060
transcendence .474 .474
sadness .470 -.373
joy -.028 .790
wonder -.070 .677
Notes: Components were rotated using thevarimaxmethod.
common movement pattern throughout participants for music perceived asjoyful. In general, it also should to be noted that there have not been enough music excerpts to sufficiently cover all states of the GEMS. We therefore conducted a second experiment with a different set of sti-muli that were chosen to cover more different GEMS feelings.
Experiment 2
Experiment 2 was conducted in order to test, if the findings from Experiment 1 could be repli-cated. Furthermore, different music stimuli were chosen in order to cover more states of the GEMS. We also asked for more feedback concerning the movement patterns used from partici-pants. Doing so, we tested the following two hypotheses:“Participants prefer embodied rhyth-mic-related descriptions when they perceivepower,tensionorjoy”and“Participants prefer embodied gestalt-related descriptions or verbal descriptions (GEMS) when they perceive sub-limity-related feelings likenostalgiaortranscendence”. We assumed that sublimity-related musi-cal emotions were more related to musimusi-cal contour and melody. Thus, we assumed participants to imitate musical contour by performing gestures that are more gestalt-like and less rhythmic.
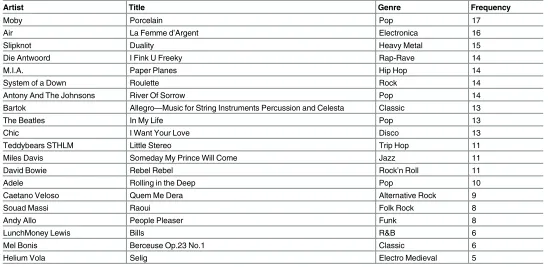
Stimuli. After the first experiment, during which participants were not free to choose the music they described corporeally, we thought it might further improve prediction results, if participants chose the music themselves. The study from Liljeström, Juslin and Västfjäll observed that emotions were perceived more intensely when participants chose the music themselves [28]. Therefore, we asked them to propose music in order to compile a list from which they could chose 10 samples out of 20.Table 7shows the final list of musical excerpts used and how often participants chose each excerpt in absolute numbers.
[image:13.612.201.442.76.350.2]Participants. 21 students participated from the following courses:Audio Communication and Technology(40%), engineering in the field of technical environmental protection (20%),
Fig 3. Polarity Profile of Mean GEMS Ratings for the First Experiement.
and others 40%. Participants had an average age of 28 years (SD = 3.0). 76% identified as ‘male’, 19% as‘female’and 5% did not identify with any gender. 72% were experienced in play-ing an instrument, the production of music or splay-ingplay-ing in a choir. 29% only had short term or no experience in making music beyond classes in school. 52% already participated in dancing classes or similar activities for which movement is related to music. 81% were only dancing occasionally in clubs or on concerts. 9% had only little or no experience at all in movement to music. 81% are regularly using a smartphone, 19% do not.
Procedure and Data Analysis. Procedure and data analysis were conducted as in the first experiment with the exception of the following minor changes:
1. All scales were initialized to‘50’instead of‘0’to equalize the effort to move the slider in either direction.
2. The German translation of the GEMS-9 was adjusted to the one from Lykartsis et al. that could be confirmed to fit [29].
3. Two additional questions were added to the post-experiment questionnaire:“How suitable do you consider a corporeal description of this music excerpt by movement according to musical contour?”and“How suitable do you consider a corporeal description of this music excerpt by movement according to rhythm?”(seeS2 Fig). These two questions should pro-vide additional information about the preference for certain movement patterns.
Results and Discussion
[image:14.612.33.583.88.355.2]Similarity between Movements and GEMS for Second Experiment. As you can observe from Tables8and9, no significant features were found fortranscendence. Unlike the first experiment, music featuringwonderwas described by slow (median_dist_midcrosses)
Table 7. List of Music Excerpts for Second Experiment: Songs are ranked according to the frequency they were chosen by the participants.
Artist Title Genre Frequency
Moby Porcelain Pop 17
Air La Femme d’Argent Electronica 16
Slipknot Duality Heavy Metal 15
Die Antwoord I Fink U Freeky Rap-Rave 14
M.I.A. Paper Planes Hip Hop 14
System of a Down Roulette Rock 14
Antony And The Johnsons River Of Sorrow Pop 14
Bartok Allegro—Music for String Instruments Percussion and Celesta Classic 13
The Beatles In My Life Pop 13
Chic I Want Your Love Disco 13
Teddybears STHLM Little Stereo Trip Hop 11
Miles Davis Someday My Prince Will Come Jazz 11
David Bowie Rebel Rebel Rock’n Roll 11
Adele Rolling in the Deep Pop 10
Caetano Veloso Quem Me Dera Alternative Rock 9
Souad Massi Raoui Folk Rock 8
Andy Allo People Pleaser Funk 8
LunchMoney Lewis Bills R&B 6
Mel Bonis Berceuse Op.23 No.1 Classic 6
Helium Vola Selig Electro Medieval 5
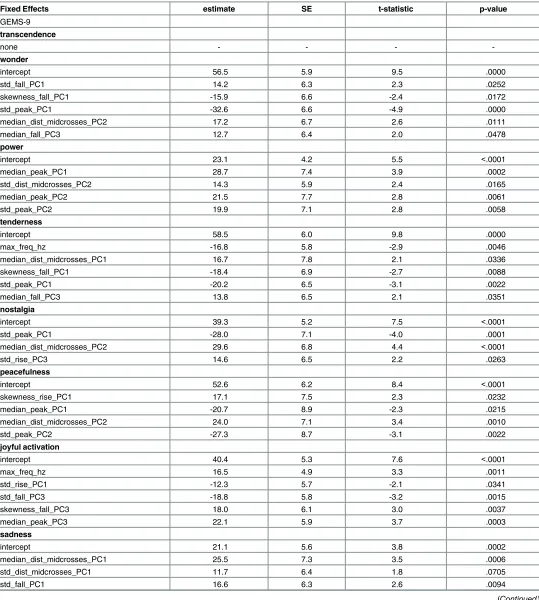
Table 8. Fixed Effects Modeling Parameter Estimates for GEMS Ratings and their Principle Components of Second Experiment Predicted via Motion Features Related toSize,Rate,RegularityandSmoothnessof the Movement.
Fixed Effects estimate SE t-statistic p-value
GEMS-9 transcendence
none - - -
-wonder
intercept 56.5 5.9 9.5 .0000
std_fall_PC1 14.2 6.3 2.3 .0252
skewness_fall_PC1 -15.9 6.6 -2.4 .0172
std_peak_PC1 -32.6 6.6 -4.9 .0000
median_dist_midcrosses_PC2 17.2 6.7 2.6 .0111
median_fall_PC3 12.7 6.4 2.0 .0478
power
intercept 23.1 4.2 5.5 <.0001
median_peak_PC1 28.7 7.4 3.9 .0002
std_dist_midcrosses_PC2 14.3 5.9 2.4 .0165
median_peak_PC2 21.5 7.7 2.8 .0061
std_peak_PC2 19.9 7.1 2.8 .0058
tenderness
intercept 58.5 6.0 9.8 .0000
max_freq_hz -16.8 5.8 -2.9 .0046
median_dist_midcrosses_PC1 16.7 7.8 2.1 .0336
skewness_fall_PC1 -18.4 6.9 -2.7 .0088
std_peak_PC1 -20.2 6.5 -3.1 .0022
median_fall_PC3 13.8 6.5 2.1 .0351
nostalgia
intercept 39.3 5.2 7.5 <.0001
std_peak_PC1 -28.0 7.1 -4.0 .0001
median_dist_midcrosses_PC2 29.6 6.8 4.4 <.0001
std_rise_PC3 14.6 6.5 2.2 .0263
peacefulness
intercept 52.6 6.2 8.4 <.0001
skewness_rise_PC1 17.1 7.5 2.3 .0232
median_peak_PC1 -20.7 8.9 -2.3 .0215
median_dist_midcrosses_PC2 24.0 7.1 3.4 .0010
std_peak_PC2 -27.3 8.7 -3.1 .0022
joyful activation
intercept 40.4 5.3 7.6 <.0001
max_freq_hz 16.5 4.9 3.3 .0011
std_rise_PC1 -12.3 5.7 -2.1 .0341
std_fall_PC3 -18.8 5.8 -3.2 .0015
skewness_fall_PC3 18.0 6.1 3.0 .0037
median_peak_PC3 22.1 5.9 3.7 .0003
sadness
intercept 21.1 5.6 3.8 .0002
median_dist_midcrosses_PC1 25.5 7.3 3.5 .0006
std_dist_midcrosses_PC1 11.7 6.4 1.8 .0705
std_fall_PC1 16.6 6.3 2.6 .0094
movements with irregular and longer backward phases (median_fall and std_fall). Though,
wonderwas related to regular backward phases at the same time (skewness_fall). Furthermore, gestures were of regular size (std_peak). As in Experiment 1poweris reflected by large move-ments but of varying size (std_peak) and speed (std_dist_midcrosses).Tendernesswas related to slow motion (max_freq_hz and median_dist_midcrosses) of regular size and longer back-ward phases.Nostalgia, too, was performed by slow and regularly sized movements but with irregularly long forward phases. Similar to the first experiment,peacefulnesswas characterized by small movements. During the second experiment, additionally slow and regularly sized ges-tures were observed.Joy, however, stimulated regular, large and fast gestures. In the second experimentsadnesswas correlated to tempo being slow and irregular. Here,tensionwas charac-terized by fast but large movements. The gesture’s size was a significant feature during the first experiment, too.
Confirming both of our hypotheses on description preferences, participants preferred GEMS and gestalt movements referring to melodic contour to describe their experience when they perceivedwonder, sadness, tenderness, peacefulness or nostalgia(seeFig 4). Forjoyand
powerparticipants preferred embodied and rhythmic descriptions. Fortensionand transcen-dencewere not related to description preference.
Prediction Results for Second Experiment. Table 10shows thatpowerandtenderness
[image:16.612.27.579.90.192.2]were also among the top prediction results for the second experiment. This time, however,
Table 8.(Continued)
Fixed Effects estimate SE t-statistic p-value
skewness_fall_PC1 -18.9 7.1 -2.7 .0086
std_fall_PC3 14.6 5.8 2.5 .0141
tension
intercept 40.3 5.4 7.5 <.0001
volume 27.1 6.7 4.1 .0001
skewness_rise_PC1 -19.3 7.5 -2.6 .0116
median_dist_midcrosses_PC2 -31.0 6.9 -4.5 <.0001
[image:16.612.34.578.497.692.2]doi:10.1371/journal.pone.0154360.t008
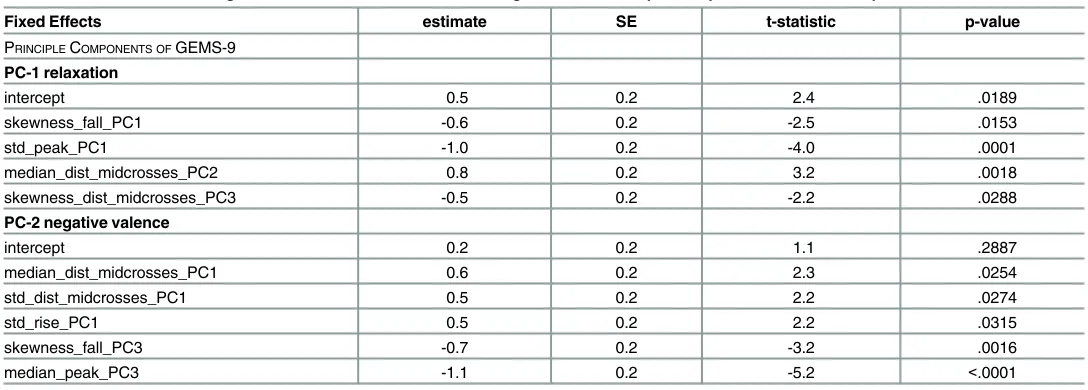
Table 9. Fixed Effects Modeling Parameter Estimates for GEMS Ratings and their Principle Components of Second Experiment CONTINUED.
Fixed Effects estimate SE t-statistic p-value
PRINCIPLECOMPONENTS OFGEMS-9
PC-1 relaxation
intercept 0.5 0.2 2.4 .0189
skewness_fall_PC1 -0.6 0.2 -2.5 .0153
std_peak_PC1 -1.0 0.2 -4.0 .0001
median_dist_midcrosses_PC2 0.8 0.2 3.2 .0018
skewness_dist_midcrosses_PC3 -0.5 0.2 -2.2 .0288
PC-2 negative valence
intercept 0.2 0.2 1.1 .2887
median_dist_midcrosses_PC1 0.6 0.2 2.3 .0254
std_dist_midcrosses_PC1 0.5 0.2 2.2 .0274
std_rise_PC1 0.5 0.2 2.2 .0315
skewness_fall_PC3 -0.7 0.2 -3.2 .0016
median_peak_PC3 -1.1 0.2 -5.2 <.0001
sadness,joy,peacefulnessandwonderscored much higher in terms ofR2whereasnostalgia, ten-sionandtranscendencewere among the GEMS being most difficult to predict. Since for both, the training and test data set, a comparable amount of variance could be explained, there was no evidence for overfitting of the model to the data.
GEMS ratings for the second experiment were similarly correlated like in the first one (see
S1 Fig). Applying PCA to the GEMS rating data also resulted in two components explaining most of the variance in the data (according to the Elbow Method).Table 11indicates that relax-ationandnegative valencewere present as most dominant principle components. For relaxa-tionloadings were again highly positive fortenderness,peacefulnessandnostalgia, but highly negative loads fortension. The second PC got high negative loads forjoy, but positive loads for
sadness.
[image:17.612.204.442.79.273.2]In contrast to the first experiment, estimates for the fixed effects (Table 9) show that relaxa-tionwas expressed by slow and regular movements whilenegative valencerelated mainly to
Fig 4. Spearman Correlation of GEMS and Description Preferences (Embodied (Gestalt or Rhythm), GEMS) for Second Experiment.
doi:10.1371/journal.pone.0154360.g004
Table 10. R-Squared and RMSE for Second Experiment Ranked According to theirR2on the Training Set.
rmse (training) R2(training) p-value (training) rmse (test) R2(test) GEMS-9
power 19.0 .494 <.0001 27.3 .375
tenderness 23.0 .385 <.0001 26.2 .388
sadness 23.1 .346 <.0001 29.2 .322
peacefulness 24.4 .345 <.0001 25.7 .303
wonder 23.2 .343 <.0001 25.0 .586
joyful activation 21.9 .325 <.0001 24.4 .276
nostalgia 25.1 .295 <.0001 26.3 .334
tension 24.8 .265 <.0001 27.3 .266
transcendence - - - -
-PCs of GEMS-9
PC-1 relaxation .9 .330 <.0001 .9 .450
PC-2 negative valence .9 .354 <.0001 .9 .368
[image:17.612.34.580.519.700.2]small and slow movements. This time, prediction results (Table 10) indicate that forrelaxation
andnegative valenceabout one third of the variance in data could be described by the fitted regression models. Since for both, the training and test data set, a comparable amount of vari-ance could be explained, there was no evidence for overfitting of the model to the data.
Discussion. The second study confirmed that there were two principal components in the GEMS ratings:relaxationand(positive/negative) valence. This time, forrelaxationandvalence
approximately same amounts of variance could be explained by the regression models. That might probably be due to the fact that for the second experimentjoyfulexperiences could be predicted to a much better degree. Alsosadnessandpeacefulnesswere predicted better, while fortranscendenceno regression model could be fitted since there were no significant features. In general, prediction results from the first experiment were slightly worse. That might be due to the chosen samples or the participants’movement patterns or both. Another possibility is that participants did not keep up movement speed or size over the whole period of the musical excerpt and e.g. only moved half-time for fast music. That is why, they might sometimes not be able to describe the experience corporeally, though they rate it as morepowerful. Hence, for ergonomic and biomechanical reasons, corporeal descriptions and GEMS ratings might drift apart (cf. [[12]pp. 112–114]). One countermeasure could be to inspect the motion data in dif-ferent time windows and to chose the window featuring maximum speed or size, instead of simply averaging over the whole time. The extracted motion features already covered a good degree of rhythmic qualities but were ignorant of the course and direction of the movement expressed. These gestalt features could be particularly important when it comes to complex emotional expressions in music likenostalgia.
General and Concluding Discussion
Results for both experiments showed that movements predicted botharousaland in Experi-ment 2 alsovalence. The quality of prediction for different degrees of GEMS also varied between experiments forjoy,sadness,transcendence,wonderandtension, for others likepower
orpeacefulnessresults could be reproduced. For many GEMS feelings, participants applied similar movement patterns across the two experiments (cf. Tables4,8and9).
[image:18.612.196.577.88.215.2]These movement patterns often follow the similar principles reported in previous studies of [17] and [8]. There,joy or happinesswas consistently associated with medium sound levels, high tempi and small timing variation. The size (large) of the movement (equaling sound level) and small timing variation were significant features for the second experiment. Furthermore, like both studies cited, we also showed thatsadnesswas correlated with irregular and slow movements.
Table 11. Principle Component Loadings of GEMS ratings of Second Experiment.
GEMS feeling PC-1 relaxation PC-2 negative valence
tenderness .781 .336
peacefulness .778 .214
nostalgia .745 .334
wonder .717 .296
tension -.697 .027
transcendence .494 -.353
joy .028 -.855
sadness .343 .714
power -.229 -.599
Notes: Components have been rotated using to thevarimaxmethod.
Considering the prediction results, there are some possible explanations for the better results of the more rhythm-related feelings (e.g.power, cf.Fig 4) over those requiring presumably more additional gestalt elements: Emotions likenostalgiaandtranscendencecall for features that are less bound to rhythm but to the musical contour like directional and time series features. Acceler-ation data seems to not sufficiently covernostalgicortranscendentgestures. As acceleration does not determine the absolute position in space, it is particularly difficult for slow but big gestures to be captured. This calls for applying different and more sophisticated motion sensor fusion tech-niques. Participants preferred the embodied description for the moreenergeticandjoyfulmusical excerpts (cf. Figs2and4) and hence, they might also not be trained to express certain feelings likesadnessortranscendencein a corporeal way. Furthermore, there might be significant inter-individual differences in how participants are able to express feelings through movement that would also be an interesting topic of future investigations. Also, given the often reported high inter-individual variance of musical emotion, a much larger data set would be desirable. This would allow to model the different individual or stimulus specific sources of variance in the data.
Conclusion
This study evaluated the predictive power of mobile-device generated acceleration data pro-duced by free movement during music listening experience for the prediction of different degrees of the Geneva Emotion Music Scales (GEMS-9). The results show that participants con-sidered the corporeal description of music as very suitable and produced movement data that could be used to predict emotion ratings. Hence, this study contributed to the envisioned use case of multimodel querying in two ways: First of all, it emphasizes the user need and acceptance for an innovative embodied access to MIR and MRS. Secondly, it showed that such an approach is technically feasible. Since GEMS that are more related to rhythm could be predicted better, observations suggest that there might still be a lot of hidden potential in additional movement features capturing direction and position in order to describe the gestalt of the movement.
Supporting Information
S1 Fig. Distribution of GEMS Ratings for Music Samples for 2nd Experiment.
(ZIP)
S2 Fig. App Screenshots.
(ZIP)
Acknowledgments
We want to thank Esra Acar and Andreas Lommatzsch (Distributed Artificial Intelligence Lab-oratory, TU Berlin), as well as Petra Lucht (Center for Interdisciplinary Women’s and Gender Studies, TU Berlin) for their support and advice during the development of the instrument and realization of the first experiment. Special thanks also go to the participants of the GENDER PRO MINT (STEM) program who encouraged to choose a participatory approach and who also gave a lot of support to de-gender this project.
Last but not least, we want to thank the participants of the two experiments and the pilot study who gave a lot of constructive and encouraging feedback.
Author Contributions
References
1. Juslin NP, Laukka P. Expression, Perception, and Induction of Musical Emotions: A review and a ques-tionnaire study of everyday listening. Journal of New Music Research. 2004; 33:217–238. doi:10.1080/ 0929821042000317813
2. Saarikallio S, Erkkilä J. The Role of Music in Adolescents’Mood Regulation. Psychology of Music. 2007; 35(1):88–109. doi:10.1177/0305735607068889
3. Egermann H, Fernando N, Chuen L, McAdams S. Music Induces Universal Emotion-Related Psycho-physiological Responses: Comparing Canadian Listeners To Congolese Pygmies. Frontiers in Psy-chology. 2015; 5 (1341). doi:10.3389/fpsyg.2014.01341PMID:25620935
4. Egermann H, Pearce TM, Wiggins AG, McAdams S. Probabilistic Models of Expectation Violation Pre-dict Psychophysiological Emotional Responses to Live Concert Music. Cognitive, Affective, & Behav-ioral Neuroscience.2013; 13(3):533–553. doi:10.3758/s13415-013-0161-y
5. Gomez P, Danuser B. Relationships Between Musical Structure and Psychophysiological Measures of Emotion. Emotion. 2007; 7(2):377–387. doi:10.1037/1528-3542.7.2.377PMID:17516815
6. Soleymani M, Caro NM, Schmidt ME. The MediaEval 2013 Brave New Task: Emotion in Music. In: Pro-ceedings of the MediaEval 2013 Multimedia Benchmark Workshop Barcelona; 2013. Available from:
http://ceur-ws.org/Vol-1043/mediaeval2013_submission_5.pdf.
7. Russell AJ. A Circumplex Model of Affect. Journal of Personality and Social Psychology. 1980; 39 (6):1161–1178.
8. Giordano LB, Egermann H, Bresin R. The Production and Perception of Emotionally Expressive Walk-ing Sounds: Similarities Between Musical Performance and Everyday Motor Activity. PLoS ONE. 2014; 9. doi:10.1371/journal.pone.0115587
9. Longhi E. Emotional Responses in Mother-Infant Musical Interactions: A Developmental Perspective. In: Juslin NP, Västfjäll D editors. Emotional Responses to Music: The Need to Consider Underlying Mechanisms. Behavioral and Brain Sciences; 2008. p. 586–587.
10. Sievers B, Polansky L, Casey M, Wheatley T. Music and Movement Share a Dynamic Structure that Supports Universal Expression of Emotion. PNAS. 2013; 110(1):70–75. doi:10.1073/pnas.
1209023110PMID:23248314
11. Trost W, Schön D, C L, Pichon S, Grandjean D, Vuilleumier P. Getting the Beat: Entrainment of Brain Activity by Musical Rhythm and Pleasantness. NeuroImage. 2014; 103:55–64. doi:10.1016/j.
neuroimage.2014.09.009PMID:25224999
12. Leman M. Embodied Music Cognition and Mediation Technology. London: MIT Press; 2008. 13. Lepa S, Hoklas AK, Guljamow M, Weinzierl S. Wie hören die Deutschen heute Musik? Trends und
Basisdaten zur musikbezogenen Audiomediennutzung 2012 in Deutschland. Media Perspektiven. 2013;(11: ):545–553.
14. Zentner M, Eerola T. Self-Report Measures and Models. In: Juslin NP, Västfjäll D, editors. Handbook of music and emotion: Theory, Research, Applications. Oxford University Press; 2010. p. 187–221. 15. Zentner M, Grandjean D, Scherer KR. Emotions Evoked by the Sound of Music: Characterization,
Clas-sification, and Measurement. Emotion. 2008; 8(4):494–521. doi:10.1037/1528-3542.8.4.494PMID:
18729581
16. Torres-Eliard K, Labbé C, Grandjean D. Towards a Dynamic Approach to the Study of Emotions Expressed by Music. In: Camurri A, Costa C, editors. Intelligent Technologies for Interactive Entertain-ment—4th International ICST Conference. Springer Berlin Heidelberg; 2012. p. 252–259.
17. Juslin NP, Laukka P. Communication of Emotions in Vocal Expression and Music Performance: Differ-ent Channels, Same Code? Psychological Bulletin. 2003; 129(5):770–814. doi:10.1037/0033-2909.
129.5.770PMID:12956543
18. Parncutt R. The perception of pulse in musical rhythm. In: Gabrielsson A, editor. Action and Perception in Rhythm and Music. Royal Swedish Academy of Music; 1987. p. 127–138.
19. Hedder, KM. A new non-verbal measurement tool towards the emotional experience of music; 2010.
http://essay.utwente.nl/60499/1/MSc_Hedder%2C_M.K.pdf(8. Jan. 2015).
20. De Bruyn L, Moelants D, Leman M. An embodied approach to testing musical empathy in subjects with an autism spectrum disorder. Music and Medicine. 2011; 4(1).
21. Amelynck D, Grachten M, van Noorden L, Leman M. Toward E-Motion-Based Music Retrieval a Study of Affective Gesture Recognition. IEEE Transactions on Affective Computing. 2012; 3(2):250–259. doi:
10.1109/T-AFFC.2011.39
23. Juslin NP, Västfjäll D. Emotional responses to music: The Need to Consider Underlying Mechanisms. Behavioral and Brain Sciences. 2008; 31:559–621.
24. Van Someren WM, Barnard FY, Sandberg ACJ. The Think Aloud Method. A practical guide to model-ling cognitive processes. Academic Press; 1994.
25. Motion Sensors—Android Developers;.http://developer.android.com/guide/topics/sensors/sensors_
motion.html(8. Jan. 2016).
26. Bergold J, Thomas S. Participatory Research Methods: A Methodological Approach in Motion. Forum: Qualitative Social Research. 2012; 13(1):191–222.
27. Draper N, Smith H. Applied Regression Analysis. 2nd ed. John Wiley and Sons, Inc.; 1981.
28. Liljeström P, Juslin NP, Västfjäll D. Experimental evidence of the roles of music choice, social context, and listener personality in emotional reactions to music. Psychology of Music. 2012; 41:579–599. 29. Lykartsis A, Pysiewicz A, von Coler H, Lepa S. The Emotionality of Sonic Events: Testing the Geneva