258
6 Appendices
6.1 Simulation Stress Test
6.1.1 Scene Dataset
Figure 6-1 A simulation with a 20% chance of exceptions and a 10% chance of rules based on classifications.
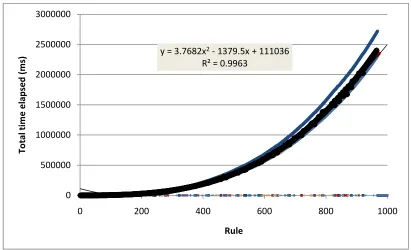
Figure 6-2 A simulation with a 20% chance of exceptions and a 20% chance of rules based on classifications.
y = 3.8098x2- 1421x + 115761 R² = 0.9963
0 500000 1000000 1500000 2000000 2500000 3000000
0 200 400 600 800 1000
T
o
tal
t
im
e
e
lap
se
d
(
m
s)
Rule
y = 3.7682x2- 1379.5x + 111036 R² = 0.9963
0 500000 1000000 1500000 2000000 2500000 3000000
0 200 400 600 800 1000
T
o
tal
t
im
e
e
lap
se
d
(
m
s)
[image:1.595.94.503.204.451.2] [image:1.595.92.503.490.740.2]259
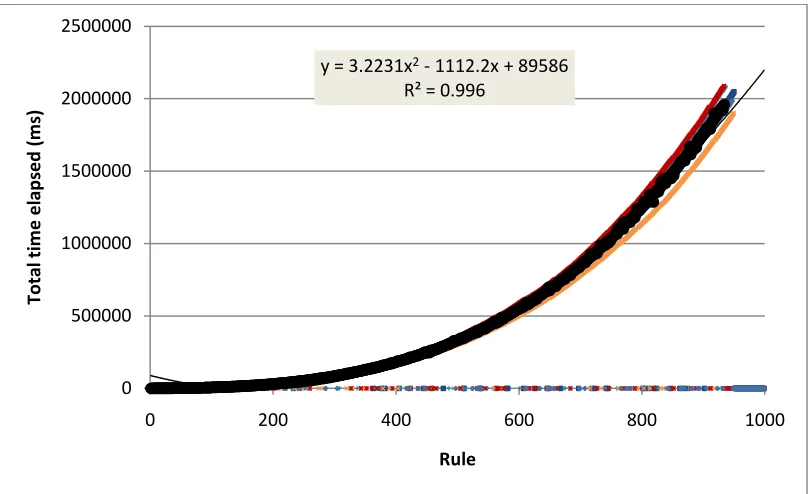
Figure 6-3 A simulation with a 20% chance of exceptions and a 40% chance of rules based on classifications.
Figure 6-4 A simulation with a 20% chance of exceptions and an 80% chance of rules based on classifications.
y = 3.2231x2- 1112.2x + 89586 R² = 0.996
0 500000 1000000 1500000 2000000 2500000
0 200 400 600 800 1000
T
o
tal
t
im
e
e
lap
se
d
(
m
s)
Rule
y = 2.6128x2- 828.87x + 64428 R² = 0.9949
0 500000 1000000 1500000 2000000 2500000
0 200 400 600 800 1000
T
o
tal
t
im
e
e
lap
se
d
(
m
s)
[image:2.595.97.502.70.317.2] [image:2.595.92.502.357.605.2]260
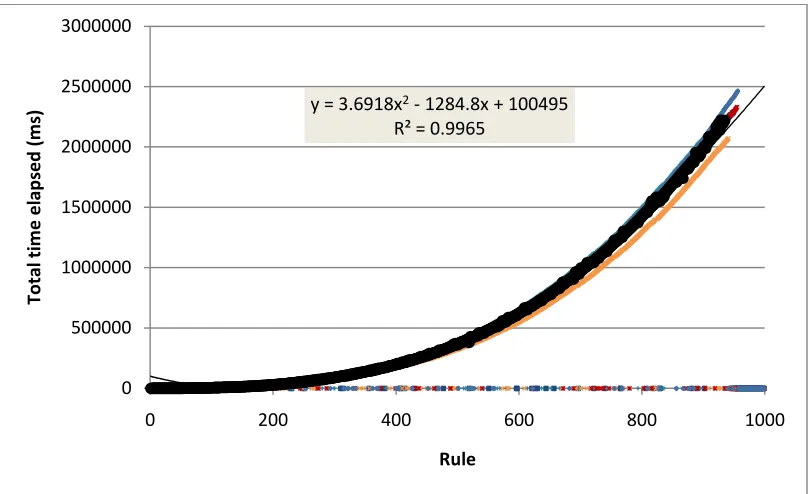
Figure 6-5 A simulation with a 40% chance of exceptions and a 20% chance of rules based on classifications.
Figure 6-6 A simulation with a 40% chance of exceptions and a 40% chance of rules based on classifications.
y = 3.6918x2- 1284.8x + 100495 R² = 0.9965
0 500000 1000000 1500000 2000000 2500000
0 200 400 600 800 1000
T
o
tal
t
im
e
e
lap
se
d
(
m
s)
Rule
y = 3.0971x2- 975.36x + 70201 R² = 0.9963
0 500000 1000000 1500000 2000000 2500000
0 200 400 600 800 1000
T
o
tal
t
im
e
e
lap
se
d
(
m
s)
[image:3.595.97.502.70.317.2] [image:3.595.93.502.356.605.2]261
6.1.2 Enron Dataset
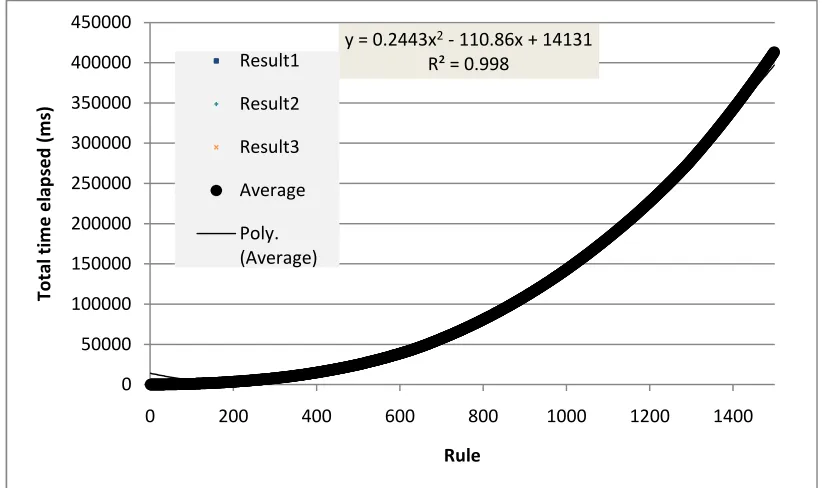
Figure 6-7 A benchmark simulation, with 20% chance of exceptions and no rules based on classifications.
Figure 6-8 A simulation with a 10% chance of exceptions and a 10% chance of rules based on classifications.
y = 0.2443x2- 110.86x + 14131 R² = 0.998
0 50000 100000 150000 200000 250000 300000 350000 400000 450000
0 200 400 600 800 1000 1200 1400
T
o
tal
t
im
e
e
lap
se
d
(
m
s)
Rule
Result1
Result2
Result3
Average
Poly. (Average)
y = 2.2829x2- 786.11x + 62232 R² = 0.997
0 500000 1000000 1500000 2000000 2500000
0 200 400 600 800 1000
T
o
tal
t
im
e
e
lap
se
d
(
m
s)
Rule
Result1
Result2
Result3
Result4
Result5
Average
[image:4.595.92.503.108.352.2] [image:4.595.91.504.394.640.2]262
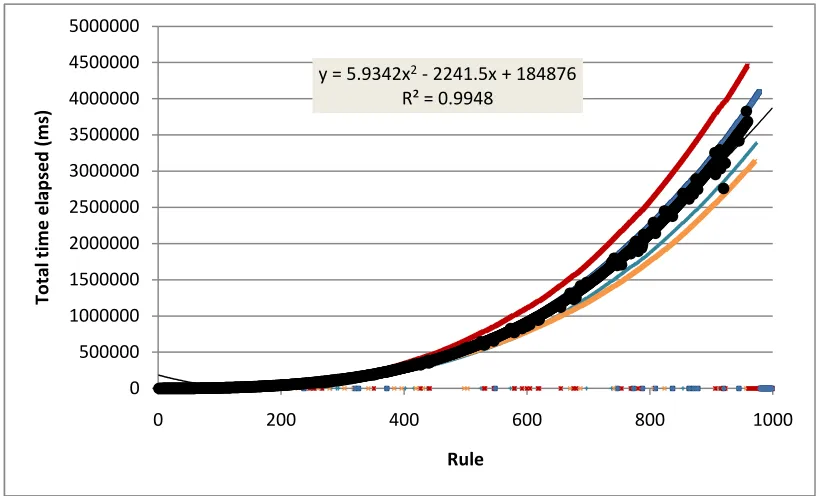
Figure 6-9 A simulation with a 10% chance of exceptions and a 20% chance of rules based on classifications.
Figure 6-10 A simulation with a 10% chance of exceptions and a 40% chance of rules based on classifications.
y = 3.5415x2- 1247.8x + 102072 R² = 0.9966
0 500000 1000000 1500000 2000000 2500000 3000000
0 200 400 600 800 1000
T
o
tal
t
im
e
e
lap
se
d
(
m
s)
Rule
y = 5.9342x2- 2241.5x + 184876 R² = 0.9948
0 500000 1000000 1500000 2000000 2500000 3000000 3500000 4000000 4500000 5000000
0 200 400 600 800 1000
T
o
tal
t
im
e
e
lap
se
d
(
m
s)
[image:5.595.98.502.70.317.2] [image:5.595.93.501.357.605.2]263
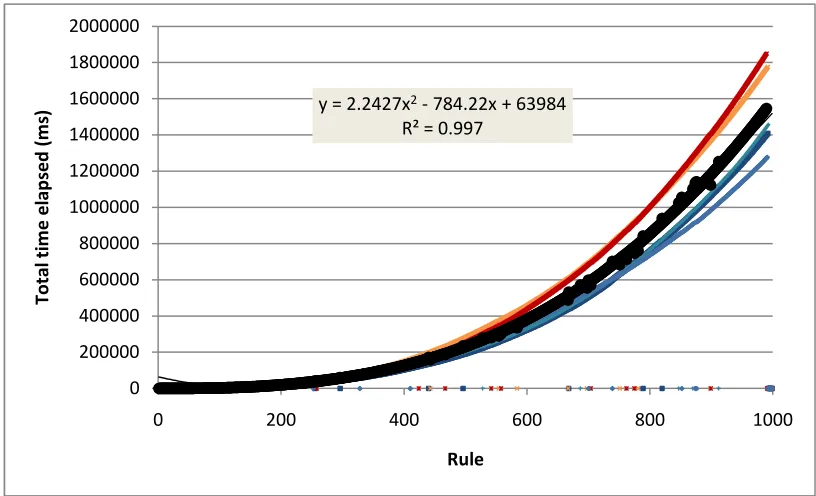
Figure 6-11 A simulation with a 10% chance of exceptions and an 80% chance of rules based on classifications.
Figure 6-12 A simulation with a 20% chance of exceptions and a 10% chance of rules based on classifications.
y = 10.033x2- 3835.6x + 306971 R² = 0.9894
0 1000000 2000000 3000000 4000000 5000000 6000000 7000000 8000000 9000000
0 200 400 600 800 1000
T
o
tal
t
im
e
e
lap
se
d
(
m
s)
Rule
y = 2.2427x2- 784.22x + 63984 R² = 0.997
0 200000 400000 600000 800000 1000000 1200000 1400000 1600000 1800000 2000000
0 200 400 600 800 1000
T
o
tal
t
im
e
e
lap
se
d
(
m
s)
[image:6.595.96.502.69.316.2] [image:6.595.93.501.357.605.2]264
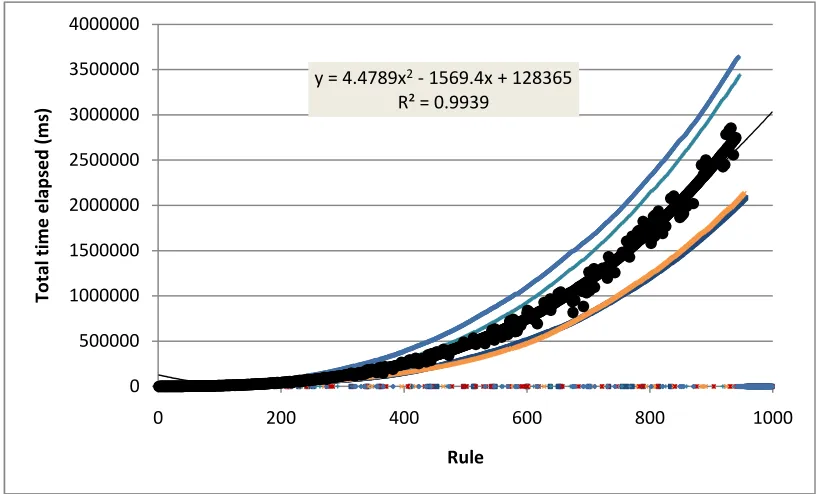
Figure 6-13 A simulation with a 20% chance of exceptions and a 20% chance of rules based on classifications.
Figure 6-14 A simulation with a 20% chance of exceptions and a 40% chance of rules based on classifications.
y = 3.8498x2- 1317x + 105090 R² = 0.9965
0 500000 1000000 1500000 2000000 2500000 3000000 3500000
0 200 400 600 800 1000
T
o
tal
t
im
e
e
lap
se
d
(
m
s)
Rule
y = 4.4789x2- 1569.4x + 128365 R² = 0.9939
0 500000 1000000 1500000 2000000 2500000 3000000 3500000 4000000
0 200 400 600 800 1000
T
o
tal
t
im
e
e
lap
se
d
(
m
s)
[image:7.595.96.501.70.317.2] [image:7.595.93.501.358.605.2]265
Figure 6-15 A simulation with a 20% chance of exceptions and an 80% chance of rules based on classifications.
Figure 6-16 A simulation with a 40% chance of exceptions and a 10% chance of rules based on classifications.
y = 6.4034x2- 2173.1x + 165521 R² = 0.9941
0 500000 1000000 1500000 2000000 2500000 3000000 3500000 4000000 4500000 5000000
0 200 400 600 800 1000
T
o
tal
t
im
e
e
lap
se
d
(
m
s)
Rule
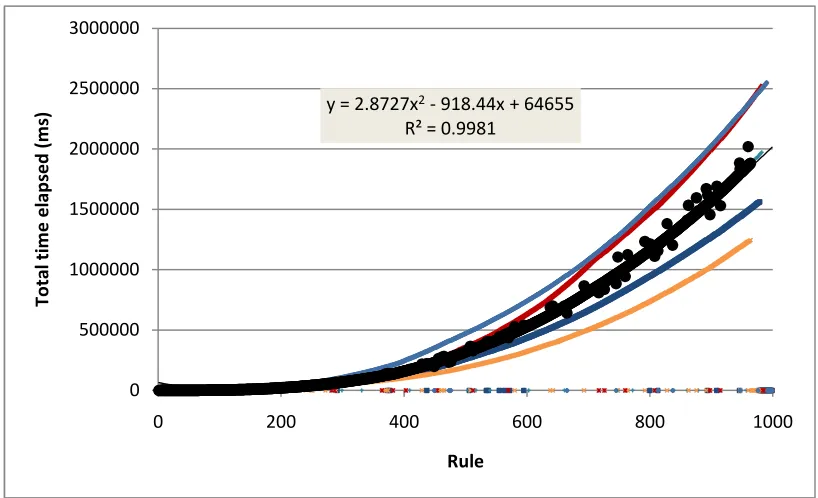
y = 2.8727x2- 918.44x + 64655 R² = 0.9981
0 500000 1000000 1500000 2000000 2500000 3000000
0 200 400 600 800 1000
T
o
tal
t
im
e
e
lap
se
d
(
m
s)
[image:8.595.93.502.356.605.2]266
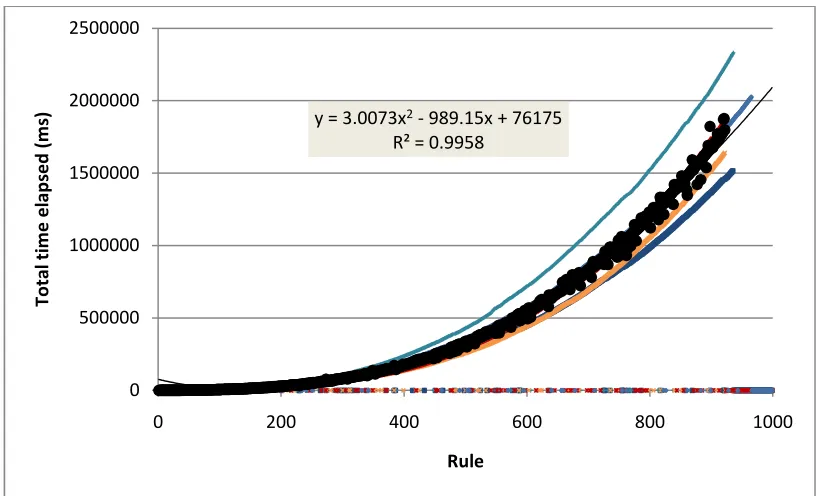
Figure 6-17 A simulation with a 40% chance of exceptions and a 20% chance of rules based on classifications.
Figure 6-18 A simulation with a 40% chance of exceptions and a 40% chance of rules based on classifications.
y = 3.0073x2- 989.15x + 76175 R² = 0.9958
0 500000 1000000 1500000 2000000
0 200 400 600 800 1000
T
o
tal
t
im
e
e
lap
se
d
(
m
s)
Rule
y = 4.3969x2- 1370.2x + 98647 R² = 0.9952
0 500000 1000000 1500000 2000000 2500000 3000000 3500000
0 200 400 600 800 1000
T
o
tal
t
im
e
e
lap
se
d
(
m
s)
[image:9.595.93.501.69.317.2] [image:9.595.92.502.357.605.2]267
Figure 6-19 A simulation with a 40% chance of exceptions and an 80% chance of rules based on classifications.
Figure 6-20 A benchmark simulation with a 20% chance of exceptions and a 50% chance of rules based on classifications.
6.1.3 Inference Performance
Graphs show the time taken to perform 100 inferences on a case at 9 equally spaced periods
during each simulated stress test for the scene dataset. Note that the times are universally
linear and corresponding to the number of rules in the system, although again we see the
variability between runs increases as the number of rules based on classifications increase,
y = 4.496x2- 1209x + 80521 R² = 0.9939
0 500000 1000000 1500000 2000000 2500000 3000000 3500000 4000000
0 200 400 600 800 1000
T
o
tal
t
im
e
e
lap
se
d
(
m
s)
Rule
y = 11.417x2- 6543.6x + 781458 R² = 0.9922
0 2000000 4000000 6000000 8000000 10000000 12000000 14000000 16000000 18000000
0 200 400 600 800 1000 1200 1400
T
o
tal
t
im
e
e
lap
se
d
(
m
s)
Rule
Result1
Result2
Result3
Average
[image:10.595.97.502.70.317.2] [image:10.595.92.502.358.604.2]268
because more or less rules may be rejected due to cycles.
Figure 6-21 The number of rules in the system and the time taken to perform 100 inferences at 9 separate points during the simulated stress test runs for 10% exceptions and 20% classifications.
0 100 200 300 400 500 600 700 800 900 1000
0 2 4 6 8 10
T
im
e
f
o
r
1
0
0
i
n
fe
re
n
ce
s
(m
s)
Run
Rules1
Time1
Rules2
Time2
Rules3
Time3
Rules4
Time4
Rules5
[image:11.595.74.528.120.430.2]269
Figure 6-22 The number of rules in the system and the time taken to perform 100 inferences at 9 separate points during the simulated stress test runs for 10% exceptions and 40% classifications.
Figure 6-23 The number of rules in the system and the time taken to perform 1000 inferences at 9 separate points during the simulated stress test runs for 10% exceptions and 80% classifications.
0 100 200 300 400 500 600 700 800 900 1000
0 2 4 6 8 10
T
im
e
f
o
r
1
0
0
i
n
fe
re
n
ce
s
(m
s)
Run
Rules1
Time1
Rules2
Time2
Rules3
Time3
Rules4
Time4
Rules5
Time5
0 200 400 600 800 1000 1200
0 2 4 6 8 10
T
im
e
f
o
r
1
0
0
i
n
fe
re
n
ce
s
(m
s)
Run
Rules1
Time1
Rules2
Time2
Rules3
Time3
Rules4
Time4
Rules5
[image:12.595.73.527.70.378.2] [image:12.595.74.527.424.728.2]270
Figure 6-24 The number of rules in the system and the time taken to perform 1000 inferences at 9 separate points during the simulated stress test runs for 20% exceptions and 10% classifications.
Figure 6-25 The number of rules in the system and the time taken to perform 1000 inferences at 9 separate points during the simulated stress test runs for 20% exceptions and 20% classifications.
0 100 200 300 400 500 600 700 800 900
0 2 4 6 8 10
T
im
e
f
o
r
1
0
0
i
n
fe
re
n
ce
s
(m
s)
Run
Rules1
Time1
Rules2
Time2
Rules3
Time3
Rules4
Time4
Rules5
Time5
0 100 200 300 400 500 600 700 800 900 1000
0 2 4 6 8 10
T
im
e
f
o
r
1
0
0
i
n
fe
re
n
ce
s
(m
s)
Run
Rules1
Time1
Rules2
Time2
Rules3
Time3
Rules4
Time4
Rules5
[image:13.595.75.528.69.377.2] [image:13.595.74.528.423.730.2]271
Figure 6-26 The number of rules in the system and the time taken to perform 1000 inferences at 9 separate points during the simulated stress test runs for 20% exceptions and 40% classifications.
Figure 6-27 The number of rules in the system and the time taken to perform 1000 inferences at 9 separate points during the simulated stress test runs for 20% exceptions and 80% classifications.
0 100 200 300 400 500 600 700 800 900
0 2 4 6 8 10
T
im
e
f
o
r
1
0
0
i
n
fe
re
n
ce
s
(m
s)
Run
Rules1
Time1
Rules2
Time2
Rules3
Time3
Rules4
Time4
Rules5
Time5
0 200 400 600 800 1000 1200
0 2 4 6 8 10
T
im
e
f
o
r
1
0
0
i
n
fe
re
n
ce
s
(m
s)
Run
Rules1
Time1
Rules2
Time2
Rules3
Time3
Rules4
Time4
Rules5
[image:14.595.76.527.70.376.2] [image:14.595.74.525.424.728.2]272
Figure 6-28 The number of rules in the system and the time taken to perform 1000 inferences at 9 separate points during the simulated stress test runs for 40% exceptions and 10% classifications.
Figure 6-29 The number of rules in the system and the time taken to perform 1000 inferences at 9 separate points during the simulated stress test runs for 40% exceptions and 20% classifications.
0 100 200 300 400 500 600 700 800 900
0 2 4 6 8 10
T
im
e
f
o
r
1
0
0
i
n
fe
re
n
ce
s
(m
s)
Run
Rules1
Time1
Rules2
Time2
Rules3
Time3
Rules4
Time4
Rules5
Time5
0 100 200 300 400 500 600 700 800 900
0 2 4 6 8 10
T
im
e
f
o
r
1
0
0
i
n
fe
re
n
ce
s
(m
s)
Run
Rules1
Time1
Rules2
Time2
Rules3
Time3
Rules4
Time4
Rules5
[image:15.595.77.526.70.375.2] [image:15.595.73.527.420.730.2]273
Figure 6-30 The number of rules in the system and the time taken to perform 1000 inferences at 9 separate points during the simulated stress test runs for 40% exceptions and 40% classifications.
Figure 6-31 The number of rules in the system and the time taken to perform 1000 inferences at 9 separate points during the simulated stress test runs for 40% exceptions and 80% classifications.
0 100 200 300 400 500 600 700 800 900 1000
0 2 4 6 8 10
T
im
e
f
o
r
1
0
0
i
n
fe
re
n
ce
s
(m
s)
Run
Rules1
Time1
Rules2
Time2
Rules3
Time3
Rules4
Time4
Rules5
Time5
0 100 200 300 400 500 600 700 800 900
0 2 4 6 8 10
T
im
e
f
o
r
1
0
0
i
n
fe
re
n
ce
s
(m
s)
Run
Rules1
Time1
Rules2
Time2
Rules3
Time3
Rules4
Time4
Rules5
[image:16.595.77.526.70.375.2] [image:16.595.76.525.419.730.2]