NEURAL NETWORK (CNN) FOR EEG EMOTION
CLASSIFICATION
YONG CHUN KEONG
CLASSIFICATION
YONG CHUN KEONG
This report is submitted in partial fulfilment of the requirements
for the degree of Bachelor of Electronic Engineering with Honours
Faculty of Electronic and Computer Engineering
Universiti Teknikal Malaysia Melaka
DEDICATION
ABSTRACT
Emotion classification through facial expression or speech intonation is not reliable
as human can hide their emotion when expressing their feelings. Therefore, a deep
learning technique, Convolutional Neural Network (CNN) is implemented and
optimized in this project to analyze human emotion in a more reliable manner.
Experimental paradigm is designed by using audio-visual stimuli selected from IAPS
and IADS-2 database to acquire EEG data with different emotions. The proposed CNN
algorithm is trained on the collected EEG data and then validated by using an open
source dataset (SEED). The proposed CNN algorithm achieves the best accuracy of
65% (2 classes of emotion) and 82% (3 classes of emotion) form EEG data collected
ABSTRAK
Klasifikasi emosi melalui ungkapan wajah atau ucapan intonasi tidak boleh
dipercayai kerana manusia boleh menyembunyikan emosi mereka ketika menyatakan
perasaan mereka. Oleh itu, satu teknik “deep learning”, iaitu Convolutional Neural
Network (CNN) telah diguna dan diubahsuai dalam projek ini untuk menganalisis
emosi manusia dengan cara yang lebih boleh dipercayai. Eksperimen dirancangkan
dengan menggunakan rangsangan “audio-visual” yang dipilih dari pangkalan data
IAPS dan IADS-2 untuk memperolehi isyarat EEG dengan emosi yang berbeza.
Algoritma CNN yang dicadangkan telah dilatih dengan data EEG yang dikumpul
dalam makmal dan kemudian disahkan dengan menggunakan dataset sumber terbuka
(SEED). Algoritma CNN yang dicadangkan mencapai ketepatan terbaik dengan 65%
(2 kelas emosi) dan 82% (3 kelas emosi) daripada data EEG yang dikumpulkan dalam
ACKNOWLEDGEMENTS
First and foremost, I would like to express my deepest appreciation to my
supervisor, Dr. Lim Kim Chuan for giving me advises and valuable guidance in the
completion of this final year project. I am so grateful to Dr. Low Yin Fen, who has
selflessly sharing her knowledge in EEG signal processing. Next, I would like to give
a special thanks to Tong Siau Khee for sharing her precious experience and giving me
comments in my work.
I also would like to express my sincere appreciation to my colleagues, Mohamed,
Siaw Hong and Kien Leong for lending a helping hand to assist me whenever I faced
a problem. I am also deeply thankful to all the participants for taking part in my EEG
data acquisition. Without their involvement, I am not able to complete this final year
TABLE OF CONTENTS
Declaration i
Approval i
Dedication i
Abstract i
Abstrak ii
Acknowledgements iii
Table of Contents iv
List of Figures viii
List of Tables xii
List of Abbreviations xiii
CHAPTER 1 INTRODUCTION 1
1.1 Project Overview 1
1.2 Objectives 4
1.3 Problem Statement 4
1.4 Scope of Work 5
CHAPTER 2 BACKGROUND STUDY 7
2.1 Definition of Emotion 7
2.1.1 Emotion Models 9
2.2 Electroencephalogram (EEG) 11
2.2.1 History of Electroencephalogram (EEG) 12
2.2.2 International 10/20 System 13
2.2.3 Event Related Potentials (ERP) 14
2.3 Neural Network 17
2.4 Convolutional Neural Network (CNN) 18
2.4.1 Convolution 19
2.4.2 Non-Linearity 19
2.4.3 Pooling / Subsampling 20
2.4.4 Dropout 21
2.4.5 Classification 22
2.5 Comparison between Neural Network and CNN 22
2.6 Related Works 23
CHAPTER 3 METHODOLOGY 28
3.1 Research Methodology 28
3.2 Experimental Design 30
3.2.1.1 International Affective Picture System (IAPS) 30
3.2.1.2 International Affective Digitalized Sounds (2nd Edition
(IADS-2) 31
3.2.2 Stimuli Design 31
3.2.3 Experimental Paradigm 32
3.2.4 Participants 33
3.2.5 Experimental Context 34
3.2.6 EEG Data Acquisition 37
3.2.7 Preprocessing of Raw EEG Signal 37
3.2.8 Segmentation and Labelling 38
3.3 STJU Emotion EEG Dataset (SEED) 39
3.3.1 Data Arrangement and Labelling for SEED Dataset 40
3.4 Proposed CNN Algorithm 42
CHAPTER 4 RESULTS AND DISCUSSION 45
4.1 Dataset Used in the Project 45
4.2 Proposed CNN with EEG Data Collected in The Lab (2 emotion classes) 46
4.2.1 Comparison between the Performance with Different Parameter Setting 50
4.2.2 Comparison between Confusion Matrix 51
4.2.3 Significant Test for Different Parameter Setting 53
4.3.1 Comparison between the Performance of Different Parameter Setting 57
4.3.2 Comparison between Confusion Matrix (SEED) 58
4.3.3 Significant test for different parameter setting 61
CHAPTER 5 CONCLUSION AND FUTURE WORKS 62
5.1 Conclusion 62
5.2 Future Work 64
REFERENCES 65
APPENDIX A 70
APPENDIX B 71
APPENDIX C 72
APPENDIX D 73
APPENDIX E 74
APPENDIX F 77
APPENDIX G 80
APPENDIX H 83
APPENDIX I 88
LIST OF FIGURES
Figure 1.1: The model of Sophia [2] 2
Figure 1.2: Emotion detection through external clues [4] 3
Figure 1.3: Emotion detection through EEG signal 3
Figure 2.1: Schachter-Singer Theory [7] 8
Figure 2.2: Lazarus Theory [7] 8
Figure 2.3: Discrete emotions claimed by Paul Ekman [10] 10
Figure 2.4: Bi-dimensional model of emotion [13] 10
Figure 2.5: Early recordings of human EEG from Berger’s notebook [16] 13
Figure 2.6: The International 10/20 system electrode position [18] 14
Figure 2.7: The components of an ERP waveform [20] 15
Figure 2.8: The basic structure of a neural network [25] 18
Figure 2.9: Example of a CNN architecture [27] 18
Figure 2.10: Illustration of convolution [28] 19
Figure 2.11: Commonly used activation functions [30] 20
Figure 2.12: Maximum pooling (a) and average pooling (b) [31] 21
Figure 2.13: Illustration of dropout [32] 22
Figure 3.2: Selected pictures from IAPS database 32
Figure 3.3: Selected audio clips from IADS database 32
Figure 3.4: Experimental paradigm 33
Figure 3.5: Electrodes position for the experiment 35
Figure 3.6: Instrumental set-up for the experiment 36
Figure 3.7: Visualization of generated TTL pulse in PC1 36
Figure 3.8: Illustration of EEG signal acquisition 37
Figure 3.9: Segmentation and labelling for EEG data collected in the lab 39
Figure 3.10: Experimental paradigm for SEED dataset [38] 40
Figure 3.11: Segmentation and labeling for SEED dataset 41
Figure 3.12: Selected channels in SEED dataset 42
Figure 3.13: Proposed CNN architecture 43
Figure 4.1: Accuracy curve for subject 8 with parameter setting 1 48
Figure 4.2: Accuracy curve for subject 8 with parameter setting 2 49
Figure 4.3: Accuracy curve for subject 8 with parameter setting 3 49
Figure 4.4: comparison between the performance of the CNN with different
parameters setting (EEG data collected in the lab) 51
Figure 4.5: Confusion matrix for 8 subjects 52
Figure 4.6: Combined confusion matrix for 8 subjects 52
Figure 4.7: Accuracy curve for subject 11 with parameter setting 1 56
Figure 4.8: Accuracy curve for subject 11 with parameter setting 2 56
Figure 4.9: Accuracy curve for subject 11 with parameter setting 3 57
Figure 4.10: Comparison between the performance of the CNN with different
Figure 4.11: Confusion matrix for 15 subjects (SEED) 60
Figure 4.12: Combined confusion matrix for 15 subjects 60
Figure I.1: Accuracy curves for subject 1 with different parameter setting: setting 1
(a), setting 2 (b) and setting 3 (c) 89
Figure I.2: Accuracy curves for subject 2 with different parameter setting: setting 1
(a), setting 2 (b) and setting 3 (c) 91
Figure I.3: Accuracy curves for subject 3 with different parameter setting: setting 1
(a), setting 2 (b) and setting 3 (c) 92
Figure I.4: Accuracy curves for subject 4 with different parameter setting: setting 1
(a), setting 2 (b) and setting 3 (c) 94
Figure I.5: Accuracy curves for subject 5 with different parameter setting: setting 1
(a), setting 2 (b) and setting 3 (c) 95
Figure I.6: Accuracy curves for subject 6 with different parameter setting: setting 1
(a), setting 2 (b) and setting 3 (c) 97
Figure I.7: Accuracy curves for subject 7 with different parameter setting: setting 1
(a), setting 2 (b) and setting 3 (c) 98
Figure I.8: Accuracy curves for subject 8 with different parameter setting: setting 1
(a), setting 2 (b) and setting 3 (c) 100
Figure J.1: Accuracy curves for subject 1 with different parameter setting: setting 1
(a), setting 2 (b) and setting 3 (c) 102
Figure J.2: Accuracy curves for subject 2 with different parameter setting: setting 1
(a), setting 2 (b) and setting 3 (c) 104
Figure J.3: Accuracy curves for subject 3 with different parameter setting: setting 1
(a), setting 2 (b) and setting 3 (c) 105
Figure J.4: Accuracy curves for subject 4 with different parameter setting: setting 1
(a), setting 2 (b) and setting 3 (c) 107
Figure J.5: Accuracy curves for subject 5 with different parameter setting: setting 1
(a), setting 2 (b) and setting 3 (c) 109
Figure J.6: Accuracy curves for subject 6 with different parameter setting: setting 1
Figure J.7: Accuracy curves for subject 7 with different parameter setting: setting 1
(a), setting 2 (b) and setting 3 (c) 112
Figure J.8: Accuracy curves for subject 8 with different parameter setting: setting 1
(a), setting 2 (b) and setting 3 (c) 113
Figure J.9: Accuracy curves for subject 9 with different parameter setting: setting 1
(a), setting 2 (b) and setting 3 (c) 115
Figure J.10: Accuracy curves for subject 10 with different parameter setting: setting 1
(a), setting 2 (b) and setting 3 (c) 116
Figure J.11: Accuracy curves for subject 11 with different parameter setting: setting 1
(a), setting 2 (b) and setting 3 (c) 118
Figure J.12: Accuracy curves for subject 12 with different parameter setting: setting 1
(a), setting 2 (b) and setting 3 (c) 119
Figure J.13: Accuracy curves for subject 13 with different parameter setting: setting 1
(a), setting 2 (b) and setting 3 (c) 121
Figure J.14: Accuracy curves for subject 14 with different parameter setting: setting 1
(a), setting 2 (b) and setting 3 (c) 122
Figure J.15: Accuracy curves for subject 15 with different parameter setting: setting 1
LIST OF TABLES
Table 1.1: Properties of EEG data in study [5] 4
Table 1.2: The properties of dataset used in the project 5
Table 2.1: Comparison between discrete model and dimensional model 11
Table 2.2: The characteristics of brain wave frequencies [15] 12
Table 2.3: Label of different letters based on International 10/20 system [18] 14
Table 2.4: Properties of ERP components 16
Table 2.5: Related works for EEG emotion classification through conventional
approach 25
Table 2.6: Related works for EEG emotion classification using deep learning network 27
Table 3.1: Properties of the experiment 35
Table 3.2: Label for EEG signal collected in the lab 39
Table 3.3: Label for SEED dataset 42
Table 4.1: Properties of datasets used in the project 46
Table 4.2: Comparison of the results with different setting of parameters 48
Table 4.3: Confirmation of parameter setting with significant test (EEG data collected
in the lab) 53
Table 4.4: Comparison of the results with different setting of parameters for SEED
dataset 55
LIST OF ABBREVIATIONS
BCI : Brain Computer Interface
CNN : Convolutional Neural Network
DBN : Deep Belief Network
EEG : Electroencephalograms
ERP : Event Related Potential
IADS-2 : International Affective Digitalized Sounds
IAPS : International Affective Picture System
ISI : Inter-Stimulus Interval
KNN : K-Nearest Neighbors
LDA : Linear Discriminant Analysis
LR : Logistic Regression
NB : Naive Bayes
PNN : Probabilistic Neural Networks
SEED : SJTU Emotion EEG Dataset
SVM : Support Vector Machine
TMSi : Twente Medical Systems International Porti System
TTL : Transistor-transistor logic pulse
CHAPTER 1
INTRODUCTION
This chapter consists of five sections. The overview of the project is firstly
presented in this chapter. The objectives of this study are stated in section 1.2. Section
1.3 is the problem statement regarding to the study. Section 1.4 discusses the scope of
work. The thesis outline is presented in the final section of this chapter.
1.1 Project Overview
Emotions can be defined as sensory projection to stimuli which involves thoughts,
physiological changes and expression of feelings [1]. In recent years, emotion
recognition system playing an increasingly important role in enhancing the experience
of human-machine interaction. For instance, the importance of emotion recognition in
human-machine interaction has clearly shown by a human-like robot named Sophia.
process emotional data during conversation with human [2]. The model of Sophia is
[image:21.595.218.437.127.273.2]shown in Figure 1.1.
Figure 1.1: The model of Sophia [2]
Various research has been carried out to study human emotions. Generally,
human emotion can be classified through the external appearance clues and the “inner”
emotion reflected by brain activities. Emotion detection through external clues such
as text, speech intonation and facial expression are commonly used to classify emotion
as it is a direct reflection of emotion which is able to be easily detected. On the other
hand, emotion classification through the “inner” emotion reflected in
electroencephalograms (EEG) signal with the aid of deep learning technique becoming
popular in recent years as EEG decoding plays an important role in most brain
computer interface (BCI) for clinical applications. The researches revealed that the
characteristic of EEG signals with high temporal resolution allow it to react to
emotional stimuli in millisecond. This indicate that emotion classification using EEG
signal is a more reliable approach as compared to the external appearance clues that
can be hidden and faked in expression [3].
In light of this, a deep learning technique, convolutional neural network (CNN)
emotional states. This project begins with experimental design for EEG signal
acquisition. The raw EEG signals will be preprocessed and rearranged before fed into
[image:22.595.207.449.178.344.2]the proposed CNN architecture to be classified into different emotional states.
Figure 1.2: Emotion detection through external clues [4]
[image:22.595.193.453.393.606.2]1.2 Objectives
There are three objectives in this project which listed as below:
i. To design and develop an experiment to acquire EEG signal with different
emotions.
ii. To analyze and optimize the parameters of CNN architecture for EEG
emotion classification.
iii. To validate the CNN architecture for EEG emotion classification in terms
of classification accuracy.
1.3 Problem Statement
Emotions detection through text, speech tone and facial expression are not
reliable enough as human can fake their expression of feelings. To cope with this
situation, an EEG-based emotion classification system has been designed to classify
human emotion by using EEG signal. Nevertheless, the EEG-based emotion
classification system in study [5] only yield about 59% accuracy with the EEG data
collected in the lab. Therefore, this project is aims to develop and optimize the
parameters of the CNN model in order to improve the performance for EEG emotion
classification. Different modality of stimuli will be designed to induce emotion for
[image:23.595.188.458.637.726.2]EEG data acquisition.
Table 1.1: Properties of EEG data in study [5]
Stimuli Picture (IAPS)
No. emotional category 2
1.4 Scope of Work
This project is intended to implement a CNN algorithm that able to classify
different emotions by using EEG signal as input. Experimental paradigm is designed
to induce two classes of emotion (positive and negative) for EEG signal acquisition
purpose. MATLAB script is written for preprocessing of the acquired raw EEG signal.
The implementation of CNN algorithm is done in python (v2.7.12) with TensorFlow
(V1.0.0) as framework.
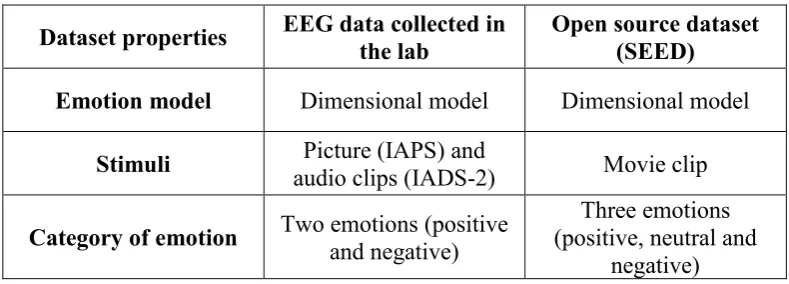
The CNN algorithm is trained with both EEG data collected in the lab as well
as an open source dataset (SEED). The categorization of emotion for both EEG data
collected in the lab and SEED are based on dimensional model of emotion. There are
two classes of emotion included in the EEG data collected in the lab, which is positive
and negative emotions. On the other hand, a total of three classes of emotions, which
is positive, neutral, and negative emotions are included in SEED dataset. The
[image:24.595.124.519.512.654.2]properties of datasets used in the project are summarized in Table 1.2.
Table 1.2: The properties of dataset used in the project
Dataset properties EEG data collected in the lab Open source dataset (SEED)
Emotion model Dimensional model Dimensional model
Stimuli audio clips (IADS-2) Picture (IAPS) and Movie clip
![Figure 1.1: The model of Sophia [2]](https://thumb-us.123doks.com/thumbv2/123dok_us/130361.12545/21.595.218.437.127.273/figure-the-model-of-sophia.webp)
![Figure 1.2: Emotion detection through external clues [4]](https://thumb-us.123doks.com/thumbv2/123dok_us/130361.12545/22.595.193.453.393.606/figure-emotion-detection-external-clues.webp)
![Table 1.1: Properties of EEG data in study [5]](https://thumb-us.123doks.com/thumbv2/123dok_us/130361.12545/23.595.188.458.637.726/table-properties-eeg-data-study.webp)