1
2
Comparison and Distribution of Copper Oxide Nanoparticles and Copper Ions in 3
Activated Sludge Reactors. 4
5
DONGQING ZHANG1, ANTOINE P. TRZCINSKI2*, HYUN-SUK OH3, EVELYN CHEW1, 6
SOON KEAT TAN1, WUN JERN NG1, YU LIU1.
7
8
1Advanced Environmental Biotechnology Centre, Nanyang Environment and Water Research 9
Institute, 1 Cleantech loop, #06-10, Singapore 637141. 10
11
2School of Civil Engineering & Surveying, Faculty of Health, Engineering and Sciences, 12
University of Southern Queensland, 4350 Australia. 13
14
3Singapore Membrane Technology Centre, Nanyang Environment and Water Research Institute, 15
1 Cleantech loop, #06-10, Singapore 637141. 16
17
18
19
20
21
*Address correspondence to Dr Antoine TRZCINSKI, School of Civil Engineering & Surveying, 22
Faculty of Health, Engineering and Sciences, University of Southern Queensland, 4350 Australia, 23
Telephone number: +61 7 4631 1617; 24
Abstract 26
27
Copper oxide nanoparticles (CuO NPs) are increasingly applied in the industry which results 28
inevitably in their release of these materials into the hydrosphere. In this study, simulated waste 29
activated sludge experiments were conducted to investigate the effects of Copper Oxide NPs at 30
concentrations of 0.1, 1, 10 and 50 mg/L and compare it with its ionic counterpart (as CuSO4). It
31
was found that 0.1 mg/L CuO NPs had negligible effects on Chemical Oxygen Demand (COD) 32
and ammonia removal. However, the presence of 1, 10 and 50 mg/L CuO NPs decreased COD 33
removal from 78.7% to 77%, 52.1% and 39.2%, respectively (p<0.05). The corresponding 34
effluent ammonium (NH4-N) concentration increased from 14.9 mg/L to 18, 25.1 and 30.8 mg/L,
35
respectively. Under equal Cu concentration, copper ions were more toxic towards 36
microorganisms compared to CuO NPs. CuO NPs were removed effectively (72-93.2%) from 37
wastewater due to a greater biosorption capacity onto activated sludge, compared to the copper 38
ions (55.1%-83.4%). The SEM images clearly showed the accumulation and adsorption of CuO 39
NPs onto activated sludge. The decrease in Live/dead ratio after 5 h exposure of CuO NPs and 40
Cu2+ indicated the loss of cell viability in sludge flocs. 41
42
Keywords: CuO nanoparticles; copper ions; waste activated sludge; biosorption 43
44
Introduction 45
46
Nanotechnology has become very popular over the last few decades due to significant advances 47
with applications in medicine and semiconductor, chemical and electronics industries.[1-3] As one 48
of the most important engineered applications, copper oxide nanoparticles (CuO NPs) exhibit 49
ceramics, chemical sensors, polymers inks, metallic and coating. [4-6] Particularly, CuO NPs are 51
commonly generated in large amounts during wafer chemomechanical polishing operations, 52
which is a major source of wastewater in semiconductor manufacturing. [7] The increasing use of 53
CuO NPs in industry and consumer products raises the concerns about the environmental risks 54
due to their novel physical and chemical properties. Therefore, it is imperative to understand the 55
environmental impact of CuO NPs. 56
Results from material flow analyses suggest that a major fraction of the NPs in commercial 57
products will eventually enter municipal or industrial wastewaters, and subsequently reach 58
wastewater treatment plants (WWTPs). [8, 9] WWTPs are considered as the last barriers prior to 59
their environmental release. [10] Therefore, efficient removal of engineered NPs from wastewater 60
is particularly important in view of their increasing evidence for their ecotoxicity. [11] 61
Furthermore, their toxicity to some microorganisms within the biological systems of WWTPs is 62
of particular concern, since the inhibition and loss of certain bacterial species involved could be 63
detrimental to biological treatment performance. [12] Previous study by Otero-González et al. [13] 64
indicated that the extended exposure to even relatively low concentration (1.4 mg/L) of CuO NPs 65
had a markedly negative effect on the performance of methanogenesis in upflow anaerobic 66
sludge blanket (UASB) reactor. In another recently study, 50% inhibition of CH4 production was
67
also observed during anaerobic digestion processes in the presence of 11 mg Cu L-1 of CuO NPs 68
over a 14-d period. [14] 69
In addition, the fate, transport, and toxicity of NPs in wastewater treatment processes may differ 70
largely from those of their ionic counterparts, due to the differences in the properties (size, 71
charge density), chemical composition of media (pH, organics, ionic strength), test conditions, 72
and organisms evaluated. [10] CuO NPs and Cu2+ ions were reported to show different toxicity to 73
some microbes. [15, 16] In a recent study of the toxic effects of CuO NPs, bulk CuO and CuSO4 on
74
CuSO4, which was approximately 120 times more toxic than CuO NPs and 1500 times more
76
toxic than bulk CuO. The different toxicity of Cu compounds has also been reported in a study of 77
Heinlaan et al. [16] where the EC50 values for bulk CuO, CuO NPs and CuSO4 were 3811, 79, 1.6
78
mg/L (Vibrio fischer); 165, 3.2, 0.17 mg/L (Daphnia magna); and 95, 2.1, 0.11 mg/L 79
(Thamncephalus platyurus), respectively. However, Aruoja et al. [17] investigated the toxicities 80
of ZnO, TiO2 and CuO NPs to mircoalgae Pseudokirchneriella subcapitata and reported that the
81
bioavailable EC50 values of CuO NPs were not significantly different from the EC50 of CuSO4
82
(0.02 mg Cu/L). 83
There is a lack of information on the behaviour of CuO NPs in WWTPs and the effects of CuO 84
NPs on the treatment performance in terms of organic removal and nitrification. [12, 13] In 85
particular, a detailed evaluation of the extent to which CuO NPs were removed, characteristics of 86
CuO NPs in suspension and/or sludge, and a comparison of the above with ionic salts, is 87
currently not available. [10] Most authors have investigated specific microorganisms or activated 88
sludge fed with synthetic wastewater. Studies with real wastewater are still scarce, but important 89
because interactions with natural organic matter in real wastewater may result in different 90
behaviour of CuO NPs. For instance, Cu ions can generate complex with humic acids due to their 91
carboxylic and phenolic groups or precipitate as insoluble copper hydroxide. 92
Therefore, the objectives of this study were (a) to compare the short term effects and fate of CuO 93
NPs and Cu2+ in a laboratory scale waste activated sludge process fed with real wastewater; (b) 94
to investigate the effects of 0.1, 1, 10 and 50 mg/L CuO NPs on COD and nitrogen removals; (c) 95
to determine the accumulation of Cu ions in the effluent and onto activated sludge over short 96
term experiments; (d) to determine the morphology of activated sludge using Scanning electron 97
microscopy (SEM); (e) to assess the impacts of the presence of CuO NPs and Cu2+ ions on 98
previously in particular under short term experiments (5 hours) at concentrations as high at 50 100
mg/L. 101
102
Materials and methods 103
104
Activated sludge and wastewater
105
106
Primary wastewater was collected from Ulu Pandan Water Reclamation Plant (WRP), Singapore. 107
The total treatment capacity of Ulu Pandan WRP is 361,000 m3 per day. The treatment process
108
includes typical preliminary, primary and secondary treatment processes. The wastewater was 109
collected from the effluent of the primary sedimentation tank. As Ulu Pandan WPR treats 110
combined industrial and domestic wastewater, the contaminant concentrations are expected to be 111
higher than those in common domestic WWTPs. Real wastewater was stored at 4°C until it was 112
fed to the SBRs. 113
114
CuO NPs characterization
115
116
The CuO NPs were purchased from Sigma-Aldrich (Singapore) with average particles size of 117
40±5 nm. CuO NPs stock solutions (100 mg/L) were prepared by adding dry particles into Milli-118
Q (pH=6.8±0.2), and then the suspensions were sonicated (30°C, 100 W, 40 kHz) for 30 min and 119
shaken for 2 h to increase their dispersion. Zeta potential of CuO NPs in the suspensions were 120
measured using a Nanosizer (Malvern Instruments Ltd., UK). The morphology of the CuO NPs 121
was examined using transmission electron microscopy (TEM) (JEOL JEM-3010, Japan). To 122
avoid agglomeration or aggregation, water bath ultrasonic treatment was carried out to increase 123
125
Sequencing batch reactors (SBR)
126
127
SBRs were designed to simulate a full-scale operation of aeration and secondary clarification as 128
described by Hou et al. [18] The SBRs (0.5 L) were seeded with return nitrifying activated sludge 129
from Changi Water Reclamation Plant (Singapore) adjusted to a mixed liquor suspended solids 130
(MLSS) concentration of 3 g/L. The hydraulic retention time (HRT) was 12 hours, while the 131
sludge retention time (SRT) was 15 days. The steady state was established through monitoring 132
the chemical oxygen demand (COD) and ammonium. The SBRs were operated under anoxic-133
aerobic conditions and each cycle had a duration of 8 h, including 1 h feeding, 1 h of anoxic 134
period, 3 hours of aeration, settling for 2 h and effluent withdrawal for 1 h. After each cycle, 135
supernatants following settling were replaced with primary clarifier effluent from Ulu Pandan 136
Water Reclamation Plant to start the next cycle. The general parameters, such as pH, dissolved 137
oxygen, and temperature were monitored and automatically recorded using a data logger. Both 138
SBRs were run at a temperature of 24-26°C. 139
After 15 days of stabilisation period, four SBRs were spiked with CuO NPs at the concentrations 140
of 0.1, 1, 10, and 50 mg CuO/L, respectively and three SBRs were spiked with corresponding 141
ionic salt (in the form of CuSO4) at concentration of 0.2, 2.0, 20, and 100 mg/L CuSO4/L such
142
that both sets of SBR contained exactly 0.08, 0.8, 8.0 and 40.0 mg Cu2+/L, respectively. One 143
SBR was employed as control with no Copper addition. Each condition was operated for one 144
month and steady state data were collected over three cycles to determine average and standard 145
deviation. 146
147
Analytical methods
148
Sampling commenced after 15 days of operation of reactor, in order to ensure stable operation. 150
Aliquots of completely mixed liquor suspensions were collected every 0.5 h over a period of 5 h. 151
Collected samples were first centrifuged for 20 min at 10,000 rpm (Eppendorf 5810R). The 152
measurement of MLSS, mixed liquor volatile suspended solids (MLVSS), chemical oxygen 153
demand (COD), ammonium (NH4+-N), and phosphate (PO43-) was in accordance with the
154
Standard Methods. [19] All chemical tests were done in triplicate. 155
The Cu levels in both liquid sample and biosolids were determined as described by microwave 156
plasma – Atomic Emission Spectroscopy (MP-AES). [13] Briefly, 10 mL collected samples were 157
first centrifuged for 10 min at 10,000 rpm prior to metal analysis (Eppendorf 5810R). Then the 158
supernatant (2 mL) were collected and mixed with 2 mL of HNO3 (69%, Sigma-Aldrich) and
159
shaken overnight at 30±2°C to ensure complete Cu dissolution. Thereafter, Cu concentrations in 160
liquid samples were determined by MP-AES (4100, Agilent Technologies) in triplicate. Cu level 161
in biosolids was measured after digestion in an Anton Paar Microwave Reaction System 162
(Multiwave 3000, Alpha Analytical USA) following EPA method 3051A. [13] All chemical tests 163
were done at least in duplicates. 164
165
Bacterial viability assay
166
167
The impact on bacteria integrity in the presence of CuO NPs and copper salt were assessed using 168
a LIVE/DEAD Baclight bacterial viability kit (Molecular Probes, USA). Viable and dead cells 169
were detected by a green fluorescent nucleic acid stain, SYTO 9, which generally labels all 170
bacteria (live and dead) with a green fluorescence, and a red fluorochrome, propidium iodide (PI), 171
which stains only bacteria with damaged membranes due to its membrane impermeability. At the 172
end of the experiment, 1 mL of the sludge suspension was stained with 1.5 μL of SYTO9 and 1.5 173
cover slip and visualized using Nikon A1R confocal laser scanning microscope (CLSM) system 175
attached to an upright ECLIPSE 90i machine with a 40× objective lens (Nikon, Tokyo, Japan). 176
All images were acquired at a scale of 79.55 μm × 79.55 μm with 5.11 μm of confocal slice. The 177
images were further analysed by Imaris software (Bitplane AG, Zurich, Switzerland) to calculate 178
live/dead ratio. 179
180
Scanning electron microscopy (SEM) and transmission electron microscope (TEM) imaging
181
182
Samples were investigated using TEM and SEM. In the first case TEM grids were prepared by 183
placing a drop of suspension (mixed liquor or supernatant) on a holey carbon grid and drawing 184
the suspension through the TEM grid using a paper tissue. The TEM grids were washed 185
afterwards in a drop of distilled water to remove the dissolved compounds. [20] The TEM was
186
operated at 200 kV to detect and characterize aggregation state of NPs in the solution. 187
To prepare SEM image, mixed liquor was first washed 3 times with 0.1 M phosphate buffer 188
solution (PBS) (pH 7.7) and fixed in 0.1 M phosphate buffer (7.4) containing 2.5% 189
glutaraldehyde at 4 °C for 4 h. The dried samples were coated with platinum before SEM 190
analysis according to Zheng et al. (2011). The elemental analysis of the particles was carried out 191
using an energy-dispersive X-ray spectroscope (EDS). 192
193
Statistical analysis
194
195
The results are presented as average± standard deviation for each concentration. Tests to 196
determine statistical differences between treatments were carried out by comparing the critical 197
value through ANOVA one-way analysis of variance (SPSS Statistics V17.0). Comparisons were 198
200
Results and discussion 201
202
Characterization of CuO NPs
203
204
Figure 1 shows the TEM image of CuO NPs in deionized water under different magnifications 205
(0.5 µm, 100 nm and 50 nm). In the present study, due to their small size and huge surface area, 206
NPs tend to aggregate or agglomerate in aqueous phase. Although the CuO NPs used in this 207
study have a diameter size within the nanometer range, some aggregates of different sizes were 208
formed in the solution where the particles were suspended, even after sonication. The zeta 209
potential was -41.7 mV at pH= 6.8 and -35.6 mV at pH=6.4 at the beginning and end of the 210
experiment, respectively. 211
212
Removal of CuO NPs and copper ions
213
214
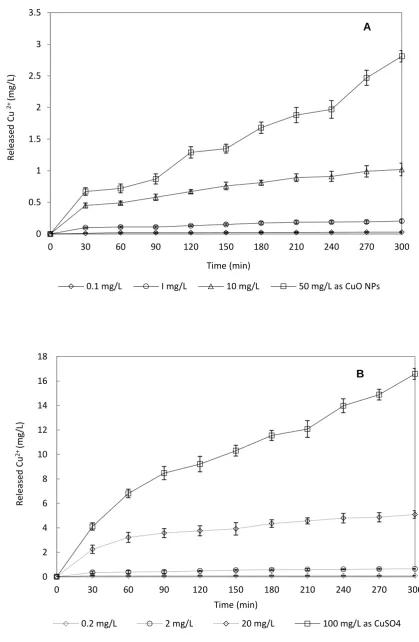
The Cu levels in the biomass-free effluent spiked with CuO NPs and copper salt is shown in 215
Figure 2A. After 5 h exposure, the concentrations of released soluble Cu2+ were 0.028, 0.204,
216
1.02 and 2.81 mg/L at the initial CuO NP concentration of 0.1, 1.0, 10 and 50 mg/L, respectively. 217
This finding indicates that the majority of the Cu in the influent was adsorbed onto settled 218
biomass. At the CuO NP concentrations of 0.1 and 1.0 mg/L, both supernatant and effluent Cu 219
content were consistently low. The higher concentrations of released Cu2+ observed at the initial 220
CuO NP concentrations of 10 mg/L and 50 mg/L can be attributed to the increased sludge 221
surface charge and the decreased hydrophobicity resulting in more Cu2+ ions released from CuO 222
NPs. [21] Furthermore, the Cu concentrations in copper salt treatment were 3.2, 3.1, 4.9 and 5.9 223
NP possibly because humic acids are able to stabilize nanoparticles and retard dissolution rates. 225
[22]
226
Interestingly, CuO NPs were removed more efficiently than copper salt in this study with 227
removal efficiencies ranging from 72% to 93.2% for CuO NPs, while the values were 55.1% to 228
83.4% for Cu2+ ions treatment, suggesting that large fraction of CuO NPs was removed from the 229
wastewater. These observations also support the hypothesis that the mechanisms governing the 230
removal of CuO NPs and ionic copper are different. As for copper salt, it is highly possible that 231
the majority of the added copper salt may quickly undergo a transformation due to their 232
dissolution followed by complexion or precipitation. [10, 23] Furthermore, depending on the 233
wastewater characteristics, copper can also be removed by coagulation or ion exchange in 234
wastewaters. [24, 25] In contrast, the attenuation of the CuO NP concentration in the liquid is most 235
likely due to aggregation, settling and biosorption onto the biomass. [12, 26, 27]
236
237
Effect of CuO NPs and copper ions on COD removal
238
239
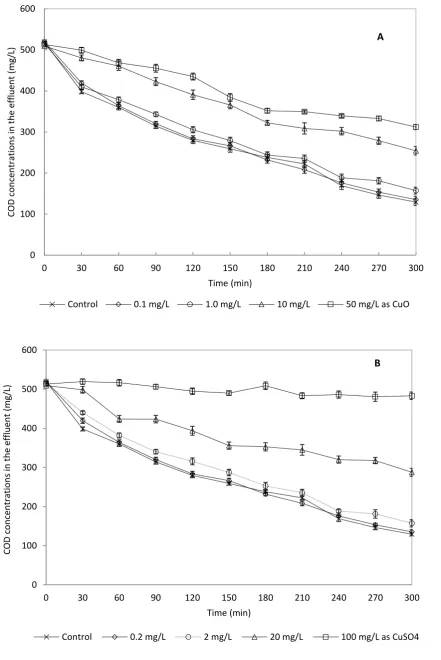
Prior to addition of CuO NPs, the COD concentration in the effluent was around 130 mg/L 240
which corresponds to a COD removal efficiency of 78.7% (Fig. 3). The presence of CuO NPs, 241
however, influenced the COD removal efficiencies, which slightly decreased to 77% (p<0.05) at 242
CuO NP concentrations of 1 mg/L, respectively. The exposure to 10 and 50 mg/L CuO NPs 243
further decreased COD removal efficiencies to 52.1% and 39.2%, respectively. The lower COD 244
removals was due to the high toxicity of the released Cu2+ ions from CuO NPs which inhibited 245
microorganisms. It can also be explained by the increased cell surface charge resulting in 246
reduced hydrophobicity and floc breakage as suggested by previous studies. [28, 29] Our finding 247
implies that 1 mg/L CuO NPs will cause some disturbance to the waste activated sludge process 248
revealed that both short- and long term exposure of 1.0 mg/L of ZnO NPs did not significantly 250
impact COD removal, despite the fact that ZnO NPs may exhibit more toxic effects on specific 251
microorganisms than CuO NPs. Chen et al. [21] investigated the influence of Cu NPs on the 252
physical-chemical properties of activated sludge, and indicated that lower Cu NPs concentrations 253
(5 mg/L) did not affect the sludge properties, while higher Cu NPs concentrations (30-50 mg/L) 254
may deteriorate the physical-chemical properties of activated sludge. 255
When CuSO4 was used, the Cu+2 concentration quickly increased to 4.1 mg/L after only 30
256
minutes and gradually increased to 16.6 mg/L after 300 minutes, which resulted in a greater 257
toxicity.In this study, in the presence of 20 and 100 mg/L copper sulphate, COD removals were 258
44.8% and 7.3%, which were significantly (p < 0.05) lower than those (52.1% and 39.2%) in the 259
presence of CuO NPs, showing that copper salt exhibited more severe toxicity towards microbes 260
than CuO NPs. Moreover, the MLSS concentration decreased markedly to 1.2 g/L with 100 261
mg/L CuSO4 (data not shown), showing that flocs were disrupted and cell lysis took place. From
262
Figures 2 and 3, it is clear that CuO NPs is less toxic than CuSO4 due to the fact that Cu ions
263
from CuSO4 dissolve more readily in water.These findings are consistent with Heinlaan et al. [16]
264
who evaluated the eco-toxicity of ZnO NPs, CuO NPs and TiO2 to bacteria and crustaceans, and
265
reported that CuSO4 was approximately 100-fold more toxic than nano CuO to Vibrio fischer
266
with LC50 value of 1.6 versus 79 mg/L, and 1000-fold more toxic than nano CuO to Daphnia
267
magna (0.17 versus 164.8 mg/L) and Thamncephalus platyurus (0.11 versus 94.5 mg/L). In this 268
study, after the addition of 50 mg/L CuO-NPs (equivalent to 40 mg/L Cu+2), the measured Zn2+ 269
concentration in the effluent progressively increased to only 2.8 mg/L after 5 hours, indicating a 270
low dissolution potential of ZnO-NPs in the system, and that the most likely cause of inhibition 271
was therefore the adsorption of CuO NP onto bacterial cells. 272
273
Effect of CuO NPs and copper ions on ammonium removal
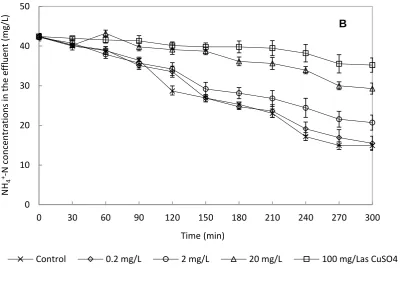
275
The effect of CuO NPs and copper ions on NH4+-N removal are shown in Figure 4. The NH4+-N
276
removal in the presence of 0.1 (64.1%) were relatively stable with increasing exposure time and 277
not statistically different (p<0.05) from the negative control at (64.8%) over a period of 5 h 278
exposure. However, when activated sludge was exposed to 1, 10 and 50 mg/L CuO NPs, the 279
effluent NH4+-N significantly (p<0.05) increased from 14.9 mg/L (control) to 18 mg/L, 25.1
280
mg/L and 30.8 mg/L, respectively, suggesting that CuO NPs at 1 mg/L could start causing some 281
inhibition to ammonia oxidizing bacteria. At higher CuO NP concentration, the flocculating 282
ability deteriorated due to the increased cell surface charge and the decreased hydrophobicity 283
made the sludge flocs more dispersed, which further increased the toxicity of the CuO NPs by 284
increasing the contact between CuO NPs and bacteria. [21] This finding also indicated that 285
biosorption of CuO NPs onto activated sludge induced adverse effects on the diversity and 286
activity of nitrifying microbial species. Additionally, in the present study, effluent ammonia 287
concentration (20.7 mg/L, 29.3 mg/L and 35.2 mg/L, respectively) in the presence of CuSO4
288
were higher than those in the presence of ZnO NPs (18 mg/L, 25.1 mg/L and 30.8 mg/L, 289
respectively), implying that Cu2+ ions exhibited more severe toxicity to ammonia oxidizing 290
bacteria than ZnO NPs. 291
292
Accumulation of CuO NPs and copper ions onto activated sludge
293
294
Activated sludge biomass from biological wastewater treatment processes is able to remove 295
heavy metals from wastewater, and biosorption plays an important role in heavy metal recovery. 296
[30, 31] CuO NPs and dissolved Cu2+ have been observed to bind on the surface of activated sludge.
297
[32] Previous studies reported that biosorption of CuO NPs can take place in activated sludge
298
mechanisms of partitioning of NPs to biosolids have been identified including binding to 300
extracellular polymers or cell surface, active cellular uptake, entrapment into flocs and diffusion 301
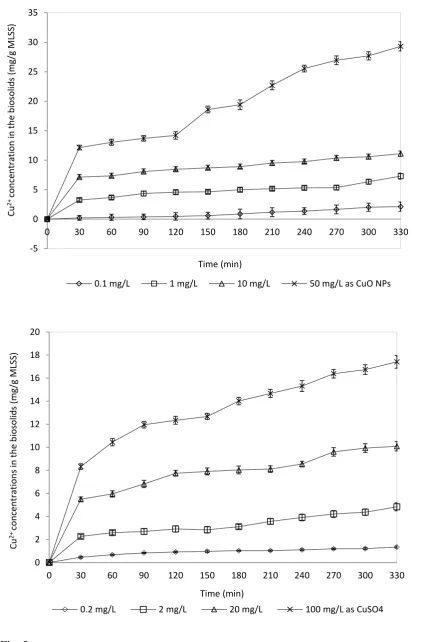
into biofilms. [33] In the present study, a gradual increase in the Cu2+ concentrations in the 302
biosolids was observed for both CuO NPs and copper salt treatment (Fig. 5). The copper 303
concentrations were 2.12, 7.29, 11.1 and 29.31 mg/g MLSS at the CuO NP concentrations of 0.1, 304
1.0, 10 and 50 mg/L after 5 h exposure, respectively, which was 1.58, 1.51, 1.10 and 1.68 fold 305
more than in the CuSO4 treatment. At 50 mg/L exposure, a mass balance on Zn revealed that 98%
306
of Cu from CuO NPs ended up in biosolids and 2% in the effluent. For CuSO4, the mass balance
307
was 86% onto biosolids and 14% in effluent. This finding suggests that CuO NPs have greater 308
potential for adsorption onto biosolids compared to Cu2+ ions, due to its smaller particles size 309
and larger surface area, and this biosorption capacity increased with the concentration of CuO 310
NPs. Furthermore, the higher copper levels found in the biosolids were mainly attributed to CuO 311
NPs, instead of the released Cu2+ from CuO NPs, given the fact that CuO NPs have much less 312
Cu2+ release capacity, compared to copper salt. This finding also reinforces the results of 313
previous studies [11, 34] which indicated that the primary process of NP removal from wastewater 314
is believed to be associated with biosorption onto biomass, although NPs may undergo 315
transformation (e.g., dissolution of metal ions from metal-based NPs). In addition, these 316
observations also support the hypothesis that different mechanisms might govern the removal of 317
CuO NPs and Cu2+ ions from wastewater. As for CuO NPs, the attenuation of the CuO NP 318
concentration in the solution phase is most likely due to precipitation of Cu species and CuO NP 319
adsorption onto the biomass. In contrast, copper salt quickly undergo dissolution followed by 320
complexation and precipitation. 321
322
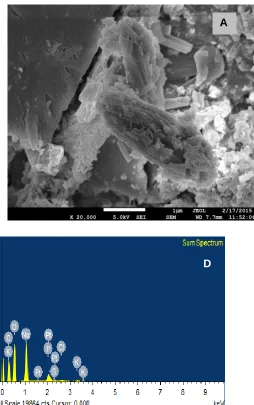
The morphological changes in the activated sludge induced by the accumulated CuO NPs and 323
the accumulation and adsorption of CuO NPs onto activated sludge. Such observation 325
corroborates previous study assessing the effect of CuO NPs on physicochemical stability of 326
activated sludge flocs. [12] SEM images revealed differences in damage extent between CuO NPs 327
and copper salt. Although these damage extent cannot be accurately quantified based on our 328
SEM analyses, the ionic copper appeared to have transformed to larger size aggregates during 329
the experiment. The accumulation of CuO NPs and Cu2+ on activated sludge was also confirmed 330
using EDS profile analysis to confirm their Cu-based composition (Fig. 6D-6E). The EDS profile 331
clearly demonstrates a Cu peak that is absent in the sample from the control reactor. 332
333
Bacterial viability assay
334
335
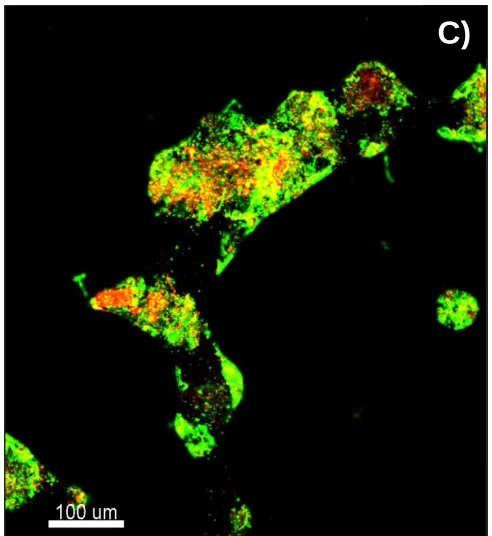
Figure 7 displays the bacterial viability in the control and in the activated sludge exposed to CuO 336
NPs and copper salt for 5 h. Compared to the control (Fig. 7A), the density of the dead cells 337
increased after the exposure of the activated sludge to 50 mg/L of CuO NPs (Fig. 7B) or 100 338
mg/L Cu2+ ions (Fig. 7C), indicating a loss in the cell viability. The structure of the activated 339
sludge became loose with numerous small aggregates of bacterial cells which may result in 340
dispersed flocs. This can be due to the adsorption of NPs onto the sludge and inhibition of cell 341
activity after exposure to 50 mg/L ZnO NPs.This was supported by the significant reduction in 342
contaminant removal observed under the exposure to CuO NPs and copper ions at higher 343
concentrations in this study. This finding was in agreement with previous studies [12, 21] which 344
revealed that higher concentrations of CuO NPs exhibited inhibitory effects on the activity of 345
activated sludge microorganisms. In addition, a decrease in the live/dead ratio was observed after 346
5 h exposure to CuO NPs (2.14) and copper ions (2.08) at high concentration of 50 mg/L, 347
It has been extensively reported that the toxicity of CuO NPs to activated sludge would be 349
mainly due to the release of soluble Cu2+ ions, and the toxicity of Cu2+ ions to microorganisms is
350
well documented. [35, 36] However, our work demonstrated that biosorption of CuO NP onto 351
sludge played a major role in inhibiting bacterial activity and not copper ions dissolution in the 352
bulk. In the present study, only 2.69 mg/LCu2+ was released from CuO NPs which is unlikely to 353
have caused severe inhibition. A release of 1.85 mg/L was observed by Hou et al. [12] when 354
sludge flocs were exposed to CuO NPs at the same initial concentration (50 mg/L). This 355
discrepancy might have been attributed to the size difference of investigated CuO NPs (40 nm ± 356
5 nm in the present study versus 92±12 nm in Hou et al. [12]), which in turn may lead to the 357
different interaction between NPs and bacteria, as well as the toxicity induced by NPs. Previous 358
studies have reported that CuO NPs could enhance the production of extracellular polymeric 359
substances (EPS), [12] which could strongly interact with the polymer matrix to impede the access
360
of pollutants to the bacterial cells and further increase the toxic resistance of the activated sludge 361
by retarding the contact of the metal with the bacteria within bioflocks. [37] However, once the 362
amount of released metal ions increased, the protective capacity of EPS to impede the access of 363
the CuO NPs to the activated sludge was weakened, due to their loose structure under high 364
toxicity condition. This explains the increased inhibition of CuO NPs to activated sludge at 365
higher concentrations observed in the present study. The toxicity of CuO NPs exposed to 366
bacteria can also be attributed to the changes of the sludge properties. [21] At low concentrations 367
of NPs, the dissolved Cu2+ ions from CuO NPs could function as the bridges between the 368
functional groups on the surface of bacteria and help to aggregate the microbes and promote the 369
bio flocculation formation. However, under higher concentrations of CuO NPs, the increased cell 370
surface charge weakened the strength between EPS and cations, resulting in the deterioration of 371
NPs could damage the cell membrane of bacteria (e.g., Escherichia coli), which would directly 373
lead to the death of cell. [35, 38]
374
375
Conclusions 376
377
In this study, the fate and behaviour of CuO NPs and copper ions in the waste activated sludge 378
process were investigated in SBR. The data indicate that the activated sludge process has the 379
potential to remove CuO NPs from wastewater. CuO NPs were efficiently retained by activated 380
sludge and CuO NPs were removed more effectively from the wastewater compared to copper 381
ions. Additionally, CuO NPs exhibited greater biosorption capacity and stronger affinity to 382
sewage sludge than copper salt. The short-term exposure to CuO NPs at 1 mg/L could cause 383
some effects on COD and ammonia removal. The exposure to CuO NPs and Cu2+ ions at higher
384
concentrations of 10 mg/L and 50 mg/L caused significant inhibition in biological wastewater 385
treatment. The results of bacterial integrity analysis imply that CuO NPs and copper salt at 386
higher concentrations reduced the viability of bacteria in the biological treatment process. 387
388
Acknowledgments 389
390
The authors would like to express sincere thanks to the Singapore Economic Development Board 391
and the Environment & Water Industry Programme. 392
393
References 394
[1] Kusic, H.; D. Leszczynska; N. Koprivanac; I. Peternel. Role of quantum dots 396
nanoparticles in the chemical treatment of colored wastewater: Catalysts or additional pollutants. 397
J. Environ. Sci., 2011, 23(9), 1479-1485. 398
[2] Dasari, T.P.; K. Pathakoti; H.M. Hwang. Determination of the mechanism of 399
photoinduced toxicity of selected metal oxide nanoparticles (ZnO, CuO, Co3O4 and TiO2) to E. 400
coli bacteria. J. Environ. Sci., 2013, 25(5), 882-888. 401
[3] Gottschalk, F.; T. Sonderer; R.W. Scholz; B. Nowack. Modeled environmental 402
concentrations of engineered nanomaterials (TiO2, ZnO, Ag, CNT, fullerenes) for different
403
regions. Environ. Sci. and Technol., 2009, 43(24), 9216-9222. 404
[4] Cioffi, N.; N. Ditaranto; L. Torsi; R.A. Picca; L. Sabbatini; A. Valentini; L. Novello; G. 405
Tantillo; T. Bleve-Zacheo; P.G. Zambonin. Analytical characterization of bioactive 406
fluoropolymer ultra-thin coatings modified by copper nanoparticles. Analytical and Bioanalytical 407
Chemistry, 2005, 381(3), 607-616. 408
[5] Chen, P.C.; G. Shen; C. Zhou. Chemical sensors and electronic noses based on 1-D metal 409
oxide nanostructures. IEEE Transactions on Nanotechnology, 2008, 7(6), 668-682. 410
[6] Ren, G.; D. Hu; E.W.C. Cheng; M.A. Vargas-Reus; P. Reip; R.P. Allaker. 411
Characterisation of copper oxide nanoparticles for antimicrobial applications. Int. J. Antimicrob. 412
Agents, 2009, 33(6), 587-590. 413
[7] Huang, H.L.; H.P. Wang. Speciation of nano-copper collected in molecular sieves from 414
chemical-mechanical planarization wastewater. J. Electron Spectros. and Related Phenomena, 415
2005, 144-147, 307-309. 416
[8] Brar, S.K.; M. Verma; R.D. Tyagi; R.Y. Surampalli. Engineered nanoparticles in 417
wastewater and wastewater sludge - Evidence and impacts. Waste Manag., 2010, 30(3), 504-418
[9] Boxall, A.B.A.; K. Tiede; Q. Chaudhry. Engineered nanomaterials in soils and water: 420
How do they behave and could they pose a risk to human health? Nanomedicine, 2007, 2(6), 421
919-927. 422
[10] Ganesh, R.; J. Smeraldi; T. Hosseini; L. Khatib; B.H. Olson; D. Rosso. Evaluation of 423
nanocopper removal and toxicity in municipal wastewaters. Environ. Sci. and Technol., 2010, 424
44(20), 7808-7813. 425
[11] Limbach, L.K.; R. Bereiter; E. Müller; R. Krebs; R. Gälli; W.J. Stark. Removal of oxide 426
nanoparticles in a model wastewater treatment plant: Influence of agglomeration and surfactants 427
on clearing efficiency. Environ. Sci. and Technol., 2008, 42(15), 5828-5833. 428
[12] Hou, J.; L. Miao; C. Wang; P. Wang; Y. Ao; B. Lv. Effect of CuO nanoparticles on the 429
production and composition of extracellular polymeric substances and physicochemical stability 430
of activated sludge flocs. Biores. Technol., 2015, 176, 65-70. 431
[13] Otero-González, L.; J.A. Field; R. Sierra-Alvarez. Inhibition of anaerobic wastewater 432
treatment after long-term exposure to low levels of CuO nanoparticles. Wat. Res., 2014, 58, 433
160-168. 434
[14] Luna-delRisco, M.; K. Orupõld; H.C. Dubourguier. Particle-size effect of CuO and ZnO 435
on biogas and methane production during anaerobic digestion. J. Hazard. Mat., 2011, 189(1-2), 436
603-608. 437
[15] Mortimer, M.; K. Kasemets; A. Kahru. Toxicity of ZnO and CuO nanoparticles to 438
ciliated protozoa Tetrahymena thermophila. Toxicology, 2010, 269(2-3), 182-189. 439
[16] Heinlaan, M.; A. Ivask; I. Blinova; H.C. Dubourguier; A. Kahru. Toxicity of nanosized 440
and bulk ZnO, CuO and TiO2 to bacteria Vibrio fischeri and crustaceans Daphnia magna and
441
[17] Aruoja, V.; H.C. Dubourguier; K. Kasemets; A. Kahru. Toxicity of nanoparticles of CuO, 443
ZnO and TiO2 to microalgae Pseudokirchneriella subcapitata. Sci. Total Environ. , 2009, 407,
444
1461-1468. 445
[18] Hou, L.; K. Li; Y. Ding; Y. Li; J. Chen; X. Wu; X. Li. Removal of silver nanoparticles in 446
simulated wastewater treatment processes and its impact on COD and NH4 reduction. Chemos.,
447
2012, 87(3), 248-252. 448
[19] APHA, In Standard Methods for the Examination of Water and Wastewater 22th edition. 449
Washington, D.C: 2012. 450
[20] Kaegi, R.; A. Voegelin; C. Ort; B. Sinnet; B. Thalmann; J. Krismer; H. Hagendorfer; M. 451
Elumelu; E. Mueller. Fate and transformation of silver nanoparticles in urban wastewater 452
systems. Wat. Res., 2013, 47(12), 3866-3877. 453
[21] Chen, H.; X. Zheng; Y. Chen; M. Li; K. Liu; X. Li. Influence of copper nanoparticles on 454
the physical-chemical properties of activated sludge. PLoS ONE, 2014, 9(3). 455
[22] Chaúque, E.F.C.; J.N. Zvimba; J.C. Ngila; N. Musee. Stability studies of commercial 456
ZnO engineered nanoparticles in domestic wastewater. Physics and Chemistry of the Earth, Parts 457
A/B/C, 2014, 67–69, 140-144. 458
[23] Hsu, H.F.; M. Kumar; Y.S. Ma; J.G. Lin. Extent of precipitation and sorption during 459
copper removal from synthetic wastewater in the presence of sulfate-reducing bacteria. Environ. 460
Eng. Sci., 2009, 26(6), 1087-1096. 461
[24] Vreysen, S.; A. Maes; H. Wullaert. Removal of organotin compounds, Cu and Zn from 462
shipyard wastewaters by adsorption - flocculation: A technical and economical analysis. Marine 463
Poll. Bull., 2008, 56(1), 106-115. 464
[25] Dobrevsky, I.; M. Dimova-Todorova; T. Panayotova. Electroplating rinse waste water 465
[26] Bondarenko, O.; K. Juganson; A. Ivask; K. Kasemets; M. Mortimer; A. Kahru. Toxicity 467
of Ag, CuO and ZnO nanoparticles to selected environmentally relevant test organisms and 468
mammalian cells in vitro: A critical review. Archives of Toxicology, 2013, 87(7), 1181-1200. 469
[27] Karri, S.; R. Sierra-Alvarez; J.A. Field. Toxicity of copper to acetoclastic and 470
hydrogenotrophic activities of methanogens and sulfate reducers in anaerobic sludge. Chemos., 471
2006, 62(1), 121-127. 472
[28] Chen, Z.; Y. Wang; K. Li; H. Zhou. Effects of increasing organic loading rate on 473
performance and microbial community shift of an up-flow anaerobic sludge blanket reactor 474
treating diluted pharmaceutical wastewater. J. Biosci. and Bioeng., 2014. 475
[29] Tan, M.; G. Qiu; Y.P. Ting. Effects of ZnO nanoparticles on wastewater treatment and 476
their removal behavior in a membrane bioreactor. Biores. Technol., 2015, 185, 125-133. 477
[30] Fan, T.; Y. Liu; B. Feng; G. Zeng; C. Yang; M. Zhou; H. Zhou; Z. Tan; X. Wang. 478
Biosorption of cadmium(II), zinc(II) and lead(II) by Penicillium simplicissimum: Isotherms, 479
kinetics and thermodynamics. J. Hazard. Mat., 2008, 160(2-3), 655-661. 480
[31] Göksungur, Y.; S. Üren; U. Güvenç. Biosorption of cadmium and lead ions by ethanol 481
treated waste baker's yeast biomass. Biores. Technol., 2005, 96(1), 103-109. 482
[32] Sheng, G.P.; J. Xu; H.W. Luo; W.W. Li; W.H. Li; H.Q. Yu; Z. Xie; S.Q. Wei; F.C. Hu. 483
Thermodynamic analysis on the binding of heavy metals onto extracellular polymeric substances 484
(EPS) of activated sludge. Wat. Res., 2013, 47(2), 607-614. 485
[33] Westerhoff, P.K.; A. Kiser; K. Hristovski. Nanomaterial removal and transformation 486
during biological wastewater treatment. Environ. Eng. Sci., 2013, 30(3), 109-117. 487
[34] Kaegi, R.; A. Voegelin; B. Sinnet; S. Zuleeg; H. Hagendorfer; M. Burkhardt; H. Siegrist. 488
Behavior of Metallic Silver Nanoparticles in a Pilot Wastewater Treatment Plant. Environ. Sci. 489
[35] Zhao, J.; Z. Wang; Y. Dai; B. Xing. Mitigation of CuO nanoparticle-induced bacterial 491
membrane damage by dissolved organic matter. Wat. Res., 2013, 47(12), 4169-4178. 492
[36] Gunawan, C.; W.Y. Teoh; C.P. Marquis; R. Amal. Cytotoxic origin of copper(II) oxide 493
nanoparticles: Comparative studies with micron-sized particles, leachate, and metal salts. ACS 494
Nano, 2011, 5(9), 7214-7225. 495
[37] Ma, J.; X. Quan; X. Si; Y. Wu. Responses of anaerobic granule and flocculent sludge to 496
ceria nanoparticles and toxic mechanisms. Biores. Technol., 2013, 149, 346-352. 497
[38] Duan, J.; Y. Yu; Y. Li; Y. Yu; Y. Li; X. Zhou; P. Huang; Z. Sun. Toxic Effect of Silica 498
Nanoparticles on Endothelial Cells through DNA Damage Response via Chk1-Dependent G2/M 499
Checkpoint. PLoS ONE, 2013, 8(4). 500
501
FIGURE CAPTIONS 503
504
Figure 1. CuO NPs (A-C) in deionized water at different resolution (i.e., 500, 100 and 50 nm) 505
characterized by TEM. These are representive images of particles after drying the suspension on 506
the microscope grid which resulted in aggregation. 507
508
Figure 2. Kinetics of Cu2+ released from CuO NPs (A) and Cu2+ released from CuSO
4 (B). Error
509
bars represent standard deviations of triplicate measurements. 510
511
Figure 3. COD concentrations in the effluent of A) CuO NPs treatment; and B) CuSO4 treatment.
512
Error bars represent standard deviations of triplicate measurements. 513
514
Figure 4. NH4-N concentrations in the effluent of A) CuO NP treatment; and B) CuSO4
515
treatment. Error bars represent standard deviations of triplicate measurements. 516
517
Figure 5. Cu2+ concentrations in the biosolids for A) CuO treatment; and B) CuSO4 treatment.
518
Error bars represent standard deviations of triplicate measurements. 519
520
Figure 6. SEM images of activated sludge after CuO NPs and Cu2+ ions exposure at the 521
concentration of 10 mg/L after 5 h. A) Sludge in the control; B) Sludge in the treatment exposed 522
to CuO NPs; and C) Sludge in the treatment exposed to Cu2+ ions; D) EDS spectra for A); E) 523
EDS spectra for B); and F) EDS spectra for C). 524
Figure 7. Bacterial viability in A) control treatment; B) in activated sludge exposed to CuO NPs 526
at the concentration of 50 mg L-1; and C) in activated sludge exposed to CuSO
4 treatment at the
527
concentration of 100 mg L-1 at the end of the experiment using confocal microscopy. 528
529
531
532
534
535
[image:25.595.83.503.73.716.2]536
Fig. 2 537
538
0 0.5 1 1.5 2 2.5 3 3.5
0 30 60 90 120 150 180 210 240 270 300
Re
le
ase
d
Cu
2+
(m
g/L)
Time (min)
0.1 mg/L I mg/L 10 mg/L 50 mg/L as CuO NPs
0 2 4 6 8 10 12 14 16 18
0 30 60 90 120 150 180 210 240 270 300
Re
le
ase
d
Cu
2
+ (m
g/L)
Time (min)
0.2 mg/L 2 mg/L 20 mg/L 100 mg/L as CuSO4 A
539
[image:26.595.84.526.75.736.2]540
Fig. 3 541
0 100 200 300 400 500 600
0 30 60 90 120 150 180 210 240 270 300
COD
con
ce
n
tra
tio
n
s in
t
h
e ef
flu
en
t
(m
g/L)
Time (min)
Control 0.1 mg/L 1.0 mg/L 10 mg/L 50 mg/L as CuO
0 100 200 300 400 500 600
0 30 60 90 120 150 180 210 240 270 300
COD
con
ce
n
tra
tio
n
s in
t
h
e ef
flu
en
t
(m
g/L)
Time (min)
Control 0.2 mg/L 2 mg/L 20 mg/L 100 mg/L as CuSO4 A
542 543 544 545 Fig. 4 546 0 10 20 30 40 50
0 30 60 90 120 150 180 210 240 270 300
NH 4 +-N co n ce n tra tio n s in t h e ef flu en t (m g/L) Time (min)
Control 0.1 mg/L 1.0 mg/L 10 mg/L 50 mg/L as CuO NPs
0 10 20 30 40 50
0 30 60 90 120 150 180 210 240 270 300
NH 4 +-N co n ce n tra tio n s in t h e ef flu en t (m g/L) Time (min)
Control 0.2 mg/L 2 mg/L 20 mg/L 100 mg/Las CuSO4 A
547 548 549 Fig. 5 550 -5 0 5 10 15 20 25 30 35
0 30 60 90 120 150 180 210 240 270 300 330
Cu 2+ con ce n tra tio n in th e b ios o lids (m g/g MLSS) Time (min)
0.1 mg/L 1 mg/L 10 mg/L 50 mg/L as CuO NPs
0 2 4 6 8 10 12 14 16 18 20
0 30 60 90 120 150 180 210 240 270 300 330
Cu
2
+ con
ce n tra tio n s in t h e b ios o lids (m g/ g MLSS ) Time (min)
Fig. 6
Cu2+, 4.93%
0.97
D F
A B C
A)
0
)
B)
0
)
C)
0
551
Fig. 7 552
553