Harnessing the science of social marketing
and behaviour change for improved water quality
in the GBR: A documentary analysis of
Reef Trust Tender (Burdekin) and Reef Programme
Harnessing the science of social marketing
and behaviour change for improved water quality
in the GBR: A documentary analysis of
Reef Trust Tender (Burdekin) and Reef Programme
Rachel Hay1 and Lynne Eagle1
1 College of Business, Law and Governance, James Cook University
Supported by the Australian Government’s National Environmental Science Programme
Creative Commons Attribution
Harnessing the science of social marketing and behaviour change for improved water quality in the Great Barrier Reef: A documentary analysis of Reef Trust Tender (Burdekin) and Reef Programme is licensed by James Cook University for use under a Creative Commons Attribution 4.0 Australia licence. For licence conditions see: https://creativecommons.org/licenses/by/4.0/
National Library of Australia Cataloguing-in-Publication entry:
978-1-925514-04-9
This report should be cited as:
Hay, R., and Eagle, L., (2016) Harnessing the science of social marketing and behaviour change for improved water quality in the Great Barrier Reef: A documentary analysis of Reef Trust Tender (Burdekin) and Reef Programme. Report to the National Environmental Science Programme. Reef and Rainforest Research Centre Limited, Cairns (95 pp.).
Published by the Reef and Rainforest Research Centre on behalf of the Australian Government’s National Environmental Science Programme (NESP) Tropical Water Quality (TWQ) Hub.
The Tropical Water Quality Hub is part of the Australian Government’s National Environmental Science Programme and is administered by the Reef and Rainforest Research Centre Limited (RRRC).The NESPTWQ Hub addresses water quality and coastal management in the World Heritage listed Great Barrier Reef, its catchments and other tropical waters, through the generation and transfer of world-class research and shared knowledge.
This publication is copyright. The Copyright Act 1968 permits fair dealing for study, research, information or educational purposes subject to inclusion of a sufficient acknowledgement of the source.
The views and opinions expressed in this publication are those of the authors and do not necessarily reflect those of the Australian Government.
While reasonable effort has been made to ensure that the contents of this publication are factually correct, the Commonwealth does not accept responsibility for the accuracy or completeness of the contents, and shall not be liable for any loss or damage that may be occasioned directly or indirectly through the use of, or reliance on, the contents of this publication.
Cover photographs: Lynne Eagle
This report is available for download from the NESP Tropical Water Quality Hub website:
Contents
List of Tables ... v
List of Figures ... v
Acronyms ... vi
Acknowledgements ... vii
Executive Summary ... viii
1.0 Introduction ... 1
2.0 Functional Literacy ... 2
2.1 Proficiency in Problem Solving in Technology-Rich Environments (PPSTRE) ... 6
2.1.1 Cognitive Limits: Time Dimensions ... 6
3.0 Readability Analysis ... 7
3.1.1 SMOG readability index ... 7
3.2 Norms, Message Framing and Message Appeals (including Fear Appeals) ... 8
3.2.1 Norms ... 8
3.2.2 Origins of Message Framing Theory ... 9
3.2.3 Fear Appeals ...12
3.3 Message Tone ...14
3.4 Design Principles ...15
3.4.1 Design ...15
3.4.2 Use of Visual Imagery ...15
4.0 Programme Analysis ...17
5.0 Analysis and Discussion ...19
5.1 Readability ...19
5.1.1 Reef Trust Tender (Burdekin) ...19
5.1.2 Reef Trust - Gully Erosion Control Program (Burdekin) ...22
5.1.3 The Reef Programme ...23
5.1.4 Summary of Readability Analysis ...27
5.2 Norms, Message Framing and Message Appeals (including Fear Appeals) ...30
5.2.1 Reef Trust Tender (Burdekin) ...31
5.2.2 Reef Trust Gully Erosion Control Programme ...32
5.2.3 Reef Programme (Dry Tropics) ...33
5.2.4 Reef Programme – Wet Tropics ...35
6.0 Recommendations and Conclusion ...37
ii
Appendix 1: Example text taken from Australian Government, Department of Environment, Reef Trust Tender – Burdekin webpage ...43 Appendix 2: Example text taken from Reef Trust Tender —Burdekin Applicant Guidelines
2015–2018 Reef Trust Phase II —Competitive Tender ...44 Appendix 3: Example text taken from Grant Contract - Part A Specific Project Activity Details ...45 Appendix 4: Example text taken from Part B – Grant Contract terms and Conditions ...46 Appendix 5: Example text taken from Reef Trust Tender – Burdekin Cane Industry ...47 Appendix 6: Example text taken from Reef Trust Tender – Burdekin Cane Industry Tender
Overview Factsheet1 ...48 Appendix 7: Example text taken from Reef Trust Tender – Improving Nitrogen and Irrigation
Management Factsheet 2 ...49 Appendix 7a: Example text taken from Reef Trust Tender - Further Information - Burdekin
Cane Industry (Fact Sheets 2 & 5) – Six Easy Steps ...50 Appendix 8: Example text taken from Reef Trust Tender – Frequently asked questions
Factsheet 3 ...51 Appendix 8a: Example text taken from Reef Trust Tender – Paddock to Reef Integrated
Monitoring, Modelling and Reporting Program, Reef Water Quality Protection Plan 2013-2018 ...52 Appendix 8b: Example text taken from Reef Trust Tender – Great Barrier Reef Report Card
2012 and 2013 Reef Water Quality Protection Plan ...53 Appendix 9: Example text taken from Reef Trust Tender – Minimum Standards of Management
Practice Factsheet 5 (listed as 4 online) ...54 Appendix 9a: Example taken from Reef Trust Tender – Further Information - Burdekin Cane
Industry ...55 Appendix 9b: Example taken from Reef Trust Tender – minimum standards of management
Practice - Smartcane BMP Modules – Soil Health Module (note score taken from associate PDF). ...56 Appendix 9c: Example text taken from Reef Trust Tender - Further Information - Burdekin Cane
Industry (Fact Sheets 4 opens as 5) – Smartcane BMP Modules – Irrigation and Drainage Management Module ...57 Appendix 9d: Example text taken from Reef Trust Tender - Further Information - Burdekin
Cane Industry (Fact Sheets 4 opens as 5) – Smartcane BMP Modules – Weed, Pest and Disease Management Module ...58 Appendix 9e: Example text taken from Reef Trust Tender - Further Information - Burdekin
Cane Industry (Fact Sheets 4 opens as 5) – Smartcane BMP Modules – Crop Production and Harvesting Module ...59 Appendix 9f: Example text taken from Reef Trust Tender - Further Information - Burdekin Cane
Appendix 9g: Example text taken from Reef Trust Tender - Further Information - Burdekin Cane Industry (Fact Sheets 4 opens as 5) – Smartcane BMP Modules – Natural Systems Management Module ...61 Appendix 9h: Example text taken from Reef Trust Tender - Further Information - Burdekin
Cane Industry (Fact Sheets 4 opens as 5) – Smartcane BMP Modules – WHS Module ...62 Appendix 10: Example text taken from Reef Trust Tender - Further Information - Smartcane
Best Management Practice Program Factsheet 6 (shows on webpage listing as Factsheet 5) ...63 Appendix 11: Example text taken from Reef Trust Tender Form – Tracking Code 9xtxlq ...64 Appendix 12: Example text taken from the Reef Trust Gully Erosion Control Program –
Approved Projects ...65 Appendix 13: Example text taken from the Reef Trust Gully Erosion Control Programme –
Approved Gully Erosion Control Projects ...66 Appendix 14: Example text taken from the Gully Toolbox – A technical guide for the Reef Trust
Gully Erosion Control Program ...67 Appendix 15: Example text taken from the Mapping Tool instructions for Reef Trust Gully
Erosion application ...68 Appendix 16a: Example text taken from the Reef Trust Gully Erosion draft funding agreement
(part a) ...69 Appendix 16b: Example text taken from the Reef Trust Gully Erosion Programme standard
terms and conditions (part b) ...70 Appendix 16c: Example text taken from the Reef Trust Gully Erosion Programme specific terms
and conditions (part c) ...71 Appendix 17: Example text taken from The Australian Government Reef Program webpage ...72 Appendix 18: Example text taken from NQ Dry Tropics – Projects – Sustainable agriculture73 Appendix 19: Example text taken from NQ Dry Tropics – Case Studies – Brad Rosten...74 Appendix 20: Example text taken from NQ Dry Tropics – Case Studies – Terry Creek...75 Appendix 21: Example text taken from NQ Dry Tropics – Case Studies – Joseph Magatelli .76 Appendix 22: Example text taken from NQ Dry Tropics – Projects & Programmes – Sustainable
Agriculture – Reef Program Webpage ...77 Appendix 23: Example text taken from NQ Dry Tropics – Projects & Programmes – Sustainable
Agriculture – Reef Program – Sugarcane activities...78 Appendix 23a: Example text taken from NQ Dry Tropics – Projects & Programmes –
Sustainable Agriculture – Reef Program – Sugarcane Automation Field Day ...79 Appendix 23b: Example text taken from NQ Dry Tropics – Projects & Programmes –
Sustainable Agriculture – Reef Program – Sugarcane Water Quality Grant Flyer ...80 Appendix 24a: Example text taken from NQ Dry Tropics – Projects & Programmes –
iv
Appendix 24b: Example text taken from NQ Dry Tropics – Projects & Programmes – Sustainable Agriculture – Reef Program – Grazing – Erosion Control Grader Workshop ...82 Appendix 25: Example text taken from NQ Dry Tropics – Projects & Programmes – Sustainable
Agriculture – Grazing BMP Webpage ...83 Appendix 26: Example text taken from NQ Dry Tropics – Projects & Programmes – Sustainable
Agriculture – Grazing BMP Webpage ...84 Appendix 26a: Example text taken from NQ Dry Tropics – Projects & Programmes –
Sustainable Agriculture – Grazing BMP – Accreditation Information – Certification and Audit Assurance Strategy ...85 Appendix 26b: Example text taken from NQ Dry Tropics – Projects & Programmes –
Sustainable Agriculture – Grazing BMP – SELF-ASSESSMENT Grazing Land Management ...86 Appendix 26c: Example text taken from NQ Dry Tropics – Projects & Programmes –
Sustainable Agriculture – Grazing BMP – Self-Assessment – Soil Health ...87 Appendix 27: Example text taken from Terrain Website Reef Programme page ...88 Appendix 28: Example text taken from Terrain Website – Paddock to Reef program - Reef
Water Quality Protection Plan ...89 Appendix 29: Example text taken from Terrain Website – Paddock to Reef program – Paddock
to Reef overview ...90 Appendix 30: Example text taken from Terrain Website – Paddock to Reef program –
sugarcane case studies – Comparing runoff loss of knockdown and residual herbicides in the Herbert catchment ...91 Appendix 31: Example text taken from Terrain Website – Paddock to Reef program –
sugarcane case studies – Sub-surface fertiliser application reduces nutrient runoff in the Herbert catchment ...92 Appendix 32: Example text taken from Terrain Website – Paddock to Reef program –
sugarcane case studies – Modelling pesticide runoff from improved land management scenarios ...93 Appendix 33: Example text taken from Terrain Website – Paddock to Reef program – Grazing
case studies – tracking gully activity in the Burdekin rangelands ...94 Appendix 34: Example text taken from Terrain Website – Paddock to Reef program – Grazing
List of Tables
Table 1: Adult Literacy and Life Skills Survey Five Level Assessment of Literacy... 2
Table 2: Summary of Functional Literacy Levels - Australians aged 15 - 74 years ... 2
Table 3: Comparison of Australian Literacy Levels - People aged 15 - 74 years 1996 - 2011 / 2012 ... 5
Table 4: Australian Proficiency in Problem Solving in Technology-Rich Environments . 6 Table 5: SMOG Conversion Tables (Kemp & Eagle, 2008; McGraw, n.d.) ... 8
Table 6: Summary of Positive versus Negative Framing ...12
Table 7: Key Characteristics of the Reef Trust Tender (Burdekin) and the Reef Programme ...17
Table 8: Relative risk of degraded water quality to the Great Barrier Reef (Source: Brodie et al., 2013 Scientific Consensus Statement, Chapter: 3) ...18
Table 9: SMOG analyses for material on The Reef Trust Tender (Burdekin) ...21
Table 10: SMOG analysis for material on the Reef Trust Gully Erosion Control Programme (Burdekin) ...23
Table 11: SMOG analysis for material on the Australian Government Reef Programme .. ...24
Table 12: SMOG analysis for material on the Australian Government Reef Programme – Burdekin Region ...25
Table 13: SMOG analysis for material on the Australian Government Reef Programme – Wet Tropics Region ...26
Table 14: The Reef Trust Tender (Burdekin) - Message Framing, Use of Norms and Message Tone ...31
Table 15: Reef Trust Gully Erosion Control Programme - Message Framing, Use of Norms and Message Tone ...32
Table 16: Australian Government Reef Programme and Reef Program – Burdekin Region - Message Framing, Use of Norms and Message Tone ...33
Table 17: Australian Government Reef Programme – Wet Tropics Region Message Framing, Use of Norms and Message Tone ...35
List of Figures
Figure 1: Extended Parallel Process Model ...13Figure 2: Elaboration Likelihood Model ...16
Figure 3: Burdekin Dry Tropics Region (Source: NQ Dry Tropics) ...17
Figure 4: Average SMOG Scores for Water Quality Programmes Analysed ...28
Figure 5: Illustration of results of message framing, norms and message tone analysis - Reef Trust Tender (Burdekin) ...32
Figure 6: Illustration of results of message framing, norms and message tone analysis - Reef Programme (Dry Tropics) ...34
vi
Acronyms
DSITI ... Department of Science Information Technology and Innovation
DEHP ... Department of Environment Heritage and Protection
GBR ... Great Barrier Reef
GBRMPA ... Great Barrier Reef Marine Park Authority
IM ... Integrative Model of Behaviour Change and Prediction
OECD ... Organisation for Economic Cooperation & Development
NESP ... National Environmental Science Programme
NQ ... North Queensland
NRM ... Natural Resource Management
PPSTRE ... Proficiency in Problem Solving in Technology-Rich Environments
RAIN ... Readability Assessment Instrument
TIB ... Triandis’ Theory of Interpersonal Behaviour
TWQ ... Tropical Water Quality
Acknowledgements
This project, supported through funding from the Australian Government’s National Environmental Science Programme (NESP) Tropical Water Quality (TWQ) Hub, would not have been possible without the kind support and help of many individuals and organisations.
We sincerely acknowledge contributions towards the project from the Department of the Environment, Reef Trust, and the Department of Environment and Heritage Protection. The Department of Science, Information Technology and Innovation, and the Department of Agriculture and Fisheries, NQ Dry Tropics, and Terrain NRM, as well as from the Great Barrier Reef Marine Park Authority, and the sugar cane industry working groups.
viii
EXECUTIVE SUMMARY
The intention of the documentary analysis is to assess the way that messages to land managers about water quality in the Great Barrier Reef are presented in terms of their readability, message framing and message tone. Two programmes were selected: (1) the Reef Programme; and (2) the Reef Trust Tender (Burdekin). The programmes selected for evaluation had been marketed within both the wet and the dry tropics, and they had been designed for both graziers and cane farmers.
The readability analysis has shown all three programmes to be written at a similar level well above the recommended reading level of grade / year 9. The documents associated with the Reef Programme (Burdekin), with a SMOG score of 13, were slightly more readable than documents associated with the Reef Trust Tender (Wet Tropics) (17) or the Reef Programme (Burdekin) (18).
A readability score of 18 or above requires the reader to have achieved a university degree and a score of 17 means that they must have received a level of further education beyond high school, whereas for the readability level of 13 the reader must have completed high school. Therefore, the analysis of water quality information indicates that many of the communications are written in language too complex for a substantial percentage of the Australian population.
Each of the programmes analysed rated slightly different in terms of norms, tone and message framing used. The programmes used both positive and negative framing as well as fear and guilt appeals. Some messages appeared to be collaborative and both injunctive and descriptive norms were used to demonstrate approved methods of what land managers ought to be doing and how other land managers were behaving. In addition, many of the documents were also dictatorial or patronising.
Due to the nature of message communication, there are no standard rules to apply to norms, message tone and framing. However, understanding the principles of communication can help to deliver messages appropriate to the given audience (see future report NESP Project 3.1.3 Harnessing the science of social marketing in communication materials development and behaviour change for improved water quality in the GBR: a desktop review).
1.0 INTRODUCTION
The National Environmental Science Programme (NESP) Tropical Water Quality (TWQ) Hub
Project 2.1.3: Harnessing the science of social marketing and behaviour change for improved water quality in the Great Barrier Reef: An action research project is working in partnership with staff from the Australian Government’s Great Barrier Reef Marine Park Authority (GBRMPA), the Department of the Environment and Energy (DoEE), regional Natural Resource Management bodies, and the Queensland Government’s Department of Science Information Technology and Innovation (DSITI) and the Department of Environment and Heritage Protection (EHP) to evaluate how water quality improvement programmes are ‘marketed’ to land managers.
The project will use data collected from land managers and elsewhere to critically evaluate the way water quality (WQ) improvement programmes are ‘marketed’. It will use insights from those evaluations to inform the reconfiguration of engagement strategies associated with programmes scheduled for rollout during 2017. Demonstrating methods for monitoring and assessing the extent to which these different programmes and changed strategies improve adoption and/or alter behaviours. Project 2.1.3 is designed with the explicit intention of linking to the current and planned Programmes being rolled out by both governments under the Reef 2050 Plan.
The purpose of this report is to critically analyse the readability of materials from selected programmes. The documentary analysis is part of the critical analysis. Material from the following programmes will be analysed for its readability using the SMOG readability index (McLaughlin, 1969), message framing (Gerend & Cullen, 2008; Rothman & Salovey, 1997; Tversky & Kahneman, 1974), use of norms and message tone (Barnes, Toma, Willock, & Hall, 2013, p. 449). A discussion on the analysis tools follows in Section 3.0.
Reef Trust Tender - Burdekin
(http://www.environment.gov.au/marine/gbr/reef-trust/reef-trust-tender-burdekin)
The Reef Programme
(http://www.nrm.gov.au/national/continuing-investment/reef-programme)
The intention of the analysis is to assess the way that messages to landholders are presented in terms of their readability, message framing, and message tone. Of these, all have been identified in past research as impacting significantly on the way that messages are processed (if at all) and whether the messages are ultimately influential in encouraging the desired behaviours (Clark, 2014). Unfortunately, much of the work in these areas, especially message tone, relates to health issues with a focus on the need for concern and empathy (van Stolk-Cooke, Hayes, Baumel, & Muench, 2015) or political campaigning (Barton, Castillo, & Petrie, 2016) and therefore is of limited use in the agri-environmental context.
2
2.0 FUNCTIONAL LITERACY
The Organisation for Economic Cooperation and Development (OECD) (Nutbeam, 2008) defines functional literacy as whether a person is able to understand and employ printed information in daily life, at home, at work and in the community. Varying definitions of literacy make cross-study comparisons difficult. However, there appears to be agreement that some 20% of the population of most developed countries have severe literacy problems and a further 20% have limited literacy (Adkins & Ozanne, 2005; Office for National Statistics, 2000).
[image:13.595.71.526.334.540.2]Concerns regarding the functional literacy of the Australian population as a whole have been evident for some time. For example, the 2006 Australian Bureau of Statistics (ABS) Adult Literacy and Life Skills Survey used an internationally recognised five-level assessment of literacy, for which Level 3 is regarded as: the “minimum required for individuals to meet the complex demands of everyday life and work in the emerging knowledge-based economy” (Australian Bureau of Statistics, 2006 (reissued 2008); Australian Council for Adult Literacy, 2009), Table 1.
Table 1: Adult Literacy and Life Skills Survey Five Level Assessment of Literacy
LEVEL POINTS DESCRIPTION
1 0-225 Indicates a person with very poor literacy skills
2 226-275 Identifies individuals who, although they can read, can deal with only material that is simple, clearly laid out and in which the tasks involved are not too complex
3 276 - 325 Denotes people with the ability to integrate several sources of information and solve more complex problems. This is the level of skill regarded by many experts as a suitable minimum for coping with the demands of everyday life and work in a modern society.
4 & 5 326 -500 Describes respondents who demonstrate the capacity to use higher order thinking and information processing skills. Since the numbers performing at the highest skill level are small (under five percent in most countries), Level four and five are combined for the purposes of data analysis.
There are particular concerns evident in terms of the high proportion of people unable to problem solve.
Table 2 summarises functional literacy of Australians aged between 15 and 74 years. The high percentage of the population who fail to meet the minimum levels is a concern given the increasing amount of print-based material provided either by conventional print media or via the Internet.
DOMAINS
MEASURED DOMAIN DEFINITION % WITH SCORES FALLING IN THE LOWEST TWO QUINTILE LEVELS PROSE
LITERACY The ability to understand and use information from various kinds of narrative texts, including texts from newspapers, magazines and brochures.
46
DOCUMENT
LITERACY The knowledge and skills required to locate and use information contained in various formats including job applications, payroll forms, transportation schedules, maps, tables and charts.
47
NUMERACY The knowledge and skills required to effectively manage and respond to the mathematical demands of diverse situations.
53
PROBLEM
SOLVING Goal-directed thinking and action in situations for which no routine solution is available. 70
A further concern is that of the inability to understand technical rather than generic material. Scientific literacy is defined as having “a basic vocabulary of scientific terms and constructs and a general understanding of the nature of scientific inquiry”; on this basis only 17% of US adults were classified as being scientifically literate (Miller, 2004, p.273).
An additional group also exists that could be classed as 'alliterate', in that they are able to read but choose not to, and rely on television rather than print media for news. This group prefers to learn through trial and error rather than by reading instructions (Wallendorf, 2001). While the specific preferences and needs of these groups should be considered, it is essential to avoid being seen as condescending in the design and delivery of appropriate interventions (Bohnet, 2008).We also caution that much of the work in this field is American in origin and centres primarily on the health sector. Clearly, more research is needed in functional literacy as it relates to agri-environmental issues.
4
Table 3: Comparison of Australian Literacy Levels - People aged 15 - 74 years 1996 - 2011 / 2012 (Australian Bureau of Statistics, 2013)
Literacy Level Descriptors:
Level 1: Read relatively short digital or print texts to locate a single piece of information Level 2: Match text and information, may require paraphrasing or low-level inferences Level 3: Read dense or lengthy text, identify, interpret or evaluate one or more pieces of
information, disregard irrelevant or inappropriate content
Level 4: Integrate, interpret or synthesise information from complex or lengthy texts, interpret or evaluate subtle evidence-claims or persuasive discourse
Level 5: Search for and integrate information across multiple dense texts, construct synthesis of similar and contrasting ideas or evaluate evidence-based argument, make high-level inferences.
Literacy 1996 2006 2011- 2012
Total persons aged 15–74 years ‘000 % ‘000 % ‘000 % Below Level 1/ Level 1 2468.7 18.7 2512.6 16.6 2361.1 14.1
Level 2 4035.3 30.5 4419.7 29.3 5036.0 30.1
Level 3 5068.1 38.3 5986.8 39.6 6339.0 37.9
Level 4/5 1648.7 12.5 2186.3 14.5 2611.9 15.6
Missing 356.3 2.1
Total 13220.8 100.0 15105.4 100.0 16704.4 100.0 Numeracy Level descriptors:
Level 1: Perform simple, one-step concrete tasks
Level 2: Perform task that require identifying and acting on mathematical information in common contexts
Level 3: Perform task that require an understanding of mathematical information in contexts that are not always familiar and are presented in more complex ways
Level 4: Perform tasks that may be complex, abstract or embedded in unfamiliar contexts: multiple steps requiring selection of appropriate problem-solving
Level 5: Understand complex representations and abstract and formal mathematical and statistical ideas, sometimes embedded in complex texts
Numeracy 2006 2011- 2012
Total persons aged 15–74 years ‘000 % ‘000 %
Below Level 1/ Level 1 3014.5 20.0 3631.5 21.7
Level 2 4706.0 31.2 5423.2 32.5
Level 3 5338.4 35.3 5231.5 31.3
Level 4/5 2046.5 13.5 2061.9 12.3
Missing 356.3 2.1
6
2.1 Proficiency in Problem Solving in Technology-Rich
Environments (PPSTRE)
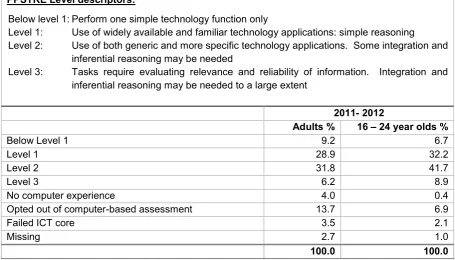
There are known socio-economic differences in digital literacy (specific skills and wider competencies), also termed ‘technology fluency’ (Garcia, 2014) impacting on both the time spent online and the tasks carried out (Castaño-Muñoz, 2010). A recent OECD report maps proficiency in problem solving in technology-rich environments (Table 4), defined as: “using digital technology, communications tools and networks to acquire and evaluate information, communicate with others and perform practical tasks” (Organisation for Economic Cooperation and Development, 2012, p. 5).
[image:17.595.70.526.327.587.2]This impacts on people’s ability to access, extract and apply information from websites or use technology-based tools with confidence and proficiency.
Table 4: Australian Proficiency in Problem Solving in Technology-Rich Environments (OECD, 2012)
PPSTRE Level descriptors:
Below level 1: Perform one simple technology function only
Level 1: Use of widely available and familiar technology applications: simple reasoning Level 2: Use of both generic and more specific technology applications. Some integration and
inferential reasoning may be needed
Level 3: Tasks require evaluating relevance and reliability of information. Integration and inferential reasoning may be needed to a large extent
2011- 2012
Adults % 16 – 24 year olds %
Below Level 1 9.2 6.7
Level 1 28.9 32.2
Level 2 31.8 41.7
Level 3 6.2 8.9
No computer experience 4.0 0.4
Opted out of computer-based assessment 13.7 6.9
Failed ICT core 3.5 2.1
Missing 2.7 1.0
Total 100.0 100.0
2.1.1 Cognitive Limits: Time Dimensions
3.0 READABILITY ANALYSIS
3.1.1 SMOG readability index
To investigate the Water Quality Programme offerings, we searched the designated websites for water quality programme related material, which was then analysed for readability using the SMOG readability index. The SMOG index has been described as “the gold standard readability measure” (Fitzsimmons, Michael, Hulley, & Scott, 2010, p. 294).
The originator (McLaughlin, 1969) of the SMOG formula teamed up with JAVA programming expert Alain Trottier to provide an (undated) internet-based version of the calculator at
http://www.harrymclaughlin.com/SMOG.htm. It is also available on a number of readability websites, such as Trottier’s Words Count Website (http://wordscount.info/index.html) and the Readability Score website (https://readability-score.com/text/). In previous research, we have compared the manually calculated results with those derived from the internet version and found no difference between them (Eagle & Dahl, 2016; Kemp & Eagle, 2008). This calculation measures only the likely reading level required for comprehension of the material and no other aspects such as readability and suitability, which could be assessed using other tools such as the Readability Assessment Instrument (RAIN) (Adkins, Elkins, & Singh, 2001) or the Suitability Assessment of Materials measurement (SAM) (Doak, Doak, & Root, 1985).
This index was selected because it has been repeatedly validated, and because of its proven accuracy, correlation with other readability formulae and subsequent widespread use in the academic literature, primarily in the health field (Mumford, 1997; Wallace & Lemon, 2004). More recently, it has also been used in environmental contexts such as renewable energy (Biddinika et al., 2016), drinking water reports (Roy et al., 2015) and online crisis communication (Temnikova, Vieweg, & Castillo, 2015).
Reading is a skill like any other. The average adult reading skill level will fall by 3 – 5 grades below the level expected at the completion of formal education. Thus an adult who left school after 12 years of formal education but who does not maintain their reading skills can be expected to have a reading skill level of 7 – 9 (Kemp & Eagle, 2008). It is recommended that material be written at no more than grade / year 9 level to enable the majority of the general population to understand it (Carbone & Zoellner, 2012).
8
Table 5: SMOG Conversion Tables (Kemp & Eagle, 2008; McGraw, n.d.) 30 or more sentences Conversion for less than 30 Sentences Word
Count Approximate Level +/- 1.5 grades Grade Number of Sentences Conversion # multiplier Number of Sentences Conversion # multiplier
0-2 4
Nursery, Junior/ Primary School
29 1.03 14 2.14
3-6 5 28 1.07 13 2.3
7-12 6 27 1.1 12 2.5
13-20 7 26 1.15 11 2.7
21-30 8 25 1.2 10 30
31-42 9 24 1.25
43-56 10 23 1.3
57-72 11
Secondary School
22 1.36
73-90 12 21 1.43
91-110 13 20 1.5
111-132 14 19 1.58
133-156 15 18 1.67
157-182 16 Further Education 17 1.76
183-210 17 16 1.87
211-240 18+ Higher Education College/University 15 2.0
3.2 Norms, Message Framing and Message Appeals (including Fear
Appeals)
3.2.1 Norms
Norms revolve around standards of proper or acceptable behaviour. While some research treat norms as a single concept (Barnes et al., 2013, p. 449), others distinguish between injunctive norms (portrayal of what people ought to do) and descriptive norms (what people actually do) (Cialdini, 2007). Additionally, it has been recognized for more than two decades that, when there is a perceived conflict between actual or perceived norms and attempts to change behaviours in a way that would conflict with those norms, message effectiveness will be hampered (Cialdini & Goldstein, 2004). Cialdini (2004) also cautions against depicting behaviour that is problematic and thus targeted for change as being widespread as this may result in the perception of behaviour change being seen as contrary to prevailing social norms or that changing one’s own behaviour will be futile. An example of this is the American ‘Crying Indian’ anti-littering campaign in which an indigenous American is shown paddling down an increasingly polluted river. While the campaign received numerous awards and was hailed as powerful (Searles, 2010), subsequent research revealed that it reinforced descriptive norms, i.e. the perception that it was normal to litter rather than the injunctive norm that people should not litter (Maio et al., 2007).
3.2.2 Origins of Message Framing Theory
Message framing derives from prospect theory (Gerend & Cullen, 2008; Rothman & Salovey, 1997; Tversky and Kahneman, 1974). Prospect theory itself developed from extensive research into responses to people’s perceptions of the prospect of positive (gain) or negative (loss) outcomes resulting from a range of specific behaviours. This research confirmed that people tend to be loss averse, being prepared to take risks to avoid losses but avoiding risk if there is potential gain from an action (Van de Velde, Verbeke, Popp, & Van Huylenbroeck, 2010). Far more research has been conducted into message framing effects in the health sector than in environmental sectors although research in the latter sector is growing, albeit largely in terms of broad pro-environmental areas (Chang & Wu, 2015) and climate change communication (Scannell & Gifford, 2013). We believe that the general message framing principles identified in prior research are likely to be applicable to the agri-environment sector.
In terms of framing, a message can either emphasise the advantages of doing a certain action (e.g., in relation to health, losing weight as a result of regular exercise) or it can emphasise the negative consequences of not taking a certain action (e.g. having a higher likelihood of cardiovascular disease as a result of not taking regular exercise). In the agri-environment sector, the gains in terms of positive outcomes of best land management practices would be emphasised versus the potential losses in terms of negative outcomes from not taking action.
Both approaches have been used successfully in various campaigns. However, research that has explored the effects of either positive or negative message framing has led to conflicting results (Homer & Yoon, 1992; Maheswaran & Meyers-Levy, 1990).It is now usually recognised that no one single framing approach is applicable across all intervention types (Block & Keller, 1995; Alexander J. Rothman & Salovey, 1997). We now review the situations in which positive versus negative framing has been explored.
3.2.2.1 Positive framing
Positively framed messages appear to be stronger for preventative behaviour and health affirming messages (i.e. no risk in undertaking the behaviour), such as stopping smoking before the onset of ill-health related to smoking. However, reviews of previously published studies suggest that this may not apply in all situations (van Assema, Martens, Ruiter, & Brug, 2001). This may potentially be explained by the findings that positively framed messages will not be effective if the recipient is unsure about behavioural norms (Blanton, Köblitz, & McCaul, 2008). For example, if reduced fertiliser application rates are not considered a behavioural norm, then a positively framed message may be confusing, as the recipient may question why if the solution to the problem is simple it is not done so all the time by others in the industry.
10
(Bird & Tapp, 2008). We have been unable to identify any studies that investigated these effects in the agri-environmental context.
Additional factors that may impact on potential intervention effectiveness include whether new behaviour is being promoted or whether ceasing current behaviour is targeted (Snyder et al., 2004). Additionally, it has been argued that positive framing fosters a greater self-efficacy, which in turn is a major factor in compliance behaviour (Jayanti & Burns, 1998) and therefore long-term behaviour change. Self-efficacy has been identified as a factor that should be stressed more strongly by health professionals during their discussions with patients (Holloway & Watson, 2002) and expectations regarding self-efficacy have long been proven to be a major factor in the outcomes of health behaviour change interventions (Strecher, De Vellis, Becker, & Rosenstock, 1986). The self-efficacy issues relating to other potential behavioural influences will be explored in the project’s ongoing research activity.
The level of personal involvement in a message topic also affects the type of framing that is more effective. Evidence suggests (Donovan & Jelleh, 1999) that in low involvement conditions positive messages are more effective, whereas the reverse is true for high-involvement conditions. Again, this may support why for example positive framing appears to have been effective in the past for sunscreen use, i.e. that messages framed as:
“If you use sunscreen with SPF or higher, you increase your chances of keeping your skin healthy and your life long”
“Using sunscreen decreases your risk for skin cancer and prematurely aged skin”
were more effective than:
“If you don’t use sunscreen with SPF 15 or higher you increase your chances of damaging your skin and bringing on an early death”
“Not using sunscreen increases your risk for skin cancer and prematurely aged skin” (Detweiler, Bedell, Salovey, Pronin, & Rothman, 1999).
In water conservation interventions, positive framed messages such as
“by conserving water through installing low-flow irrigation heads, you will decrease the cost of your water bills in the future”
have been suggested as potentially more effective (Owens, Warner, Rumble, Lamm, & Cantrell, 2015)than:
“by wasting water through installing high power irrigation heads, you will increase the cost of your water bill in the future”
“Farmers who manage runoff are reducing pollutants into the Great Barrier Reef protecting our reef for its future”
Conversely, a negatively framed message might be:
“Farmers who do not manage runoff are continuing to harm the Great Barrier Reef, risking harm to corals, sea life and water quality”.
3.2.2.2 Negative framing
Negative message framing has been found to be more effective for illness-detecting behaviour (Rothman, Martino, Bedell, Detweiler & Salovey 1999). Where there is uncertainty about the outcome of the behaviour, but awareness of the danger of not getting a problem detected early, for example for screening programmes that prevent a more serious outcome, such as regular mammography for women over 40 or cholesterol checks. However, there is also evidence of significant barriers to these types of messages among adolescents and young adults (Miller, Lane, Deatrick, Young & Potts, 2007), reactance effects, where direct, potential or perceived threats to personal freedom cause resistance (see Eagle et al., 2016, p. 22 for more discussion on the reactance effect).
12
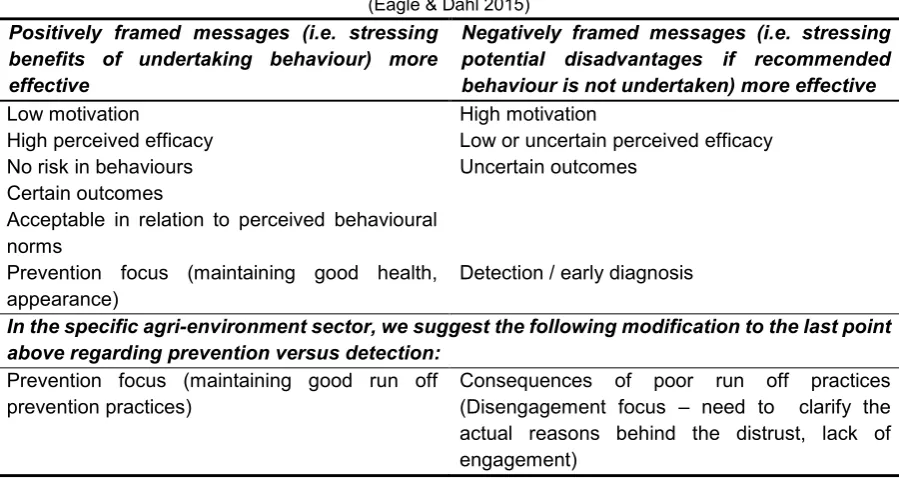
[image:23.595.73.523.152.391.2]Table 6 summarises the existing state of knowledge regarding the situations in which positive or negative framed messages have been found to be most effective within the health sector. We have then added the specific agri-environmental context to the bottom of the table.
Table 6: Summary of Positive versus Negative Framing (Eagle & Dahl 2015)
Positively framed messages (i.e. stressing benefits of undertaking behaviour) more effective
Negatively framed messages (i.e. stressing potential disadvantages if recommended behaviour is not undertaken) more effective
Low motivation High motivation
High perceived efficacy No risk in behaviours Certain outcomes
Acceptable in relation to perceived behavioural norms
Low or uncertain perceived efficacy Uncertain outcomes
Prevention focus (maintaining good health,
appearance) Detection / early diagnosis
In the specific agri-environment sector, we suggest the following modification to the last point above regarding prevention versus detection:
Prevention focus (maintaining good run off
prevention practices) Consequences of poor run off practices (Disengagement focus – need to clarify the actual reasons behind the distrust, lack of engagement)
Confounding factors include the degree of risk involved in changing behaviours (Chang & Wu, 2015). Communicating uncertainty of outcomes requires consideration, as people are reluctant to change behaviours if uncertainty is high, and if potential outcomes are seen as threatening, denial may be triggered, resulting in a refusal to make any meaningful behaviour changes (Morton, Bretschneider, Coley, & Kershaw, 2011). We therefore review the potential impact of fear appeals, a specific subset of negative message framing.
3.2.3 Fear Appeals
Message appeals are the connection between the emotion or the cognition and the consumer’s response to the message (Sheth, 2011). Appeals can be rational or emotional and can include fear appeals. Fear appeals should be used with caution as, while early studies suggest that fear appeals have the potential to influence attitude change and subsequent behaviour, there are numerous examples of interventions based on fear appeals not achieving the objectives (Donovan, Jalleh, Fielder & Ouschan, 2009). Other research also suggests the need for caution. Most studies that claim fear appeals to be effective have been laboratory-based, often with methodological shortcomings, and have measured only short-term effects. It is suggested that real-world effects are weaker – therefore this type of strategy may be least effective with people with low self-efficacy (Hastings, Stead & Webb, 2004).
threat (Snipes, LaTour & Bliss, 1999) such as ultimately improving the water quality of the Great Barrier Reef.
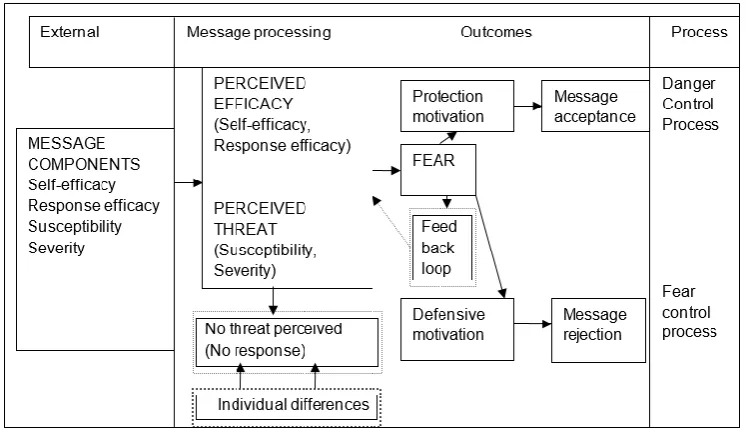
[image:24.595.111.484.260.478.2]The Extended Parallel Process Model, shown in Figure 1, may offer an explanation for the fact that some fear appeals are effective and others not. If a threat is seen as trivial or not relevant to the individual, the risk message will be ignored. Even when susceptibility is recognised, if an individual doubts their ability to minimise the threat (self-efficacy), or is uncertain regarding the outcome of their actions (risk assessment) they will control concerns and fears by denial and rejection of the message. Factors recognised as impacting on the ability of individuals to take effective steps to minimise the risk include both social (e.g. peer pressure and social norms) and physical pressure (e.g. work environment). Again, we stress that this model has not been explicitly tested in the agri-environment context.
Figure 1: Extended Parallel Process Model (Witte, 1994)
Fear appeals appear to be effective and appropriate only in situations where the solution to a fairly critical problem is relatively easy and effectivesolutions are available (Buller, Borland, & Burgon, 1998). An additional factor appears to be a lessening of the effectiveness of fear appeals over time. The ongoing usage of fear appeals can in fact lead to complacency as people start to no longer respond with fear, but rather with indifference to the messages, if not ‘switching off’ entirely (Brennan & Binney, 2010).
14
In addition, threats of stronger government legislation and regulation may be interpreted as a form of fear-based messaging; the use of law generally is thought of as “coercive and punishing” (Rothschild, 1999, p. 25). Evidence regarding actions taken to avoid compulsion is somewhat mixed. For example, in the UK, the agricultural sector is noted as having tried to avoid statutory controls on pesticide use through collective voluntary action but the environmental outcomes achieved are noted as having been mixed (Blackstock, Ingram, Burton, Brown, & Slee, 2010). Further, it is suggested that fear of penalties for non-compliance is not as effective in changing beliefs and convictions that behaviour change is necessary and desirable (Mols et al., 2015).
It is important to develop ways of communicating the need for ‘buy in’ to finding appropriate and potentially effective solutions to diffuse pollution challenges and the behaviour change that will be necessary and effective. It is also important to frame the overarching problem in a way that will not alienate target groups and that will provide evidence of the need for action on the part of landholders and focuses on salient beliefs (Greiner, 2016; Hurlbert, 2014; Maio et al., 2007). Drawing on a body of earlier research, the following recommendations are relevant here:
“The content and quality of the message can be manipulated to make it more persuasive. For example, messages are more persuasive if they contain very specific recommendations for action rather than general recommendations and if they present questions within arguments, which encourage individuals to systematically analyse the information. Messages presenting both sides of an argument should ensure that opposing arguments are adequately refuted to be persuasive” (Blackstock et al., 2010, p. 5632).
As part of this persuasion focus, message tone and the use of visual imagery are important in achieving effective motivational rather than prescriptive communication. These are discussed in the following sections.
3.3 Message Tone
While readability and message framing have been identified in past research as impacting significantly on the way that messages are processed (if at all) and whether the messages are ultimately influential in encouraging the behaviours desired, message tone effects have received less attention (Clark, 2014). Unfortunately, much of the work in relation to these areas, especially message tone, relates to health issues with a focus on the need for concern and empathy (van Stolk-Cooke et al., 2015) or political campaigning (Barton et al., 2016) and therefore is of limited use in the agricultural-environmental context.
3.4 Design Principles
3.4.1 Design
Design of communication, whether it is documents, posters or websites is important to conversions of the advertised material. If the communication is poorly designed then it will have less chance of being understood, less attention will be paid to its content resulting in less uptake of its product. Good design relies on six principles: balance, proximity, alignment, repetition, contrast and space (J6 Design, 2015).
Balance provides stability and structure to the design, whereas proximity creates relationships between the included elements. This is particularly important when considering the use of visual imagery (see section 3.3.5). Aligning the material creates visual relationships between elements of the design features. Repetition amongst documents, in terms of brochures, posters and other paper based advertising and amongst websites where each page has certain elements repeated can create association and consistency (J6 Design, 2015). Contrast emphasises key elements in the design, while space refers to the area around the other elements that creates space (J6 Design, 2015)
3.4.2 Use of Visual Imagery
It is claimed that “knowledge, attitudes and behaviours underpinning sustainability are all mediated through communication”, with visual communication playing a key role in “synthesizing complex information” (Thomsen, 2015, p. 1). The use of visual aids should be considered for three reasons. First, they may help in gaining attention and interest in a message in order for time and effort to be allocated to the remainder of the material (Lazard & Atkinson, 2014). Secondly, the use of appropriate visuals can help those who struggle to understand text-based information (Dowse, 2004) or abstract concepts (Altinay, 2015). Finally, they can “amplify the verbal portion of a persuasive message” (Seo, Dillard & Shen, 2013, p. 565), or make specific elements within a specific communication stand out (Altinay, 2015). Further, there is evidence that they can communicate more effectively than words alone (Lazard & Atkinson, 2014).
In the context of environmental impacts (including the impact of climate change), the use of iconic images that are not personally relevant and focused on local impacts or which are based on model simulations is discouraged (Thomsen, 2015). Conversely, the use of local images in climate change communication has been shown to be effective in gaining acceptance of the need for local action, and consideration of alternative courses of action (Scannell & Gifford, 2013). A caveat is that the visuals should be pre-tested to ensure that the message intended to be conveyed is that actually received rather than having the potential for miscommunication (Dowse, 2004). Visually demonstrating the link between environmental pollution causes and impact is noted as being challenging (Hansen & Machin, 2013). However, visuals can be a powerful tool for demonstrating that positive actions are possible and achievable (Altinay, 2015).
16
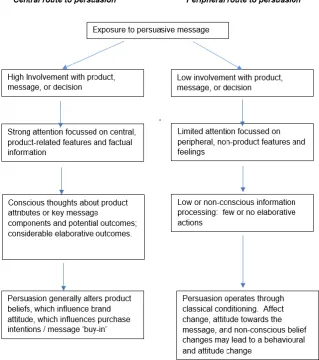
Figure 2: Elaboration Likelihood Model (adapted from Hawkins, Best, & Coney, 2001, p. 408)
4.0 PROGRAMME ANALYSIS
When selecting programmes for evaluation, we sought to ensure that we covered programmes which had been marketed within both the wet and the dry tropics, and which had been designed for both graziers and cane farmers. In addition, we sought to select programmes from different time periods (early and late), and programmes that targeted a broad (Reef Programme) and narrow (Reef Tender - Burdekin) range of issues with different philosophical
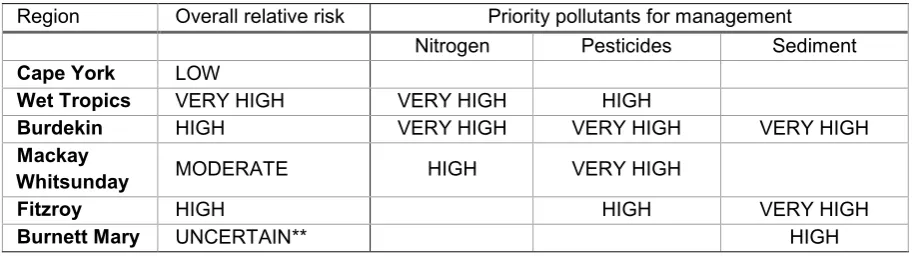
[image:28.595.350.519.78.370.2]approaches. Table 7 summarises those key characteristics. The Dry Tropics Tender, had been preceded by a Tender in the Wet Tropics (with a closing date for submissions in February 2015), and was thus thought to have contained ‘learnings’ from its predecessor. As such, the Wet Tropics Tender was not included in the Reef Trust Tender analysis. When evaluating Reef Programme, we confined our analysis to materials used within the Burdekin and the Wet Tropics, both regions having water quality identified as being at ‘very high risk’ from nitrogen pollution, and the Burdekin also identified as being at ‘very high risk’ from sediment and pesticide pollutants (Table 8).
Table 7: Key Characteristics of the Reef Trust Tender (Burdekin) and the Reef Programme
Reef Programme Reef Trust Tender (Burdekin)
Region Wet & Dry Tropics Dry Tropics
Sector Cane & Grazing Cane
Period 2008-2013 2015 – 2018
Focus Anything that could help improve
water quality Nitrogen reduction
Philosophical
approach Bottom up and extremely diverse including grants, training programmes and extension
activities. When applying for grants, land managers could develop their own ideas about what to do and what to ‘target’
Top down and tightly prescribed, in that all tenders needed to
[image:28.595.68.531.462.621.2]specifically address the issue of nitrogen
18
Table 8: Relative risk of degraded water quality to the Great Barrier Reef (Source: Brodie et al., 2013 Scientific Consensus Statement, Chapter 3)
Region Overall relative risk Priority pollutants for management
Nitrogen Pesticides Sediment
Cape York LOW
Wet Tropics VERY HIGH VERY HIGH HIGH
Burdekin HIGH VERY HIGH VERY HIGH VERY HIGH
Mackay
Whitsunday MODERATE HIGH VERY HIGH
Fitzroy HIGH HIGH VERY HIGH
5.0 ANALYSIS AND DISCUSSION
The following analysis and discussion will analyse readability and then norms and message framing including the type of appeal used (when relevant). Comments are also made on the overall experience of the information search including design and imagery where appropriate. Each section will end with a summary of findings, and conclusions and recommendations will follow.
5.1 Readability
To conduct the analysis we first address readability as if the material is written in language too complex for the intended recipients to comprehend, other factors such as message framing and tone are treated as less relevant at this point, but are addressed in Section 5.2.
Process:
A manual calculation was performed by taking three groups of 10 consecutive sentences at the beginning, middle, and end of each document, giving 30 sentences in total (adjustments were made in cases where there were less than 30 sentences, see Section 3.1.1). Following this, all words with three or more syllables within these selected sentences were counted and the square root of the total was then calculated and rounded to the nearest integer. Finally, the number 3 was added to the integer to obtain the grade level of the document. This task was performed using Trottier’s Words Count Website (http://wordscount.info/index.html) which is based on McLaughlin’s (1969) SMOG formula.
Specific aim:
The specific aim is to measure the likely reading level in terms of formal years of education by evaluating online information provided to landholders in the two associated websites in terms of basic readability required in order to comprehend the material. The two associated programmes are the Reef Trust Tender (Burdekin) and the Reef Programme (wet and dry tropics). The results of the analysis follow.
5.1.1 Reef Trust Tender (Burdekin)
The Reef Trust Tender (Burdekin) targets nitrogen discharge from the Burdekin natural resource management region. The tender offers funding to sugar cane farmers in the Burdekin NRM region to improve nitrogen and irrigation management practices on their farms. The aim of the project is to significantly lower the amount of nitrogen fertiliser applied to participating farms to meet Reef 2050 nitrogen reduction targets. For more information visit the Reef Trust Tender (Burdekin) webpage http://www.environment.gov.au/marine/gbr/reef-trust/reef-trust-tender-burdekin.
Analysis of the material on the Reef Trust (Burdekin) website was completed in two parts. Firstly, material was used from the front web page at
www.environment.gov.au/marine/gbr/reef-trust/reef-trust-tender-burdekin, Table 9 (a) and included the Reef Trust Gully Control Program
20
www.nqdrytropics.com.au/reef-trust-tender/, Table 9 (b) where NQ Dry Tropics materials related to the Reef Trust Tender were analysed.
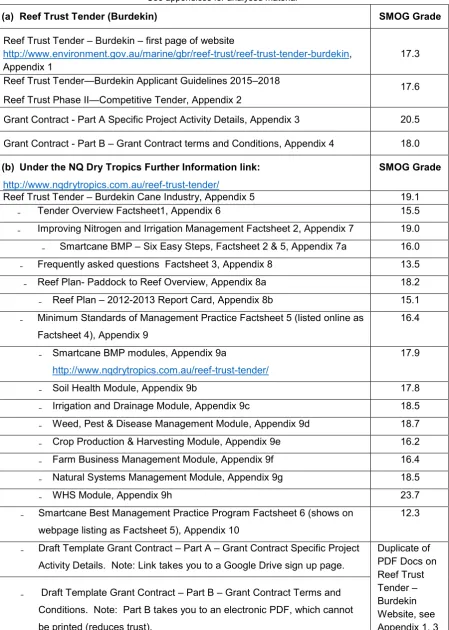
The landing page of the Reef Trust Tender Burdekin website rated between grade/year 17 and 20 for its readability score, which is well above the recommended readability level of grade/year 9, see Table 9 (a). Under the further information link, some of the fact sheets were at the better readability level of grade/year 12-13. However, the remaining documents under the further information link were written at grade/year 15 and above, which is
Table 9: SMOG analyses for material on The Reef Trust Tender (Burdekin) See appendices for analysed material
(a) Reef Trust Tender (Burdekin) SMOG Grade
Reef Trust Tender – Burdekin – first page of website
http://www.environment.gov.au/marine/gbr/reef-trust/reef-trust-tender-burdekin,
Appendix 1 17.3
Reef Trust Tender—Burdekin Applicant Guidelines 2015–2018
Reef Trust Phase II—Competitive Tender, Appendix 2 17.6
Grant Contract - Part A Specific Project Activity Details, Appendix 3 20.5
Grant Contract - Part B – Grant Contract terms and Conditions, Appendix 4 18.0
(b) Under the NQ Dry Tropics Further Information link: http://www.nqdrytropics.com.au/reef-trust-tender/
SMOG Grade
Reef Trust Tender – Burdekin Cane Industry, Appendix 5 19.1
₋ Tender Overview Factsheet1, Appendix 6 15.5
₋ Improving Nitrogen and Irrigation Management Factsheet 2, Appendix 7 19.0 ₋ Smartcane BMP – Six Easy Steps, Factsheet 2 & 5, Appendix 7a 16.0
₋ Frequently asked questions Factsheet 3, Appendix 8 13.5
₋ Reef Plan- Paddock to Reef Overview, Appendix 8a 18.2
₋ Reef Plan – 2012-2013 Report Card, Appendix 8b 15.1
₋ Minimum Standards of Management Practice Factsheet 5 (listed online as Factsheet 4), Appendix 9
16.4
₋ Smartcane BMP modules, Appendix 9a
http://www.nqdrytropics.com.au/reef-trust-tender/
17.9
₋ Soil Health Module, Appendix 9b 17.8
₋ Irrigation and Drainage Module, Appendix 9c 18.5
₋ Weed, Pest & Disease Management Module, Appendix 9d 18.7
₋ Crop Production & Harvesting Module, Appendix 9e 16.2 ₋ Farm Business Management Module, Appendix 9f 16.4
₋ Natural Systems Management Module, Appendix 9g 18.5
₋ WHS Module, Appendix 9h 23.7
₋ Smartcane Best Management Practice Program Factsheet 6 (shows on webpage listing as Factsheet 5), Appendix 10
12.3
₋ Draft Template Grant Contract – Part A – Grant Contract Specific Project Activity Details. Note: Link takes you to a Google Drive sign up page.
Duplicate of PDF Docs on Reef Trust Tender – Burdekin Website, see Appendix 1, 3 and 4
₋ Draft Template Grant Contract – Part B – Grant Contract Terms and Conditions. Note: Part B takes you to an electronic PDF, which cannot be printed (reduces trust).
22
5.1.2 Reef Trust - Gully Erosion Control Program (Burdekin)
The aim of the Reef Trust Gully Erosion Control Program is to reduce or manage fine sediment erosion from gullies into the reef catchments. The program aims to fund landholders and others to remediate high-risk gullied areas, for more information visit the Reef Trust Gully Erosion Control Program webpage. However, one point of difference is that the program targets community groups or organisations, who would work with land managers to implement the programs, rather than directly targeting land managers.
Table 10: SMOG analysis for material on the Reef Trust Gully Erosion Control Programme (Burdekin)
See appendices for analysed material
Title SMOG Grade
(c) Reef Trust Gully Erosion Control Programme – front web page
https://www.environment.gov.au/marine/gbr/reef-trust/gully-erosion-control, See Appendix 12
20.4
Reef Trust Gully Erosion Control Programme – Approved Gully Erosion Control Projects
https://www.environment.gov.au/system/files/pages/d597f340-04b3-4dfa-86eb- 5672003d4a5b/files/reef-trust-gully-erosion-control-programme-successful-projects.pdf, see Appendix 13
15.3
₋ Project 1 – 50% reduction in gully erosion from high priority sub catchments
in the Normanby, project website N/A
₋ Project 2 – Gully management in highly erodible sub-catchments of the
Mary River Catchment N/A
₋ Project 3 – Don River Catchment Sediment Reduction Project – Improving
GBR water quality N/A
₋ Project 4 – Point Source Sediment Management in the Burdekin Dry
Tropics NRM Region N/A
₋ Project 5 – Gully Remediation in the Fitzroy by Revegetation and Grazing
Land Management Application for funding N/A
N/A Gully Tool Box – A technical guide for the Reef Trust Gully Erosion Control
Programme 2015-2016,
https://www.environment.gov.au/system/files/pages/d597f340-04b3-4dfa-86eb-5672003d4a5b/files/grant-gully-toolbox.pdf, see Appendix 14
Note: This document is designed for funded groups… funded groups include community groups and organisations who would then work with land managers to implement programs
11.4
Mapping Tool Instructions – for an explanation on how to draw polygon areas for a project,
https://www.environment.gov.au/system/files/pages/d597f340-04b3-4dfa-86eb-5672003d4a5b/files/smartform-application-mapper-guide.pdf, Appendix 15
22.4
Sample Funding Agreement – Part A DRAFT
https://www.environment.gov.au/system/files/pages/d597f340-04b3-4dfa-86eb-5672003d4a5b/files/draft-funding-deed-parta.pdf, Appendix 16a
22.4
Programme Specific Terms and Conditions – Part B DRAFT
https://www.environment.gov.au/system/files/pages/d597f340-04b3-4dfa-86eb-5672003d4a5b/files/draft-funding-deed-partb.pdf, Appendix 16b
20.9
Programme Specific Terms and Conditions – Part C DRAFT
https://www.environment.gov.au/system/files/pages/d597f340-04b3-4dfa-86eb-5672003d4a5b/files/draft-funding-deed-partc.pdf, Appendix 16c
16.3
5.1.3 The Reef Programme
The Australian Government’s Reef Programme addresses the threats of declining water quality and climate change to the GBR World Heritage Area. The program has delivered funds to more than 3,200 land managers to be used for on farm water quality projects. The program has six components, which include WQ Grants and Partnerships; Systems Repair and Urban Grants; WQ Monitoring and Reporting Research and Development; Crown of Thorns Starfish; Land and Sea Country Partnerships; and the GBR Marine Park Authority. For more information, visit http://www.nrm.gov.au/national/continuing-investment/reef-programme.
24
material from the dry tropics was analysed using information from the NQ Dry Tropics Reef Programme at http://www.nqdrytropics.com.au/projects/sustainable-agriculture/, (Table 12), and thirdly, material from the Wet Tropics using information from Terrain
http://www.terrain.org.au/Projects/Wet-Tropics-Agriculture/Reef-Programme/ (Table 13).
[image:35.595.67.528.235.291.2]The SMOG analysis for Reef Programme material on the Australian Government website reveals that the material is written for a person with an education level of grade/year 17 i.e., for someone who has completed further education.
Table 11: SMOG analysis for material on the Australian Government Reef Programme See appendices for analysed material
Title SMOG Grade
(a) The Australian Government Reef Programme webpage
http://www.nrm.gov.au/national/continuing-investment/reef-programme, see appendix 17
5.1.3.1 The Reef Programme (Dry Tropics)
[image:36.595.73.524.184.593.2]Table 12 displays material from the NQ Dry Tropics link on the Australian Government webpage for the Reef Trust Tender (Burdekin), with an average SMOG grade of 12.8, it is slightly better than the government page, but was still above the recommended writing age of year/grade 9.
Table 12: SMOG analysis for material on the Australian Government Reef Programme – Burdekin Region See appendices for analysed material
Title SMOG Grade
(b) NQ Dry Tropics – Projects - Sustainable Agriculture, see Appendix 18
http://www.nqdrytropics.com.au/projects/sustainable-agriculture/
Note: the case studies below give examples of successful implementation of water quality programs
19.4
₋ Case Study – Brad Rosten, see Appendix 19 16.0
₋ Case Study – Terry Creek, see Appendix 20 16.0
₋ Case Study – Joseph Magatelli, see Appendix 21 17.2
NQ Dry Tropics – Projects & Programmes – Sustainable Agriculture – Reef Programme webpage, see Appendix 22
http://www.nqdrytropics.com.au/projects/sustainable-agriculture/reef-programme/ 15.5 Reef Programme – Sugar Cane Activities, See Appendix 23
http://www.nqdrytropics.com.au/projects/sustainable-agriculture/reef-programme/ ₋ Sugarcane innovation program: Automated irrigation field day, see
Appendix 23a
₋ Sugarcane water quality grants, see Appendix 23b
19.4
13.5 15.7 Reef Programme – Grazing Activities
http://www.nqdrytropics.com.au/projects/sustainable-agriculture/reef-programme/
₋ Erosion control field walk, see Appendix 24a ₋ Erosion control grader workshop, see Appendix 24b
12.0 14.7
NQ Dry Tropics – Projects & Programmes – Sustainable Agriculture – Grazing BMP webpage, see Appendix 25
http://www.nqdrytropics.com.au/projects/sustainable-agriculture/grazing-bmp-project/ 16.6
Grazing BMP webpage, see Appendix 26
https://www.bmpgrazing.com.au/audit/public/default.aspx 18.6 ₋ Grazing BMP Accreditation Information – Certification and Audit Assurance
Strategy, see Appendix 26a 13.8
₋ Grazing BMP Self-Assessment – Grazing Land Management, see Appendix
26b 17.9
₋ Grazing BMP Self-Assessment – Soil Health, see Appendix 26c
26
5.1.3.2 The Reef Programme (Wet Tropics)
[image:37.595.71.529.183.634.2]Table 13 displays material from the Terrain link on the Australian Government webpage for the Reef Programme (Wet Tropics), with an average SMOG grade of 13.2, it is slightly better than the Government page, but was still above the recommended writing age of year/grade 9.
Table 13: SMOG analysis for material on the Australian Government Reef Programme – Wet Tropics Region
See appendices for analysed material
Title SMOG Grade
(c) Reef Programme – Wet Tropics – Reef Programme Page
http://www.terrain.org.au/Projects/Wet-Tropics-Agriculture/Reef-Programme, Appendix 27
17.6
Click MORE on the above page:
Example text taken from Terrain Website – Paddock to reef program - Reef Water Quality Protection Plan, landing page
http://www.reefplan.qld.gov.au/measuring-success/paddock-to-reef/, Appendix 28 16.8 Example text taken from the more info – Paddock to Reef Overview
http://www.reefplan.qld.gov.au/measuring-success/paddock-to-reef/assets/paddock-to-reef-overview.pdf , see Appendix 29 17.3 Example text taken from the link - Sugarcane – Case Studies
₋ Comparing runoff loss of knockdown and residual herbicides in the Herbert catchment, http://www.reefplan.qld.gov.au/measuring-success/case-studies/case-studies-sugarcane/comparing-runoff-loss/, Appendix 30 ₋ Sub-surface fertiliser application reduces nutrient runoff in the Herbert
catchment, http://www.reefplan.qld.gov.au/measuring-success/case-studies/case-studies-sugarcane/sub-surface-fertiliser/, Appendix 31 ₋ Modelling pesticide runoff from improved land management scenarios,
http://www.reefplan.qld.gov.au/measuring-success/case-studies/assets/case-study-modelling-pesticide-runoff.pdf, Appendix 32
15.5
16.3
18.0
Example text taken from the link - Grazing – Case Studies ₋ Tracking gully activity in the Burdekin range lands,
http://www.reefplan.qld.gov.au/measuring-success/case-studies/assets/case-study-grazing-tracking-gully-activity.pdf, Appendix 33 ₋ Grazing in the Burdekin region – achieving better returns and saving soils,
http://www.reefplan.qld.gov.au/measuring-success/case-studies/assets/case-study-grazing-burdekin.pdf, Appendix 34
15.5