ON QUANTIFYING UNCERTAINTY FOR PROJECT SELECTION:
THE CASE OF A RENEWABLE ENERGY SOURCES’
INVESTMENT
Author(s) Names: Konstantinos KIRYTOPOULOS*, Athanassios RENTIZELAS**, Georgios TZIRALIS***
National Technical University of Athens, Sector of Industrial Management and Operational Research,
Heroon Polytechniou 9, Polytechnioupoli Zografou, 15780 Athens, Greece Phone: +30 210 772 2385; Fax: +30 210 772 3571;
* [email protected], ** [email protected], *** [email protected]
The selection of a project among different alternatives, considering the limited resources of a company (organisation), is an added value process that determines the prosperity of an undertaken project (investment). This applies also to the “booming” Renewable Energy Sector, especially under the circumstances established by the recent activation of the Kyoto protocol and by the plethora of available choices for renewable energy sources (RES) projects. The need for a reliable project selection method among the various alternatives is, therefore, highlighted and, in this context, the paper proposes the NPV function as one of possible criteria for the selection of a RES project. Furthermore, it differentiates from the typical NPV calculation process by adding the concept of a probabilistic NPV approach through Monte Carlo simulation. Reality is non-deterministic, so any attempt of modelling it by using a deterministic approach is by definition erroneous. The paper ultimately proposes a process of substituting the point with a range estimation, capable of quantifying the various uncertainty factors and in this way elucidate the accomplishment possibilities of eligible scenarios. The paper is enhanced by a case study showing how the proposed method can be practically applied to support the investment decision, thus enabling the decision makers to judge its effectiveness and usefulness.
Keywords: Renewable energy sources projects, Monte Carlo, Project selection, Uncertainty factors
1/ INTRODUCTION
The NPV criterion is usually calculated using point estimations for the input parameters, thus providing a single value outcome. However, this is just a possibility among many others, due to the range of values that the input parameters may take. A more complete approach, that is suggested hereafter, is to define the uncertainty factors. That is, the variables (specific costs or revenues) which take part in the NPV calculation and may receive more than one value. Having done that, the decision maker may feed the probabilistic NPV model with data according to the different available scenarios (alternatives) and come up with a probability curve for the NPV of each scenario. The tangible result is that the decision maker may now compare n curves (where n is the number of available scenarios) indicating the range of possible outcomes rather than comparing n deterministic values.
The aforementioned concept is even more important for a specific category of projects which deal with the development of “green” plants. Renewable energy sources (RES) projects present several characteristics that differentiate them from conventional projects, thus appear to be riskier. For instance, most of the RES technologies available up to now are very new and still, under development. Therefore, investment costs are not always easy to be determined with accuracy (usually they are dropping with the evolution of new technology), their actual performance usually deviates from the expected and there is a lack of expertise for managing this kind of projects. The paper focuses on this kind of projects and the method presented in the next section is used for the selection of the better, in terms of NPV (Benninga, 2000), solution among a set of different alternatives for a RES project.
Renewable energy sources include mainly the use of wind, solar, geothermal and biomass power for covering thermal, electricity, mechanical and other energy needs. Biomass has been serving humanity’s energy needs since ancient times, as prehistoric humans used wood as their first energy source. Up to now, biomass contributes the largest share of renewable energy, and it is still one of the main energy sources in many third world countries.
RES projects have been gaining significant support lately. Many governments worldwide are aiming at increasing the share of energy produced by renewable energy sources in their countries, while at the same time reducing their reliance on fossil fuels and conventional power sources. The recent ratification and activation of the Kyoto protocol has enhanced even further this trend towards increased use of RES. The target of EU for increasing the share of RES in its energy mix at 12% by the year 2010 is indicative of this trend (Commission of the European Communities, 2000).
Consequently, the collaboration of European countries and non-European ones in RES projects is quickly approaching and this papers aims to provide a method that will sort out the best, in terms of NPV, investments (projects) in this area.
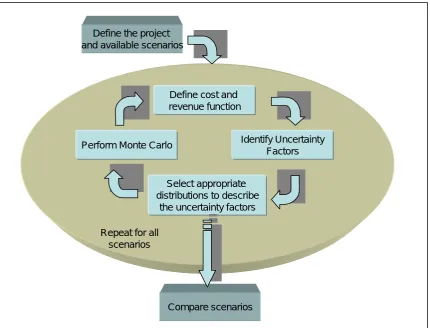
2/ METHOD
define, for each scenario, the cost and revenue function. That is, the Net Present Value function of the investment including all the input parameters (costs and revenues) needed for the determination of the final outcome.
For each scenario, uncertainty factors should be identified. These uncertainty factors are parameters that cannot be handled with a deterministic approach. Such factors may include electricity selling price, thermal energy selling price or biomass cost.
After the determination of these factors, appropriate statistical distributions describing each one of them should be defined. The selection of the appropriate distribution is a quite difficult task which depends mainly on the experience and know-how of the decision maker. However, regardless the rate of accuracy of the statistical distribution that will be used, the outcome will be better (more indicative of the real world) than the one coming from a deterministic approach.
Define the project and available scenarios
Define cost and revenue function
Identify Uncertainty Factors
Select appropriate distributions to describe
the uncertainty factors Perform Monte Carlo
Compare scenarios Repeat for all
[image:3.595.87.518.290.618.2]scenarios
Figure 1: Description of the method
possible value for each variable. However, in the real world, the possible values of a parameter are almost uncountable, therefore the potential scenarios are infinite and the possibility of realisation of each one of them equals zero. On the other hand, the MCS suggests the modelling of the range of possible values for each input variable and the following reproduction of an efficient number of scenarios, so that the depiction of the respectively big number of results in a density function diagram could attribute in a reliable manner the needed distribution of the output variable, showing in parallel the possibility of occurrence for each value and marking out extreme or probable results (Vose, 2000). In a nutshell, by performing the MCS the estimation of the Net Present Value of a RES project is not a single figure but a distribution, which aids the decision maker to the selection of the right (most cost effective) scenario. This comparison of the NPV of the alternative scenarios is the last step of the process.
Although the method has been designed for a RES project, it can be used, as it stands, for any kind of project.
3/ CASE STUDY
3.1/ Problem description
The case study concerns the selection of the best case among three possible alternatives for providing 10 MW power through the development of Combined Heat and Power (CHP) plants, which utilise biomass as their energy source (one type of seasonal agricultural residues has been assumed as “raw material”). The three scenarios refer to the Greek energy market but they could be fairly fitted to any other country if the appropriate modifications in costs were made. The available scenarios include the development of (a) ten CHP plants having an electric power capacity of 1 MW (b), two CHP plants having an electric power capacity of 5 MW and (c) one CHP plant with an electric power capacity of 10 MW. Aim of the case study is to show that although a decision maker’s first thought would be to develop the large plant, due to the prospective economy of scale, a more detailed examination through the range NPV estimation process might lead to different decisions.
A brief technical description of the project under consideration is necessary in order for the reader to understand the basic factors involved. The calculations have been based on the analytical model of Tatsiopoulos et al. (2003) as well as a relative study made by Tolis (2001).
energy coming from oil, in order to provide an incentive for the consumers of thermal energy to change their energy source (expressed by factor cpq).
This paper assumes, due to the identical scope of the available scenarios, that the NPV function could be the basic criterion of the decision maker. The same methodology has been used for other investment criteria such as the IRR or ROI but is not presented here for reasons of brevity. The NPV function is described by equation (1):
NPV= Sel + Sth – OpCost – Biompr – II (1)
Where Sel is the present value of electricity income plus income from power availability
Sel = (ckwh*Capel*TT+Capel*celp*Mel)*Dfc (2)
Sth is the present value of thermal energy income
Sth = Capel*(n1/n2 -1)*TT*Csalq*Cpq*Op*Dfc /(Θ2*n1) (3)
OpCost is the present value of operational costs
OpCost = Oper*Dfc (4)
Biompr is the present value of all costs associated with procuring biomass (Bpr is expressed in present values already)
Biompr = Bpr*WB (5)
II stands for the investment costs for the CHP unit.
For a more detailed description of each variable and its range of values please refer to Table 1. It should be mentioned at this point that the total amount of biomass required for each scenario is calculated using equation 6:
WB = N*Capel*TT/(n2*Θbiom) (6)
3.2/ Uncertainty factors
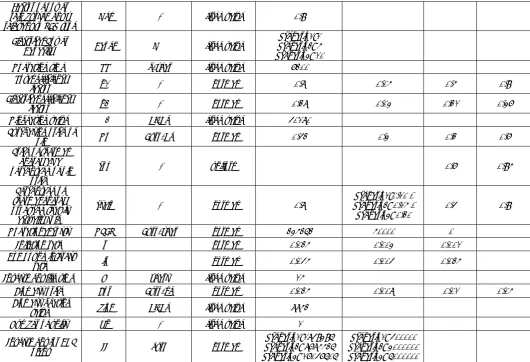
Table 1 presents the set of uncertainty factors that shape the final result. The risk that each factor will not take a predefined value (deterministic approach) is reduced by the use of a distribution which describes a set of possible values that this factor may take.
Description Symbol Unit Distribution Mean Value Deviation Standard Minimum Value Maximum Value RES Electricity
selling price ckwh euro/Kwh normal 0,06611 0,04 0,03 Power
Factor of power reimbursement –
relevant to RES type Mel - fixed value 0,9 Electrical Power
Capacity Capel MW fixed value
Scenario1:1 Scenario2: 5 Scenario3: 10
Operating time TT h/year fixed value 7200 Total efficiency
factor n1 - normal 0,8 0,05 0,5 0,9
Electrical efficiency
factor n2 - normal 0,28 0,03 0,21 0,37
Oil heating value Θ2 KJ/Kg fixed value 40180 Purchasing price of
oil Op Euro/Kg normal 0,42 0,3 0,2 0,7
Price of thermal energy as a percentage of oil
price
cpq - uniform 0,7 0,95
Percentage of thermal energy produced that is
actually sold
csalq - normal 0,8 Scenario2: 0,15 / Scenario1:0,10 /
Scenario3: 0,20 0,4 0,9
Operational costs OPER Euro/year normal 235262 50000 0 Inflation rate r % normal 0,025 0,003 0,001 Compound interest
rate ir % normal 0,045 0,004 0,025
Investment life time N years fixed value 15
Biomass price Bpr Euro/kg normal 0,025 0,008 0,01 0,05 Biomass heating
value Θbiom KJ/Kg fixed value 8852 Number of units Un - fixed value 1
Investment for CHP
plant II euro normal
[image:6.595.33.564.84.446.2]Scenario1:1849396 Scenario2: 8785526 Scenario3: 17047606 Scenario1: 400000 Scenario2: 3000000 Scenario3: 6000000
Table 1: Characteristics of distributions for each variable
For each one of the variables that were described in the previous paragraph, Table 1 provides the characteristics of the adopted statistical distribution (normal, fixed value etc. and mean, standard deviation, minimum or maximum where appropriate). These characteristics are quite difficult to be determined and usually arise from the thorough research and extensive experience of the decision maker and his/ her team. Because of this the use of peculiar distributions (other than normal and uniform) is avoided. In our case, the statistical distributions and the relative attributes that describe the uncertainty factors were specified after a brainstorming session conducted among four senior engineers with specific expertise in RES projects and the decision maker. As it can be deducted from Table 1, all the parameters that are not described by a fixed value “carry” an embedded uncertainty (risk). However, some of these parameters are not only uncertain but, moreover, differentiate for each scenario (i.e. Percentage of thermal energy produced that is actually sold).
3.3/ Monte Carlo Simulation and Results
specifications and a, respectively, extended number of results were calculated for each scenario.
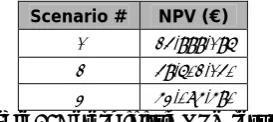
The typical method of determining deterministically the NPV of each scenario ended up to the results given in Table 2. It should be noted that the mean values of the parameters, for each scenario, was used (mean values used) and the results for scenario 1 and 2 were multiplied by 10 and 2 respectively, in order to depict that the total power supplied for any of the three scenarios would sum up to 10 MW (refer to section 3.1).
Scenario # NPV (€)
[image:7.595.231.368.206.267.2]1 24.999.196 2 49.602.140 3 53.085.590
Table 2: Deterministic NPV results
If the decision maker had to select one of the three scenarios, holding only the information provided in Table 2, he/ she would probably proposed the third solution as significantly better. However, the deterministic approach does not provide any measure of the uncertainty or risk that the investor undertakes in each occasion. For example, it does not refer at all any indication of the possibility of negative NPV or the best profitability that one could expect.
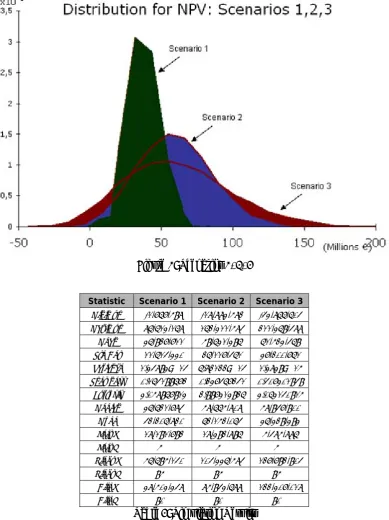
The results of the proposed probabilistic estimation by the use of the Monte Carlo Simulation ended up to the results presented in Figure 1 and Table 3. Figure presents the probability density function of the 10.000 results that occurred for scenarios 1, 2 and 3 by the use of a common scale, supports the comparative view of the distributions. Table 3 apposes various descriptive measures for the occurred distributions.
The major advantage of the proposed method is the richer (comparing to the deterministic approach) information provided to the decision maker. The decision maker is now able to modulate his selection by taking into consideration more that one strategic objectives. For example, he could select the option that performs better in an algorithm such as the following:
(LeftX) (Median) (RightX
M α β γ )
α β γ
× + × + ×
=
+ + (7)
where α,β & γ are numbers that quantify the strategic objectives (for example a big value for α shows a risk averse tendency, while a big value for γ gives preference to scenarios with possible very high profits).
Figure 1: Scenarios 1, 2, 3
Statistic Scenario 1 Scenario 2 Scenario 3 Minimum -1.767.598 -18.883.582 -43.866.604 Maximum 86.613.168 162.311.584 211.369.488 Mean 36.927.711 59.631.396 61.523.469 Std Dev 11.614.330 26.117.461 37.200.761 Variance 1,34893E+14 6,82122E+14 1,3839E+15 Skewness 0,164199672 0,237467241 0,407301949
Kurtosis 3,058967913 2,997313926 3,063140915 Median 36.621.784 58.665.808 58.947.900
Mode 42.206.820 62.152.064 36.329.393 Left X 18.191.792 18.392.896 5.485.886
Left P 5% 5% 5%
Right X 56.695.140 104.336.584 127.792.904
Right P 95% 95% 95%
Diff X 38.503.348 85.943.688 122.307.018
Diff P 90% 90% 90%
Table 3: Simulation Results
4/ CONCLUSION
The project selection process takes place prior to the project initiation face and one may claim that it is out of the boundaries of the project and should be dealt with by the senior management only. But who would be better to take part in the selection process than the project manager who is going to be asked to execute the project, right afterwards? The authors of this paper believe that the project management professional should always aid the senior management team to take the decision about which is the better alternative, in case there are more than one options. An experienced project manager is the one who better knows the uncertainty factors and the one who may provide the most reliable data for the description of the associated statistical distributions.
The RES project selection case study revealed that a probabilistic approach may alter the verdict of a decision maker due to the provision of richer information. Even if one had no alternatives at all, the use of a probabilistic approach would be of significant value, as it would reveal the level of accuracy of the deterministic value approach, through the estimation of the standard deviation of the final curve (no matter what the criterion would be – NPV, IRR or ROI).
The paper attempted to make clear that, using the proposed probabilistic method through Monte Carlo Simulation, the quantification of uncertainty factors that co-shape the decision criteria (in the presented case study the NPV function) of a project is feasible and the risk that each decision bears is statistically defined in a compatible with the strategic objectives way, that may lead to results that are different from those proposed by the traditional deterministic methods.
The method provided would be of specific benefit to the selection of the RES projects that are going to be developed in the near future, as a result of the activation of the Kyoto protocol.
5/ REFERENCES
[1] Benninga S., Financial Modelling, The MIT Press, 2000.
[2] Commission of the European Communities, “Green Paper: Towards a European Strategy for the Security of Energy Supply”, Brussels, 2000.
[3] Heldman K., PMP: Project Management Professional Study Guide, Sybex, 2002. [4] Hillson D. (2004) “Effective Opportunity Management for Projects: Exploiting Positive Risk”, Marcel Dekker.
[5] Kerzner H., Project Management: A Systems Approach to Planning, Scheduling, and Controlling, John Wiley & Sons, 2003.
[6] Kirytopoulos K., Leopoulos V. and Malandrakis C., “Risk Management: A powerful tool for improving efficiency of project oriented SMEs”, proceedings of the 4th SMESME International Conference, Denmark, 2001, pp. 331-339.
[7] PMI, “A Guide to the Project Management Body of Knowledge”, Project Management Institute, USA, 2003.
[9] Tolis A., Reverse Logistics Application on Energy Recovery from Biomass, PhD Thesis, National Technical University of Athens, 2001.
AUTHORS’ PROFILE
Dr. Konstantinos KIRYTOPOULOS holds a Mechanical Engineering Diploma (Bachelor plus MSc equivalent) and a PhD on Project Risk Management. He is specialised in Industrial Management and is currently occupied as a Lecturer in the Aegean University (Greece), an external scientific associate of the National Technical University of Athens and as a freelance consultant. His main research interests are Risk Management in the Bidding Process, as well as Project Risk Management. He has participated in major risk management projects and has already published a significant amount of papers at International Conferences and Journals. He has also won a distinction from the Technical Hellenic Chamber for his outstanding performance during the last year of his graduate studies.
Mr. Athanassios RENTIZELAS holds a Mechanical Engineering Degree from the National Technical University of Athens (NTUA), and an MSc in Operations Management with distinction from UMIST, Manchester, UK. He is currently a PhD Candidate in the Industrial Management & Operational Research Sector of NTUA Mechanical Engineering School. His research interests and expertise lie in the areas of supply chain management, logistics, renewable energy sources, investment analysis, optimization and quality management. He has been awarded various academic awards for his exceptional performance during his studies, as well as scholarships for postgraduate studies.