Int. J. Electrochem. Sci., 14 (2019) 3792 – 3804, doi: 10.20964/2019.04.03
International Journal of
ELECTROCHEMICAL
SCIENCE
www.electrochemsci.org
Sensitive Determination of Anticancer Drug Methotrexate Using
Graphite Oxide-Nafion Modified Glassy Carbon Electrode
Deqian Huang1,2,*, Hai Wu1,2, Yuyang Zhu1,2, Huijuan Su1,2, Hong Zhang1,2, Liangquan Sheng1,2, Zhaodi Liu1,2, Huajie Xu1,2, and Chongfu Song1,2
1 School of Chemistry and Material Engineering, Fuyang Normal University, Anhui, Fuyang,
236037, P. R. China
2 Anhui Provincial Key Laboratory for Degradation and Monitoring of Pollution of The Environment,
Fuyang Anhui 236037, P. R. China
*E-mail: [email protected]
Received: 28 November 2018 / Accepted: 15 January 2019 / Published: 10 March 2019
In this paper, a graphite oxide-Nafion-glassy carbon electrode (GO-Nafion-GCE) by coating method was fabricated and used for study the electrochemical behavior and measurement of methotrexate (MTX) by cycle voltammetry (CV). The influence factors, such as volume of modifier, type of supporting electrolyte, concentration of electrolyte, scan rate, preconcentration time, and preconcentration potential on the anodic peak current of MTX were examined. The experimental results indicated that the electrode process is an adsorption-diffusion mixed controlled process. Under the experimental conditions of research, the anodic peak current of MTX shows a linear relationship within concentration range of 4.0 × 10⁻⁷‒2.0 × 10⁻⁵ mol L–1. The linear relationship can be expressed with the equation of Ip,a(μA) = (0.4739 ± 0.0086)C(μM) + (0.2885 ± 0.0434). Under the optimum
electrochemical experimental conditions, the limit of detection (LOD) can be calculated to be 9.0 × 10–
9 mol L–1 (S/N=3). The proposed method has been used for the detection of MTX in methotrexate
injection and urine samples successfully.
Keywords: anticancer drug; methotrexate; graphite oxide-Nafion; determination
1. INTRODUCTION
lung cancer [7], malignant lymphoma [8], etc. However, due to its great toxic effect on cell rapid divisions, it can repress the growth and proliferation of noncancerous cells and lead to serious side effects containing myelosuppression [9], pulmonary fibrosis [10], interstitial pneumonia, small vasculitis and high teratogenicity [11,12]. Accordingly, the development of a simple, reliable, rapid, cheap and sensitive detection method for MTX is of great significance.
Several analytical strategies have been used for the determination of MTX, containing spectrophotometric [13], fluorimetry [14‒16], capillary electrophoresis (CE) [17,18], ion chromatography (IC) [19], high performance liquid chromatography (HPLC) [20,21], and liquid chromatograph-mass spectrometer [22,23]. Although these methods have the superiorities in high sensitivity and high accuracy, they usually require cumbersome pretreatment or complex pre-separation procedures and lead to increase of the cost and time of detection [24]. However, electrochemical detection methods have been paid close attention in virtue of their advantages of cheapness, sensitivity, simplicity, accuracy and potential of on-spot application [25]. Based on this, electrochemical methods can provide rapid and sensitive analytical performance due to their relatively inexpensive of instruments and the potential of miniaturization for MTX determination [26]. Electrochemical behavior and the measurement of MTX were researched employing different sensors, including hanging mercury drop electrode (HMDE) [27,28] and silver solid amalgam electrode [26]. However, with the increasing awareness of environmental protection, the applications of mercury electrode were reduced due to its high toxicity. The determination of MTX were reported using various modified electrodes [29–38] by cyclic voltammetry (CV) [24,29], chronoamperometry (CA) [32], square wave voltammetry (SWV) [29,30,36,37], or differential pulse voltammetry (DPV) [24‒ 26,31,32,34, 35,38] for MTX determination. Patel et al. [39] reviewed the determination of MTX based on bioanalytical methods.
Graphite oxide (GO), also called graphite acid, belongs to a part of carbon-based nanomaterials with layered structure. It has wide applications for adsorption materials [40], supercapacitor 41], sensors [42‒44], and so on. GO is usually prepared by treated with strong acid and then oxidized by strong oxidant, for instance potassium permanganate [40,45]. The treated process enables GO to obtain hydroxyl, carboxyl and epoxides, and link to its layers by covalent bonding, which makes GO can extensively disperse in water [42]. The existence of these oxygen-containing functional groups can result in different polar substances be easily embedded between their layers, thus forming a graphite oxide intercalated composite [46].
Sulfonated tetrafluoroethylene (Nafion) is a fine ion exchange fluoropolymer, which has high chemical, electrochemical, thermal stability, and favourable biocompatibility of unique ionic properties [47], which has received a considerable attentions due to its application to fuel cells [48], electrochemical sensors [49‒51], and so on.
2. EXPERIMENTAL
2.1. Apparatus and reagents
The electrochemical experiment was performed with a CHI 660D electrochemical workstation (Chenhua Instruments in Shanghai, PR China). The conventional three-electrode system was employed for the whole electrochemical determination experiment, including a GO-Nafion-GCE or a bare GCE (d=3 mm), a platinum wire auxiliary electrode (PWAE) and a saturated calomel reference electrode (SCE) [52], respectively. HPLC (Waters 1525, USA) with a UV/Vis detector (Waters 2489, USA) and a chromatographic column (WATERS 4.6×150 mm, 5 μm) at a wavelength of 306 nm was used for the determination of MTX. Other conditions were used as ref. [31].
MTX (Aladdin reagent Co., Ltd., Shanghai, P.R. China) was prepared daily by dissolving of MTX in 0.1 mol L‒1 sodium hydroxide, and stocked at 4 ˚C of refrigerator. Methotrexate injection was obtained from Pfizer. NYSE: PFE. Other reagents (Shanghai Chemicals Co., Ltd., Shanghai, P.R. China) were at least of analytical reagent and used as received unless otherwise stated. All solutions were prepared in double deionized water. The whole experiments were in progress at approximately 25 ˚C.
2.2. Fabrication of graphite oxide
The preparation of GO was in accordance with the approach of reference [45]. The detailed procedures are as follows: 23 mL of concentrated sulphuric acid was cooled to about zero using ice water mixed bath, then 1 g of graphite powder and 3 g of potassium permanganate was added slowly under the condition of intense stirring and kept the temperature is not more than 20 ℃. After mixing and homogenization, the mixture was put in the 35 ℃ water baths to react for 2 h, then 46 mL of double deionized water was added and maintained the system temperature was ≤ 98 ℃ and agitated for 15 min. After this, 140 milliliters of double deionized water and 10 milliliters of 30% H2O2 were
added in turn and filtered when it is still hot. The filter cake was washed until SO42‒ was not detected
in the filtrate using 1 mol L‒1 of HCl, and then washed to neutral with double deionized water, afterwards the sample was desiccated under conditions of vacuum for 12 hours.
2.3. Fabrication of GO-Nafion-GCE
Scheme 1. Schematic diagram of GO-Nafion-GCE preparation process and determination of MTX.
2.4. Procedure
10 milliliter of supporting electrolyte and a given volume of MTX standard solution or real samples were mixed uniformly an electrolyte cell, and the cyclic voltammograms were recorded in the range of 0.5‒1.2 V under the conditions of concentration. The concentration of MTX was calculated through the Ip of MTX in the absence and presence of MTX. The data was processed with Excel 2010
and Origin 6.0 software.
3. RESULTS AND DISCUSSION
3.1 The electrochemical behavior of MTX
1.3 1.2 1.1 1.0 0.9 0.8 0.7 0.6 0.5 0.4
-20 -15 -10 -5 0 5
b a
I
/
A
[image:5.596.160.431.78.286.2]E/V vs SCE
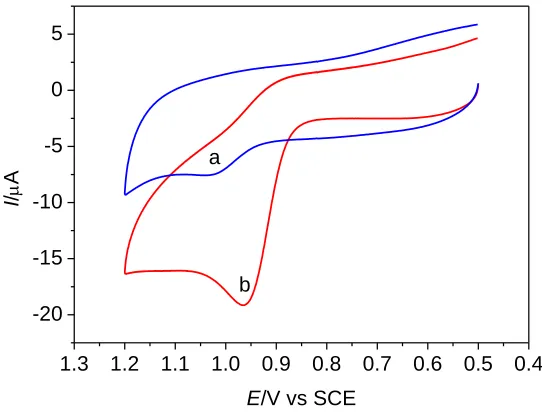
Figure 1. CV plots of methotrexate (5.0 × 10⁻⁵ mol L–1) at a bare GCE surface (a) and a GO-Nafion-GCE (b) in 0.03 mol L–1 perchloric acid at scan rate of 0.1 V s–1. Preconcentration time: 120 s.
Scheme 2. Schematic illustration of electrochemical reaction mechanism of MTX at GO-Nafion-GCE surface.
3.2 Influence of supporting electrolyte
1.3 1.2 1.1 1.0 0.9 0.8 0.7 0.6 0.5 0.4
-25 -20 -15 -10 -5 0 5 10 0 2 4 6 8 10 12 14 16 18 HClO4 H2SO4 NaOH PBS Ip / A
Support electrolyte type
Curr
ent
/
A
[image:6.596.162.430.86.288.2]Potential/V vs SCE
Figure 2. CV curves of MTX (5.0 × 10⁻⁵ mol L–1) in different supporting electrolytes. Inset: Bar graph between peak currents of MTX and the type of supporting electrolytes.
3.3 Influence of supporting electrolyte concentration
The effect of perchloric acid concentration on the CV peak current of MTX was researched. It can be seen clearly (Fig. 3) that the CV peak current is increased obviously with the addition of perchloric acid concentration, and the electrochemical response of MTX is maximizing as the concentration of perchloric acid is 0.03 mol L‒1. Therefore, the followed experiments were performed in 0.03 mol L–1 perchloric acid solution.
1.2 1.1 1.0 0.9 0.8 0.7 0.6 0.5
-20 -15 -10 -5 0 5
0.00 0.05 0.10 0.15 0.20 4 6 8 10 12 14 Ip / A
cHClO4/mol L-1
e d b c a I / A
E/V vs SCE
Figure 3. CV curves of MTX (5.0 × 10⁻⁵ mol L–1) in different concentrations of perchloric acid. 𝑐HClO4: 0.01, 0.03, 0.05, 0.1, and 0.2 mol L
–1. Inset: The Plot of I
[image:6.596.168.426.489.687.2]
3.4. Influence of scan rate
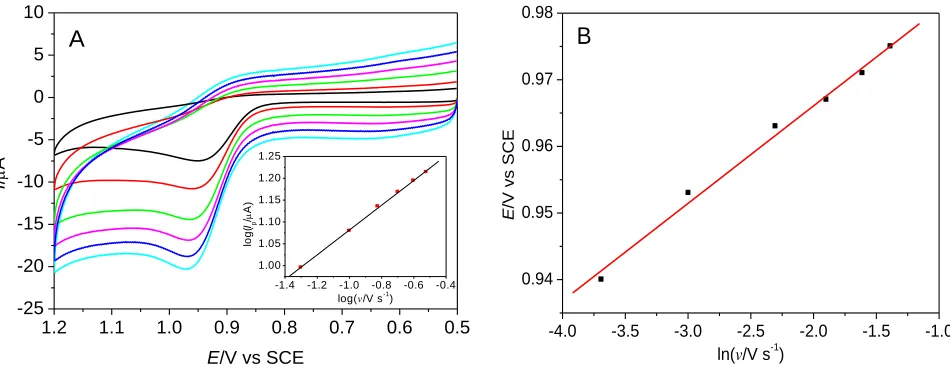
In order to make further efforts to inspect the electrochemical reaction mechanism of MTX at the GO-Nafion-GCE surface, the impact of scan rate was investigated. Fig. 4 indicates the CV superposition graphs of MTX at different scan rates within 0.025‒0.25 V s–1. Obviously, the oxidation peak currents are increased with enhancing of scan rates. However, the oxidation peak currents of MTX are neither increased linearly with scan rates nor with the square root of scan rates, which indicated that the electrode process is neither a diffusion-controlled process nor an adsorption-controlled process but by some kinetic reaction [25]. Fig.4A and inset indicate that the logarithm of anodic peak currents is linearly proportional to the logarithm of the scan rates between 0.025 and 0.25 V s‒1, and the linear regression equation is log(Ipa/μA) = 0.333log(v/V s‒1) + 1.40 (r=0.9980).
According to the slope of regression equation, the result shows that the electrode process is a kinetic-controlled process by diffusion, which agreed with the result that at the boron-doped diamond electrode [25]. If the electrode process is an adsorption-diffusion mixed controlled process, the relationship between peak currents of MTX and scan rates can be presented with equation (1):
Ip/µA = k1(v/V s–1)1/2 + k2(v/V s–1) + k3 (1)
1.2 1.1 1.0 0.9 0.8 0.7 0.6 0.5
-25 -20 -15 -10 -5 0 5 10 A
-1.4 -1.2 -1.0 -0.8 -0.6 -0.4 1.00 1.05 1.10 1.15 1.20 1.25 lo g ( Ip / A)
log(v/V s-1 )
I
/
A
E/V vs SCE
-4.0 -3.5 -3.0 -2.5 -2.0 -1.5 -1.0
0.94 0.95 0.96 0.97 0.98 B E /V vs SCE
[image:7.596.61.536.356.540.2]ln(v/V s-1)
Figure 4. CV curves of MTX (5.0 × 10⁻⁵ mol L–1) at different scan rates (A), and the plot between Ep
and lnv (B). Scan rate: 0.025, 0.05, 0.1, 0.15, 0.2, 0.25 V s–1. Buffer: 0.03 mol L–1 perchloric acid. Inset A: The plot between logIp of MTX and logv.
Through the regression analysis of Excel, k1 = 44.2 (P=0.00048), k2 =‒ 30.2 (P=0.000045) and
k3 = 1.07 (P=0.0096) can be obtained with a correlation coefficient of 0.9999, respectively. By
substituting the above coefficient into equation (1), the regression equation Ip/µA=44.2(v/V s‒1)1/2 ‒
30.2(v/V s‒1) + 1.07 can be obtained, which further demonstrates that the oxide process is an adsorption-diffusion mixed controlled process [53].
The effect of scan rates on the peak potentials of MTX was also considered using GO-Nafion-GCE. It is clearly (Fig. 4B) that the Ep shows a linear relationship with lnv as the scan rates between
0.025 V s–1 and 0.25 V s–1. The linear regression equation is Epa = 0.0146lnv + 0.995, r=0.9957, which
processes controlled by adsorption, the relationship between Epa and v can be expressed by Laviron’s
equation.
v nF RT nF RTk nF RT E
E ο ln s ln
pa = − +
(2)
Where Eo is formal standard potential, α is charge transfer coefficient, n is electron transfer numbers, and ks is standard electron transfer rate constant. R, T and F have their common meaning. on
the basis of the slope and the intercept of Ep=0.046lnv + 0.995, the straight line of peak potential (Ep)
against lnv of equation (2), αn = 1.60 can be gained. The number of electrons involved in the electrode process can be counted according to the equation (3).
RT nFQv RT
ΓAv F n I
4 4
2 2
p = =
(3)
Ip, Γ, A, and Q are peak current (amperes) of MTX, the total concentration of reaction
substance (mol·cm‒2), the electrode area (cm2), and the peak area of cyclic voltammogram (coulomb), respectively. F is the Faraday constant, and n is the number of electrons transferred. R and T have the same meanings as equation (2). The equation (3) demonstrates that the electron transfer numbers n can be computed provided Q is gained at a certain scan rate. The relationship between Ip and v is in accord
with equation (1) within 0.025‒0.25 V s‒1, meaning that the peak currents of MTX is not only related with scan rate but also the square root if scan rate. However, the electron transfer number (n) was calculated as 1.63, 1.53, 1.59 1.54, 1.51 and 1.70 as the scan rates are 0.025, 0.05, 0.1, 0.15, 0.2 and 0.25 V s‒1, respectively, indicating that 2e was involved. Hence, α=0.88 can be obtained. Identically, E0=0.937 V can be gained from the intercept of Ep versus v plot on longitudinal coordinates by
extrapolating the line to be v = 0 [37], and the value of ks of 1.29 s–1 was counted accordance with the
intercept of the straight line of Ep‒lnv.
3.5. Influence of concentration potential
The effect of accumulation potential on the oxidation peak current of MTX (5.0 × 10‒5 mol L‒1) was performed. The results demonstrated that the accumulation potential has a little effect as the accumulation potentials between ‒0.2 and 0.2 V. At more positive or negative potentials, a decrease of anodic peak current was observed. Thus, the determination of MTX was accumulated under the condition of open circuit.
3.6. Influence of concentration time
Accumulation is generally an effective means to augment the peak current of determination. The impact of concentration time on the Ip of MTX (5.0 × 10‒5 mol L‒1) was investigated. The peak
3.7. Repeatability and detection limit
For the sake of inspecting the repeatability of the GO-Nafion-GCE, the experiments of repeatability were performed in 0.03 mol L–1 perchloric acid. The RSD (n=8) is 0.8 % for 5.0 × 10⁻⁵ mol L–1 of MTX, which indicates that the GO-Nafion-GCE exhibits good repeatability. The limit of detection (LOD) is 9.0 × 10⁻⁹ mol L–1 (LOD=3S/N).
3.8. Interference experiment
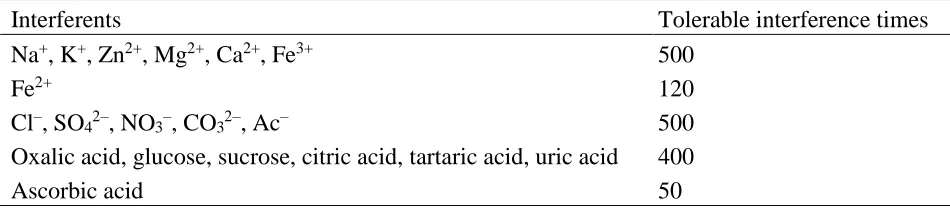
For the potential analytical application of the GO-nafion-GCE, the influence of various interfere species that possible existence in biological samples were assessed for 50 µmol L‒1 of MTX. The tolerance times of foreign species were considered as interference provided the electrochemical signal (Ip) of MTX arising a relative error ˃ ± 5%. The results of the interference test are shown in
[image:9.596.50.525.364.470.2]Table 1. All the results suggested that the GO-Nafion-GCE has high selectivity for determination of MTX.
Table 1. Maximum tolerable times for 5.0 ×10⁻⁵ MTX of some interferents.
Interferents Tolerable interference times
Na+, K+, Zn2+, Mg2+, Ca2+, Fe3+ 500
Fe2+ 120
Cl–, SO42‒, NO3‒, CO32‒, Ac‒ 500
Oxalic acid, glucose, sucrose, citric acid, tartaric acid, uric acid 400
Ascorbic acid 50
3.9. Calibration curve
Fig. 5 shows the CV superposition figures of different concentrations of MTX. Obviously, the anodic peak current of MTX is enhanced gradually with increasing of MTX concentration. The anodic peak current shows a linear relationship with MTX concentration from 4.0 × 10⁻⁷ to 2.0 × 10⁻⁵ mol L–1 with a linear regression equation of Ip,a(μA) = (0.4739 ± 0.0086)C (μM) + (0.2885 ± 0.0434) (r =
0.9985). The limit of detection (LOD) can be calculated as 9.0 × 10⁻⁹ mol L−1 according to LOD = 3sb/N defined by IUPAC [7], which is more lower than that at some of modified electrodes as indicated
3.10. Determination of MTX in methotrexate injection and urine
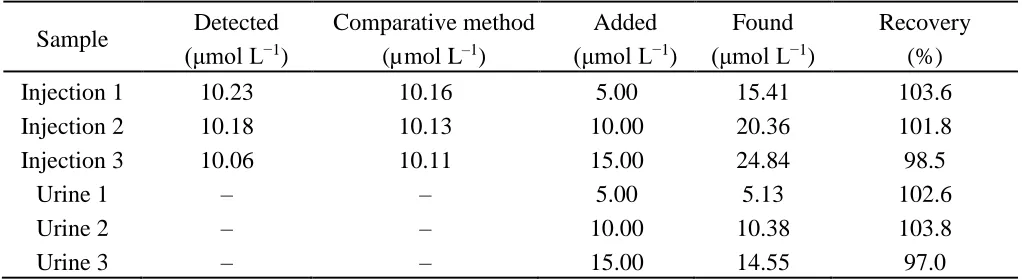
Under the selected conditions, the GO-Nafion-GCE was used to measure MTX in methotrexate injection and urine by standard addition method. The determination steps are as follows: a given volume of methotrexate injection or urine was transferred using a microinjector and added into 10 mL 0.03 mol L−1 perchloric acid solution. After the solution was mixed, the CV curves were recorded, and then different volumes MTX standard solution was added. The total MTX concentration detected in methotrexate injection is 24.86 ± 0.23 mg mL‒1, and in accordance with the nominal content of 50 mg 2 mL‒1. The results were compared with that obtained by HPLC (α=0.05) in the case described in Apparatus and reagents section (Table 3), which indicated that the proposed method is reliable in the determination of MTX in methotrexate injection and urine.
1.3 1.2 1.1 1.0 0.9 0.8 0.7 0.6 0.5 0.4
-12 -10 -8 -6 -4 -2 0 2 4
k a
0 5 10 15 20
0 2 4 6 8 10
Ip
/
A
CMTX/mol L-1
I
/
A
E/V vs SCE
[image:10.596.174.422.255.449.2]Figure 5. CV curves changed with MTX concentration. Buffer: 0.03 mol L–1 perchloric acid. Scan rate: 0.1 V s–1. Inset: The linear relationship between current responses and MTX concentration. a→k: 0.4, 1.0, 2.0, 4.0, 6.0, 8.0, 10, 12.5, 15, 17, and 20 µmol L–1.
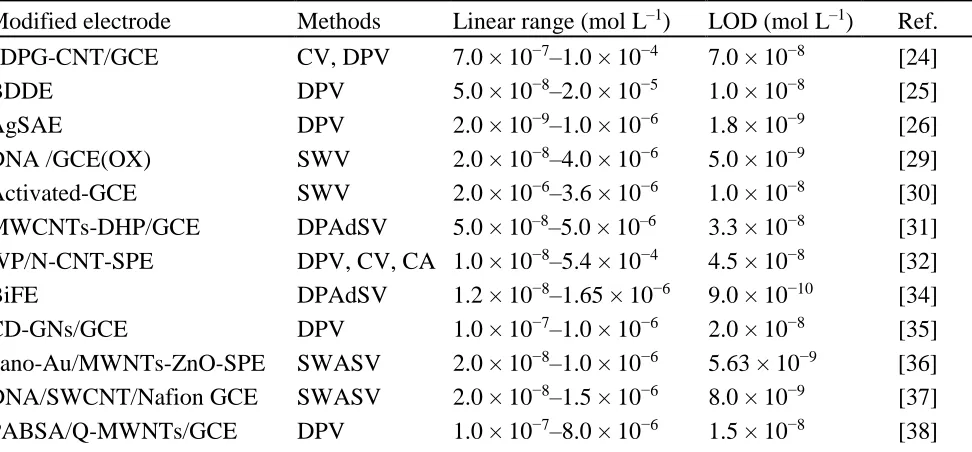
Table 2. Comparison of GO-Nafion-GCE with other sensors for the determination of MTX.
Modified electrode Methods Linear range (mol L–1) LOD (mol L–1) Ref. 3DPG-CNT/GCE CV, DPV 7.0 × 10⁻⁷–1.0 × 10⁻⁴ 7.0 × 10⁻⁸ [24]
BDDE DPV 5.0 × 10⁻⁸‒2.0 × 10⁻⁵ 1.0 × 10⁻⁸ [25]
AgSAE DPV 2.0 × 10⁻⁹–1.0 × 10⁻⁶ 1.8 × 10⁻⁹ [26]
DNA /GCE(OX) SWV 2.0 × 10⁻⁸–4.0 × 10⁻⁶ 5.0 × 10⁻⁹ [29]
Activated-GCE SWV 2.0 × 10⁻⁶–3.6 × 10⁻⁶ 1.0 × 10⁻⁸ [30]
MWCNTs-DHP/GCE DPAdSV 5.0 × 10‒8‒5.0 × 10‒6 3.3 × 10⁻⁸ [31] WP/N-CNT-SPE DPV, CV, CA 1.0 × 10⁻⁸–5.4 × 10⁻⁴ 4.5 × 10⁻⁸ [32]
BiFE DPAdSV 1.2 × 10⁻⁸–1.65 × 10⁻⁶ 9.0 × 10⁻¹⁰ [34]
CD-GNs/GCE DPV 1.0 × 10⁻⁷–1.0 × 10⁻⁶ 2.0 × 10⁻⁸ [35]
[image:10.596.59.545.537.763.2]
GO-Nafion-GCE CV 4.0 × 10⁻⁷–1.5 × 10⁻⁵ 9.0 × 10⁻⁹ This work
[image:11.596.43.554.218.358.2]SPE: screen·printed electrode; 3DPG-CNT: 3D porous graphene-carbon nanotube; BDDE: boron-doped diamond electrode; m-AgSAE: silver solid amalgam electrode; DHP: dihexadecyl hydrogen phosphate; BiFE: Bismuth film modified electrode; CD-GNs: Cyclodextrin-graphene hybrid nanosheets; nano-Au/LC: Nano-Au/L-cysteine; PABSA/Q: p-aminobenzene sulfonic·acid/ quaternary amine; PSA: Potentiometric stripping analysis; ABSA: p-aminobenzene sulfonic acid.
Table 3. Determination results of MTX in methotrexate injection and urine (n=3).
Sample Detected (μmol L−1
)
Comparative method (µmol L‒1)
Added (μmol L−1
)
Found (μmol L−1
)
Recovery (%)
Injection 1 10.23 10.16 5.00 15.41 103.6
Injection 2 10.18 10.13 10.00 20.36 101.8
Injection 3 10.06 10.11 15.00 24.84 98.5
Urine 1 ‒ ‒ 5.00 5.13 102.6
Urine 2 ‒ ‒ 10.00 10.38 103.8
Urine 3 ‒ ‒ 15.00 14.55 97.0
‒No found
4. CONCLUSIONS
In the present work, GO-Nafion-GCE was prepared and applied to determine MTX in methotrexate injection and urine successfully. The GO-Nafion modified GCE was extremely appropriate and effective for MTX determination in real samples. The recoveries are from 97.0 % to 103.8 % using the proposed method. Since GO-Nafion-GCE provides a cheap and appreciable repeatability, it may offer a potential on-spot application for clinical diagnosis.
ACKNOWLEDGEMENTS
This work is supported by Natural Science Foundation of Colleges and Universities in Anhui Province (2014KJ024), Fuyang Municipal Government -- Fuyang Normal College Horizontal Cooperation Major Project (XDHX201701) and Key Project (XDHX2016009), Innovation Team of Modern Analytical Technologies (kytd201701), and State Key Laboratory of Analytical Chemistry·for Life Science (SKLACLS1712).
References
1. S. Farber, L.K. Diamond, R.D. Mercer, R.F. Sylvester and J.A. Wolff, N. Engl. J. Med., 238 (1948) 787–793
2. M. Levitt, M.B. Mosher, R.C. Deconti, L.R. Farber, R.T. Skeel, J.C. Marsh, M.S. Mitchell, R.J. Papac, E.D. Thomas and J.R. Bertino, Cancer Res., 33 (1973) 1729–1734.
4. H.K. Ahn, B. Han, S.J. Lee, T. Lim, J.M. Sun, J.S. Ahn, M.J. Ahn and K. Park, Lung Cancer, 76
(2012) 253‒254.
5. D. Cameron, J.P. Morden, P. Canney, G. Velikova, R. Coleman, J. Bartlett, R. Agrawal, J. Banerji, G. Bertelli and D. Bloomfield, Lancet Oncol., 18 (2017) 929‒945.
6. H. Park, D.H. Yoon, Y. Song, H. Kim, Y. Huh, S. Kim, S. Jang, C.J. Park, H.S. Chi, C.S. Park, J. Huh, S.W. Lee and C. Suh, Blood, 118 (2011) 698‒699.
7. E.E. W. Cohen, L.F. Licitra, B. Burtness, J. Fayette, T. Gauler, P.M. Clement, J.J. Grau, J.M. del Campo, A. Mailliez and R.I. Haddad, Ann. Oncol., 28 (2017) 2526‒2532.
8. J.T. Sandlund, C.H. Pui, H. Mahmoud, Y. Zhou, E. Lowe, S. Kaste, L.E. Kun, M.J. Krasin, M. Onciu, F.G. Behm, R.C. Ribeiro, B.I. Razzouk, S.C. Howard, M. L. Metzger, G.A. Hale, R. Rencher, K. Graham and M.M. Hudson, Ann. Oncol., 22 (2011) 468‒471.
9. X.N. Wei, D.H. Zheng, Y.O. Mo, J.D. Ma, Y.L. Chen and L. Dai, Ann. Rheum. Dis., 76 (2017) 279‒280.
10. M. Ohbayashi, S. Kubota, A. Kawase, N. Kohyama, Y. Kobayashi and T. Yamamoto, J. Toxicol. Sci., 39 (2014) 319‒330.
11. J.E. Gach, R.A. Sabroe, M.W. Greaves and A.K. Black, Br. J. Dermatol., 145 (2001) 340–343. 12. D.M. Sandoval, G.S. Alarcon and S.L. Morgan, Br. J. Rheumatol., 34 (1995) 49–56.
13. C.S.P. Sastry and J. Rao, Anal. Lett. 29 (1996) 1763–1778.
14. S. Chen, Z. Zhang, D. He, Y. Hu and H. Zheng, Luminescence, 22 (2007) 338–342. 15. S.M. Chen and Z.J. Zhang, Spectrochim. Acta A, 70 (2008) 36–41.
16. A. Espinosa-Mansilla, I.Durán Merás, A. Zamora Madera, L. Pedano and C. Ferreyra, J. Pharm. Biomed. Anal., 29 (2002) 851‒858.
17. Z. Szakacs and B. Noszai, Electrophoresis, 27 (2006) 3399–3409.
18. J. Rodriguez Flores, G. Castaneda Penalvo, A. Espinosa Mansilla and M.J. Rodriguez Gomez, J. Chromatogr. B, 819 (2005) 141‒147.
19. Z.Y. Zhu, H.W. Wu, S.C. Wu, Z.P. Huang, Y. Zhu and L.L. Xi, J. Chromatogr. A, 1283 (2013) 62–67.
20. S.P. Fang, C.P. Lollo, C. Derunes and M.J. LaBarre, J. Chromatogr. B, 879 (2011) 3612–3619. 21. K. Michaila and M.S. Moneeb, J. Pharm. Biomed. Anal., 55 (2011) 317–324.
22. D. Wu, Y.X. Wang, Y. Sun, N. Ouyang and J. Qian, Biomed. Chromatogr., 29 (2015) 1197–1202. 23. I. Rodin, A. Braun, A. Stavrianidi and O. Shpigun, J. Chromatogr. B, 937 (2013) 1–6.
24. E. Asadian, S. Shahrokhian, A.I. Zad and F. Ghorbani-Bidkorbeh, Sens. Actuators B, 239 (2017) 617–627.
25. R. Selesovsk, L. Jankov-Bandzuchov and J. Chylkov, Electroanalysis, 27 (2015) 42 –51. 26. R. Selesovska, L. Bandzuchova and T. Navratil, Electroanalysis, 23 (2011) 177–187. 27. J. Wang, P. Tuzhi, S. Meng and T. Tapia, Talanta, 33 (1986) 707‒712.
28. B.X. Ye, S. Qu, F. Wang and L. Li, J. Chin. Chem. Soc., 52 (2005) 1111‒1116. 29. F. Wang, Y.J. Wu, J.X. Liu and B.X. Ye, Electrochim. Acta, 54 (2009) 1408–1413. 30. L. Gao, Y.J. Wu, J.X. Liu and B.X. Ye, J. Electroanal. Chem., 610 (2007) 131–136.
31. G.G. Oliveira, B.C. Janegitz, V. Zucolotto and O. Fatibello-Filho, Cent. Eur. J. Chem., 11 (2013) 1837‒1843.
32. H.F. Zhou, G.X. Ran, J.F. Massonb, C. Wang, Y. Zhao and Q.J. Song, Biosens. Bioelectron., 105 (2018) 226–235.
33. S. Phal, B. Lindholm-Sethson, P. Geladi, A. Shchukarev and S. Tesfalidet, Anal. Chim. Acta, 987 (2017) 15‒24.
34. D. Asbahr, L.C.S. Figueiredo-Filho, F.C. Vicentini, G.G. Oliveira, O. Fatibello-Filho and C.E. Banks, Sens. Actuators B, 188 (2013) 334–339.
35. Y. J. Guo, Y.H. Chen, Q. Zhao, S.M. Shuang and C. Dong, Electroanalysis, 23 (2011) 2400–2407. 36. Y.T. Wang, J. Xie, L. Tao, H. Tian, S. Wang and H. Ding, Sens. Actuators B, 204 (2014) 360–
37. Y.W. Wang, H. Liu, F. Wang and Y.M. Gao, J. Solid State Electrochem., 16 (2012) 3227–3235. 38. Z.Y. Zhu, F.L. Wang, F.M. Wang and L.L. Xi, J. Electroanal. Chem., 708 (2013) 13–19.
39. H. Patel, P. Giri, A. Ghoghari, P. Delvadia, M. Syed and N. R. Srinivas, Biomed. Chromatogr., 31 (2017) e3849–e3869.
40. M. Seredych, J.A. Rossin and T.J. Bandosz, Carbon, 49 (2011) 4392–4402.
41. B. Sidhureddy, A.R. Thiruppathi and A.C. Chen, Chem. Commun., 53 (2017) 7828‒7831. 42. X.Q. Cui, X. Fang, H. Zhao, Z.X. Li and H.X. Ren. Anal. Methods, 9 (2017) 5322‒5332. 43. N. Zeinali, M. Ghaedi and G. Shafie. J. Ind. Eng. Chem., 20 (2014) 3550‒3558.
44. R. Jain, A. Sinha, N. Kumari and A.L. Khan, Anal. Methods, 8 (2016) 3034‒3045. 45. W.S. Hummers and R.E. Offeman, J. Am. Chen. Soc., 80 (1958) 1339–1339. 46. K. Zhang, V. Dwivedi, C. Chi and J. Wu, J. Hazard. Mater., 182 (2010) 162–168. 47. Z. Fan and D.J. Harrison, Anal. Chem., 64 (1992) 1304–1311.
48. Y.X. Li, L. Liang, C.P. Liu, Y. Li, W. Xing and J.Q. Sun, Adv. Mater., 30 (2018) 1707146. 49. Y. Yin, H. Wang and G. Liu, Int. J. Electrochem. Sci., 13 (2018) 10259–10273.
50. J.Y. Jiang, Q.Y. Li,W.C. Wang, X.H. Chen amd Z.D. Chen, Int. J. Electrochem. Sci., 13 (2018) 587–597.
51. P.K. Kalambatea, B.J. Sanghavib, S.P. Karnac and A.K. Srivastavaa, Sens. Actuators B, 213 (2015) 285–294.
52. D.Q. Huang, C. Chen, Y.M. Wu, H. Zhang, L.Q. Sheng, H.J. Xu and Z.D. Liu, Int. J. Electrochem. Sci., 7 (2012) 5510–5520.
53. A.Y. Tesio, S.N. Robledo, H. Fernandez and M.A. Zon, Bioelectrochem., 91 (2013) 62‒69.