TECHNICAL NOTE
cFinder: definition and quantification
of multiple haplotypes in a mixed sample
Norbert Niklas
1*, Julia Hafenscher
1, Agnes Barna
1, Karin Wiesinger
1, Johannes Pröll
1, Stephan Dreiseitl
2,
Sandra Preuner‑Stix
3, Peter Valent
4, Thomas Lion
3and Christian Gabriel
1Abstract
Background: Next‑generation sequencing allows for determining the genetic composition of a mixed sample. For instance, when performing resistance testing for BCR‑ABL1 it is necessary to identify clones and define compound mutations; together with an exact quantification this may complement diagnosis and therapy decisions with addi‑ tional information. Moreover, that applies not only to oncological issues but also determination of viral, bacterial or fungal infection. The efforts to retrieve multiple haplotypes (more than two) and proportion information from data with conventional software are difficult, cumbersome and demand multiple manual steps.
Results: Therefore, we developed a tool called cFinder that is capable of automatic detection of haplotypes and their accurate quantification within one sample. BCR‑ABL1 samples containing multiple clones were used for test‑ ing and our cFinder could identify all previously found clones together with their abundance and even refine some results. Additionally, reads were simulated using GemSIM with multiple haplotypes, the detection was very close to linear (R2= 0.96). Our aim is not to deduce haploblocks over statistics, but to characterize one sample’s composition precisely. As a result the cFinder reports the connections of variants (haplotypes) with their readcount and relative occurrence (percentage). Download is available at http://sourceforge.net/projects/cfinder/.
Conclusions: Our cFinder is implemented in an efficient algorithm that can be run on a low‑performance desktop computer. Furthermore, it considers paired‑end information (if available) and is generally open for any current next‑ generation sequencing technology and alignment strategy. To our knowledge, this is the first software that enables researchers without extensive bioinformatic support to designate multiple haplotypes and how they constitute to a sample.
Keywords: Mixed sample, Haplotype identification, Clone quantification, Next‑generation sequencing, Software
© 2015 Niklas et al. This article is distributed under the terms of the Creative Commons Attribution 4.0 International License (http://creativecommons.org/licenses/by/4.0/), which permits unrestricted use, distribution, and reproduction in any medium, provided you give appropriate credit to the original author(s) and the source, provide a link to the Creative Commons license, and indicate if changes were made. The Creative Commons Public Domain Dedication waiver (http://creativecommons.org/ publicdomain/zero/1.0/) applies to the data made available in this article, unless otherwise stated.
Background
The onset of next-generation sequencing (NGS) plat-forms in many laboratories enables researchers to quantify the genetic composition of a specific sample. Assuming that each cell of this sample produces the same amount of DNA a relative quantification can be deduced from the overall amount of sequencing reads [1].
454 sequencing allows for long reads up to 1000 bp, reading through most target regions where phasing is necessary. 454’s pyrosequencing strategy reads one
template DNA molecule in either forward or reverse direction [2]. Illumina can also do paired end sequencing, where every DNA fragment is read in both directions and can be matched, even if there is no overlap. It is evident that both technologies allow for the detection of haplo-types although different sequencing strategies must be applied.
However, the detection of compound mutations as in BCR-ABL1 for resistance testing and the quantification of the found clones have to be performed manually [3]. This process is not just time-consuming but also error prone. To our knowledge there is no software yet that can effectively detect and exactly quantify multiple haplotypes without extensive bioinformatics assistance.
Open Access
*Correspondence: [email protected]
1 Red Cross Transfusion Service for Upper Austria, Krankenhausstraße 7,
4017 Linz, Austria
There are some tools (e.g. HaplotypeCaller of GATK) that can establish phasing but these tools provide no ability to detect more than two clones or calculate quantities. GS Amplicon Variant Analyzer (AVA, 454 Life Sciences, Branford, CT) is the only software that allows the definition of combined variants manually, with additional manual calculation steps. CLCbio’s Genomics Workbench 7.0 (GWB, CLCbio, Aarhus, Denmark) is able to link mutations in the same coding triplet only.
Ultra-deep sequencing with a coverage of multiple 10 k reads per target is necessary to yield accurate quantities [4]. Because exact phasing of whole genome or whole exome data is impossible and approximation just fea-sible statistically [5], we assume a rather small size (up to 10 k bp) as a region of interest in the human genome (trade-off between region size and coverage) [6].
cFinder is capable of analysing sequence data inde-pendent of any sequencing platform, organism and library preparation strategy. Prerequisites are a reference sequence and a medical or biological expert. Moreover, a graphical user interface provides convenient usage, so that our tool can be applied without bioinformatics or scripting knowledge. Our aim is not to sequence multi-ple sammulti-ples and to deduce haploblocks (multimulti-ple variants passed on together by meiosis) over statistical occur-rences in a population, but to characterize one sample and its composition precisely.
Technicalities
The software can be run on any desktop computer with. NET 4.0 installed, memory usage and runtime are both reduced to a minimum. Assuring the highest degree of flexibility, no mapping or alignment algorithm is directly implemented (see Additional file 1).
Thus, the software is able to work with the most com-mon mapping formats ACE and SAM (unpadded and padded) [7]. An annotation file (genebank format *.gb or user defined) allows the calculation of amino acid and coding sequence changes.
The architecture of the software allows for loading an enormous amount of reads (coverage), just affecting load-ing time. For 4 M simulated reads in paired end mode, cFinder consumed 811 MB memory and took 11.2 min to load the data, calculation was done in 11 s; for 8 M simu-lated reads loading took 23.8 min and calculation 22 s; conducted with 2.67 GHz and 6 GB RAM.
The output of the software is a list of connected vari-ants (haplotypes) occurring with the same pattern on multiple reads. Additionally the coding region change and the amino acid change are reported. Hence, it can be investigated what variants occur together. The abso-lute number of reads with this variant combination is
displayed together with the calculated percentage. This information may be exported in csv or MS Excel format.
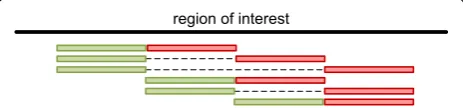
Usage and workflow
All tasks after the initial loading step run in linear time (target region size or coverage), the workflow is summa-rized in Fig. 1.
The software parses the mapping file and associates found haplotypes per read. At this step all variations (including sequencing errors) are used to create the hap-lotypes. Consecutive variants following each other are reported in a combined and single format, likewise are variants in one coding triplet.
Found variants are displayed and filtering is feasible. Subsequently, the user may select relevant variants. These can be designated for a specific genus of bacteria or vari-ants that are responsible for resistance against medica-tion [8], e.g. variant definitions from COSMIC database can be loaded.
The previously stored haplotypes are recalculated based on the selected variants and reported together with their percentage. Haplotypes as well as variants can be exported; hence, monitoring a patient at different time points is possible.
Methods
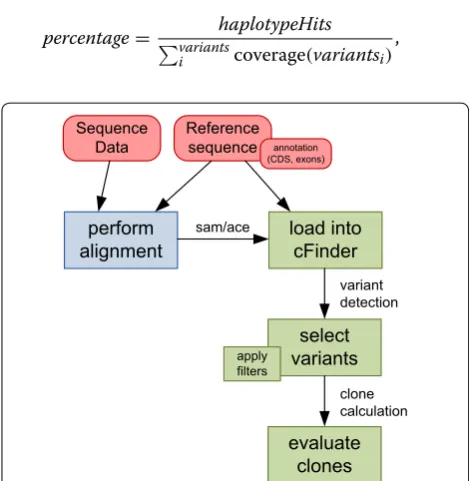
The percentage of a haplotype is calculated with
percentage=
haplotypeHits variants
i coverage(variantsi)
,
perform
alignment load intocFinder sam/ace
Reference sequence Sequence
Data
select variants
evaluate clones
variant detection
clone calculation
annotation (CDS, exons)
apply filters
[image:2.595.304.539.417.658.2]the number of reads with this haplotype’s variant compo-sition divided by the coverage at these pocompo-sitions. Cover-age might vary over the reference sequence. Reads not covering the variant positions will be counted as wild type (wt), hence the sum of all percentages will not sum up to 100 % and wt percentage is estimated from detected clones (1−percentages, minimum 0).
Only sequence reads exactly matching the variants of the assigned haplotype are counted. There is no further statistics applied to the found haplotypes, only the extrac-tion of all occurrences in a highly efficient way. Forward and reverse fragments of paired-end reads (if available) are connected to establish a haplotype. Ambiguous bases in a paired-end overlap are not counted as a variant (by definition one of them is a sequencing error).
Overlapping amplicons
Specialized amplicon designs have to be developed when read length is shorter than region of interest (see Fig. 2). If this is not uniformly covered by design, the ampli-con positions must be loaded (to perform correct cal-culations). For these amplicon designs the user finds a specialized checkbox “Infer Relationship(s)” where haplo-types scattered over multiple amplicons are again recon-nected. The algorithm creates a symmetric, unweighted graph with nodes representing variants and edges repre-senting an occurrence on (at least) one sequence. In this graph, the largest subgraph is determined where all nodes are connected with all other nodes in the subgraph (find-ing this graph is referred to as maximum clique problem in graph theory). The subgraph defines a new haplotype, and readcounts for contributing fragments are recalcu-lated. Fragments and connections with no reads left are removed and the next largest subgraph is searched. Since the maximum clique problem is NP-complete [9], this is the only computationally expensive task after loading. It is limited to 15 rounds and 20 variants to be accomplisha-ble on a desktop computer. The output for an overlapping amplicon design does not differ from the above described output. Concerning the connections between variants, some might be detected that cannot be found on reads. It
should be noticed that this combinatorial task is complex and sophisticated and there are cases where no connec-tion can be achieved at all, especially with high number of variants and overlapping subgraphs.
Results and discussion
Next-generation sequencing data generated from long-range BCR-ABL1 sequencing was utilized for evaluation and testing [8]. The original data consist of sequencing one 933 bp amplicon for eleven samples with 29 clones detected by manual investigation (using 454 GS FLX+
technology, AVA, CLC GWB and manual calculation of clones and percentages), ten samples were used for sub-sequent analysis (see also Additional file 2). Approval of an ethics committee is not required for this analy-sis. Alignments of individual reads from AVA and CLC GWB using the Large Gap Mapper tool (settings m2, i3, d1, s0.7, l0.7) were loaded and annotated in our cFinder, and both compared to previous (manual) results from [8]. Clinically relevant variants were selected and clone detection yielded 38 clones in 10 samples. All previously detected clones could be confirmed and clones with a percentage greater or equal to 1 % were investigated. Correlations of clones’ percentages with manual data were 0.973 for AVA as well as for CLC alignments and correlations of counted number of reads were 0.995 and 0.993 for AVA and CLC, respectively.
Since alignment of a large 540 bp deletion (well-known for the BCR-ABL fusion product) in sample 8 is not pos-sible by AVA, it was just analyzed with the alignment created by CLC. All clones with a percentage greater or equal to 1 % were investigated.
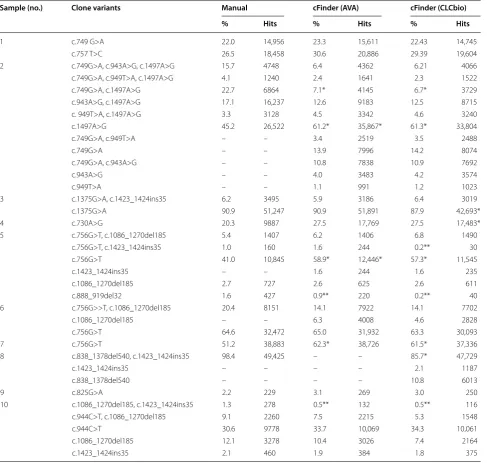
A detailed comparison is presented in detail in Table 1. For four samples more clones were detected, represent-ing sub clones of the manually defined ones. In one of them, this leads to reduced percentages of previously reported clones. Just five clones differed by more than 10 percentage points, although a similar number of reads was reported (different calculation).
Two clones fell below the 1 % limit with the improved calculation and would not be treated as real clones. The results generated with AVA and CLC differ for one clone only.
Deviation from manual results is evident due to differ-ent definition of compound mutations and calculation (n=2numVariants possible combinations, where num-Variants is the number of variants of interest). Manual calculation did not take coverage at variant position into account, while AVA does not output the number of reads concerning sub clones accurately. Our software tool detects occurring haplotypes automatically, count-ing each read just once and calculates the frequencies adjusted to the coverage at the variants position.
region of interest
[image:3.595.58.290.607.661.2]No real data were available for a multi-amplicon design, therefore two artificial alignments were created (Fig. 3). Our software managed to infer the haplotypes scattered over multiple amplicons and extract their correct clones and counts (Table 2).
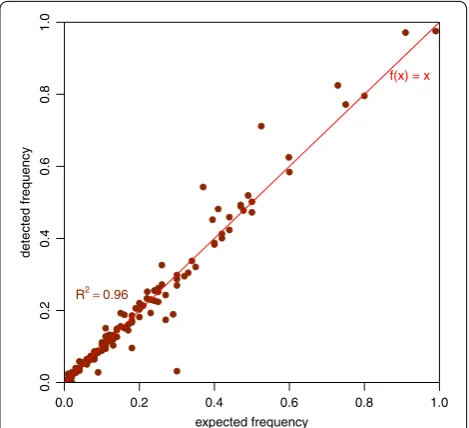
Besides, we used GemSIM to simulate 100 k reads (l = 600) for a short (924 bp) fragment of E. coli using the profile for 454 data [10]. In total 26 test cases had 133 dif-ferent haplotypes (min. 3, max. 8 haplotypes with each up
to 9 variants, avg. 4.2 variants). We included multiple clones (haplotypes) that were created by the GemSIM software (GemHaps.py) along with sequencing errors. After align-ment with CLC GWB the cFinder detected all haplotypes. Using the absolute number of reads detected the estimated percentages correlated with R2 = 0.96 that is nearly linear. The deviation can be related to the high number of errors included in the 454 profile. Figure 4 displays a scatterplot visualizing the simulated and detected percentages.
Table 1 Comparison of alignment methods and cFinder to manual approach
Sample and found clone variants are listed with their percentage of occurrence and the hits (absolute number of reads with that variant), comparing manual detection with automated analysis with cFinder with two different alignment software products. Results marked with one star (*) show intense deviation from manual findings, numbers marked with two stars (**) fell below threshold of 1 %. If clone was not detected it is marked with a dash (–)
Sample (no.) Clone variants Manual cFinder (AVA) cFinder (CLCbio)
% Hits % Hits % Hits
1 c.749 G>A 22.0 14,956 23.3 15,611 22.43 14,745
c.757 T>C 26.5 18,458 30.6 20,886 29.39 19,604
2 c.749G>A, c.943A>G, c.1497A>G 15.7 4748 6.4 4362 6.21 4066
c.749G>A, c.949T>A, c.1497A>G 4.1 1240 2.4 1641 2.3 1522
c.749G>A, c.1497A>G 22.7 6864 7.1* 4145 6.7* 3729
c.943A>G, c.1497A>G 17.1 16,237 12.6 9183 12.5 8715
c. 949T>A, c.1497A>G 3.3 3128 4.5 3342 4.6 3240
c.1497A>G 45.2 26,522 61.2* 35,867* 61.3* 33,804
c.749G>A, c.949T>A – – 3.4 2519 3.5 2488
c.749G>A – – 13.9 7996 14.2 8074
c.749G>A, c.943A>G – – 10.8 7838 10.9 7692
c.943A>G – – 4.0 3483 4.2 3574
c.949T>A – – 1.1 991 1.2 1023
3 c.1375G>A, c.1423_1424ins35 6.2 3495 5.9 3186 6.4 3019
c.1375G>A 90.9 51,247 90.9 51,891 87.9 42,693*
4 c.730A>G 20.3 9887 27.5 17,769 27.5 17,483*
5 c.756G>T, c.1086_1270del185 5.4 1407 6.2 1406 6.8 1490
c.756G>T, c.1423_1424ins35 1.0 160 1.6 244 0.2** 30
c.756G>T 41.0 10,845 58.9* 12,446* 57.3* 11,545
c.1423_1424ins35 – – 1.6 244 1.6 235
c.1086_1270del185 2.7 727 2.6 625 2.6 611
c.888_919del32 1.6 427 0.9** 220 0.2** 40
6 c.756G>>T, c.1086_1270del185 20.4 8151 14.1 7922 14.1 7702
c.1086_1270del185 – – 6.3 4008 4.6 2828
c.756G>T 64.6 32,472 65.0 31,932 63.3 30,093
7 c.756G>T 51.2 38,883 62.3* 38,726 61.5* 37,336
8 c.838_1378del540, c.1423_1424ins35 98.4 49,425 – – 85.7* 47,729
c.1423_1424ins35 – – – – 2.1 1187
c.838_1378del540 – – – – 10.8 6013
9 c.825G>A 2.2 229 3.1 269 3.0 250
10 c.1086_1270del185, c.1423_1424ins35 1.3 278 0.5** 132 0.5** 116
c.944C>T, c.1086_1270del185 9.1 2260 7.5 2215 5.3 1548
c.944C>T 30.6 9778 33.7 10,069 34.3 10,061
c.1086_1270del185 12.1 3278 10.4 3026 7.4 2164
[image:4.595.57.545.103.566.2]Conclusion
cFinder is easy to use and quickly identifies and quantifies clones in a mixed sequencing result this
discriminates the cFinder from other software products. Overall, all clones and their frequencies are designated with a minimum of user interaction. The tool can be used for data analysis for research as published in [8]. Both alignment types (AVA and CLC) showed a similar performance, supported the previous manual findings, and could even refine them in some cases. The simula-tion experiment confirms the high accuracy. Thus, our cFinder is completely independent from any alignment tool or settings, allowing for a maximum of flexibility for a specific application.
wt, n = 4 2 mut, n = 2 3 mut, n = 1
1 mut, n = 5 3 mut, n = 3 4 mut, n = 1
wt, n = 1 1 mut, n = 6
a
b
1
1
1
2
3 3
3
3 3
4
4 2
2
2
Fig. 3 Test scenarios for overlapping amplicon design. Two test scenarios were created with simulated reads, consisting of three clones (a) and five clones (b). Each line represents a clone having different variants (numbered squares), scattered over multiple sections of amplicon design (see Fig. 2)
Table 2 Test of simulated data with overlapping amplicons
Comparison of using the infer relationship option to detect haplotypes that are scattered over multiple amplicons. The column clone variants holds a list of variants (numbered according to Fig. 3, design of the test cases) where “1, 3” means that the clone has variant 1 and variant 3. Default analysis yields just occurring haplotypes on simple amplicons while ticking the checkbox for inferring haplotypes manages to identify the connected variants. If clone was not detected it is marked with a dash (–), true haplotypes (used for simulation) are marked with a star (*)
Test Clone variants Default Infer
relation-ships
% Hits % Hits
A 1 23.8 5 – –
3 23.8 5 – –
1, 3* 14.3 3 28.6 2
1, 2 4.8 1 – –
2 4.8 1 – –
2, 3 4.8 1 – –
1, 2, 3* – – 14.3 1
B 3* 43.8 21 37.5 6
2* 37.5 18 31.3 5
2, 3 8.3 4 – –
3, 4 8.3 4 – –
2, 4 8.3 4 – –
4 6.3 3 – –
1, 4 2.1 1 – –
1, 3 2.1 1 – –
1, 2 2.1 1 – –
2, 3, 4* – – 18.8 3
1, 2, 3, 4* – – 6.3 1
0.0
0.
20
.4
0.6
0.8
1.0
detected frequency
0.0 0.2 0.4 0.6 0.8 1.0 expected frequency
R2=0.96
f(x) = x
[image:5.595.54.540.89.256.2] [image:5.595.305.540.314.528.2] [image:5.595.56.296.328.593.2]Availability and requirements
• Project name: cFinder.
• Availability (including test data): http://sourceforge. net/projects/cfinder/.
• Operating system(s): Windows.
• Programming language: C#.
• Other requirements: .NET 4.0 or higher.
• License: GNU GPL v3.0
• Any restrictions for commercial usage: license
needed.
Abbreviations
NGS: next‑generation sequencing; DNA: deoxyribonucleic acid; AVA: GS Amplicon Variant Analyzer; GS: genome sequencer; GWB: genomics work‑ bench; COSMIC: catalogue of somatic mutations in cancer; SAM: sequence alignment/map format.
Authors’ contributions
NN implemented part of the software, performed analysis and wrote the manuscript. JH wrote source code and performed tests. AB and KW performed manual analysis and critically reviewed the manuscript. SD significantly con‑ tributed to the infer relationships algorithm. JP and CG designed the concept and critically reviewed the manuscript. TL and SP contributed to the testing phase. PV contributed to the concept of the algorithm. All authors read and approved the final manuscript.
Author details
1 Red Cross Transfusion Service for Upper Austria, Krankenhausstraße 7,
4017 Linz, Austria. 2 University of Applied Sciences Upper Austria, Softwarepark
11, 4232 Hagenberg, Austria. 3 Children’s Cancer Research Institute, Vienna,
Austria. 4 Division of Hematology and Hemostaseology, Department of Medi‑
cine I, Ludwig Boltzmann Cluster Oncology, Medical University of Vienna, Vienna, Austria.
Additional files
Additional file 1: Archive containing the cFinder software. Includes executable, library and settings files.
Additional file 2: Archive containing test data. Include annotations and exemplary alignment files from AVA and CLC for sample 5, as well as simulated test reads for overlapping amplicons.
Acknowledgements
This work was supported by the Austrian Science Fund (FWF), SFB Grants F4704‑B20 and F4705‑B20.
Compliance with ethical guidelines
Competing interests
The authors declare that they have no competing interests.
Received: 11 July 2014 Accepted: 24 August 2015
References
1. Ladetto M, Bruggemann M, Monitillo L, Ferrero S, Pepin F, Drandi D et al. Next‑generation sequencing and real‑time quantitative PCR for minimal residual disease detection in B‑cell disorders. Leukemia. 2013;28(6):1299–307. 2. Margulies M, Egholm M, Altman WE, Attiya S, Bader JS, Bemben LA, et al.
Genome sequencing in microfabricated high‑density picolitre reactors. Nature. 2005;437:376–80.
3. Khorashad JS, Kelley TW, Szankasi P, Mason CC, Soverini S, Adrian LT, et al. BCR‑ABL1 compound mutations in tyrosine kinase inhibitor‑resistant CML: frequency and clonal relationships. Blood. 2013;121:489–98. 4. Beerenwinkel N, Zagordi O. Ultra‑deep sequencing for the analysis of viral
populations. Curr Opin Virol. 2011;1:413–8.
5. Kuleshov V, Xie D, Chen R, Pushkarev D, Ma Z, Blauwkamp T et al. Whole‑ genome haplotyping using long reads and statistical methods. Nat Biotechnol. 2014;32(3):261–6.
6. Sims D, Sudbery I, Ilott NE, Heger A, Ponting CP. Sequencing depth and coverage: key considerations in genomic analyses. Nat Rev Genet. 2014;15:121–32.
7. Li H, Handsaker B, Wysoker A, Fennell T, Ruan J, Homer N, et al. The sequence alignment/map format and SAMtools. Bioinformatics. 2009;25:2078–9.
8. Kastner R, Zopf A, Preuner S, Proll J, Niklas N, Foskett P, et al. Rapid iden‑ tification of compound mutations in patients with Philadelphia‑positive leukaemias by long‑range next generation sequencing. Eur J Cancer. 2014;50:793–800.
9. Randy C, Panos MP. An exact algorithm for the maximum clique problem. Oper Res Lett. 1990;9:375–82.
10. McElroy KE, Luciani F, Thomas T. GemSIM: general, error‑model based simulator of next‑generation sequencing data. BMC Genom. 2012;13:74.
Submit your next manuscript to BioMed Central and take full advantage of:
• Convenient online submission • Thorough peer review
• No space constraints or color figure charges • Immediate publication on acceptance
• Inclusion in PubMed, CAS, Scopus and Google Scholar • Research which is freely available for redistribution