RESEARCH
Identification of different malaria
patterns due to
Plasmodium falciparum
and
Plasmodium vivax
in Ethiopian children:
a prospective cohort study
Dinberu Seyoum
1,2, Yehenew Getachew Kifle
3, Virginie Rondeau
4, Delenasaw Yewhalaw
5, Luc Duchateau
6,
Angel Rosas‑Aguirre
1,7and Niko Speybroeck
1*Abstract
Background: The identification of epidemiological pattern of infection with Plasmodium falciparum and Plasmodium vivax in malaria‑endemic area, where multiple episodes are common, is important for intervention programmes. Methods: A longitudinal cohort study based on weekly house‑to‑house visits was conducted between July 2008 and June 2010 in 2040 children less than 10 years of age, living nearby the Gilgel‑Gibe hydroelectric power dam reser‑ voir in order to determine factors associated with increased P. vivax and P. falciparum incidence. Two types of multivari‑ ate frailty models were applied (using time‑to‑first malaria episode data and time‑to‑recurrent malaria episode data), allowing the estimation of adjusted hazard ratios (AHR) of potential risk factors (gender, age, proximity to the dam reservoir, and season) for species‑specific malaria incidence.
Results: Of 2040 children in 96 weeks of follow up, 864 children experienced at least one malaria episode: 685 due to P. falciparum in 548 children, and 385 due to P. vivax in 316 children. Plasmodiumvivax and P. falciparum malaria incidence rates were 8.2 (95 % CI: 7.3–9.1) and 14.6 (95 % CI: 13.4–15.6) per 1000 children per month, respectively. According to the time‑to‑recurrent event models, children aged ≥7 years had a lower risk of presenting P. vivax episodes (AHR = 0.6; 95 % CI: 0.4–0.9), but a higher risk of P. falciparum episodes, when compared with children under ≤3 years (AHR = 1.2; 95 % CI: 1.1–1.6). In addition, P. vivax (AHR = 2.7; 95 % CI: 2.2–3.5) and P. falciparum (AHR = 16.9; 95 % CI: 14.3–20.2) episodes were respectively 2.7 and 16.9 times more frequent in the dry season than in the long rainy season.
Conclusions: The analysis of all malaria episodes (first and recurrent episodes) in the malaria cohort suggests differ‑ ent species‑specific patterns of malaria disease in children, with mild seasonality in the incidence of P. vivax episodes mostly observed in younger age groups, and with marked seasonality in the incidence of P. falciparum episodes mainly seen in older children.
Keywords: Frailty model, Recurrent malaria, Plasmodium vivax, Plasmodium falciparum, Ethiopia
© 2016 Seyoum et al. This article is distributed under the terms of the Creative Commons Attribution 4.0 International License (http://creativecommons.org/licenses/by/4.0/), which permits unrestricted use, distribution, and reproduction in any medium, provided you give appropriate credit to the original author(s) and the source, provide a link to the Creative Commons license, and indicate if changes were made. The Creative Commons Public Domain Dedication waiver (http://creativecommons.org/ publicdomain/zero/1.0/) applies to the data made available in this article, unless otherwise stated.
Background
Despite the good progress over the past decade, malaria remains the most important human vector-borne disease worldwide [1]. According to latest estimates, globally
214 million cases and 438,000 deaths occurred in 2015, mainly among children under 5 years of age living in Africa [1]. Malaria is a major public health problem in Ethiopia, threatening about 70 % of the total population and contributing 4 % to all cases in Africa [2]. Unlike in most endemic African countries [3], both P. falciparum and P. vivax substantially contribute to malaria morbid-ity in Ethiopia, accounting respectively for 60 and 40 %
Open Access
*Correspondence: [email protected]
1 Institute of Health and Society (IRSS), Université catholique de Louvain, Brussels, Belgium
of the total reported cases [4]. Species-specific malaria transmission is influenced by climate, topography, human settlement and population movement patterns; and can vary widely across country regions [5, 6].
Unlike P. falciparum, P. vivax can cause relapses due to its ability to produce latent parasite stages (hypnozo-ites) [7, 8]. This particular biological characteristic makes it challenging to understand P. vivax malaria transmis-sion, given that P. vivax recurrent episodes can be caused either by hypnozoite-triggered relapses, resurgence of erythrocytic parasites (i.e. recrudescence) due to a failure in the treatment, or reinfection of individuals with a new parasite strains following primary infections [9].
A cross-sectional community-based study conducted in south-western Ethiopia in 2005 reported increased P. falciparum and P. vivax prevalence rates by microscopy in households in close proximity to the Gilgel-Gibe dam [10]. However, the analysis of data from a 2-year (2008– 2010) cohort study, involving children living around the same dam, and using an approach that does not account for recurrent episodes, was not able to show association between P. falciparum clinical malaria incidence and household distance to the dam [11].
Researchers have often used time-to-first event models to analyse malaria disease data from longitudinal stud-ies [11–14]. Those models do not take into account that individuals can experience multiple episodes during the study period and ignore the probability of occurrence of a new episode possibly being influenced by earlier episodes [15]. Time-to-recurrent models, such as the frailty model used in the present study, have been applied to recur-rent event data in several studies to accommodate for the correlation between event times within a same subject [16–18]. Those models have been used to estimate the intervention effects using recurrent episodes in clinical trials [19] as well as to assess risk factors for recurrent health conditions [20, 21].
Using a 2-year longitudinal malaria cohort data of chil-dren living nearby the Gilgel-Gibe dam in south-west Ethiopia, this study aimed to assess the effect of age, sea-son period, and household distance to the dam on the spe-cies-specific clinical malaria incidence (P. falciparum and P. vivax) and to generate evidence to strengthen the pre-vention and control of malaria in the area. The study was implemented as part of several other studies, intended to assess the impact of the Gilgel-Gibe hydroelectric dam in the health and other sectors (environment, agriculture, economy, etc.) following its opening in 2004 [22].
Methods Study area
The study area lies between latitudes 7°42′50″N and 07°53′50″N and between longitudes 37°11′22″E and
37°20′36″E at an altitude of 1734–1864 metres above sea level, and is located at 260 km south-west of the capital Addis Ababa in the Oromia region, south-western Ethio-pia. The area is located near the Gilgel-Gibe hydroelec-tric dam, which covers a territory of 62 km2 (Fig. 1). The
weather is sub-humid and warm, with an annual rainfall between 1300 and 1800 mm, and a mean annual tem-perature of 19 °C. Considering the rainfall pattern, three seasons can be identified along the year: the long rainy season from July to September, the dry season from October to March, and the moderate rainy season from April to June.
Sixteen villages within 10 km radius (265–9046 metres) from the dam reservoir shore were randomly selected based on similar eco-topography, access to health facili-ties, without major impounding water nearby and homo-geneous with respect to socio-cultural and economic activities [11]. The main socio-economic local activities are mixed farming involving the cultivation of staple crops (maize, teff and sorghum), and cattle and small stock raising. All households in selected communities had access to health facilities and were socio-economi-cally similar [10]. Anopheles arabiensis is the major local malaria vector [11].
Study design and population
A longitudinal 2-year malaria cohort study was con-ducted in children under 10 years old, living in the selected 16 villages around the Gilgel-Gibe hydroelectric power dam. A total of 2040 children aged <10 years were enrolled in July 2008, and then weekly followed up until June 2010. Each child was identified with a unique code, and selected villages and households were geo-referenced using a handheld global positioning system (GPS) device (Garmin’s GPSMAP 60CSx, Garmin International Inc., USA), allowing the estimation of the household distance to the dam.
Ethical approval
Ethical approval for the study was obtained from Jimma University Research and Ethics Committee. Verbal and written signed informed consent was obtained from the mother or caregiver of each child before enrollment of the child in the study.
Malaria follow‑up and laboratory processing
finger-prick blood sample was taken for immediate diag-nosis by microscopy in the same site or at Omo-Nada district Health Center Laboratory. Microscopy diagnosis was conducted by trained laboratory technicians. Thick smears were used to confirm the presence or absence of parasites, whereas the thin smear was used to identify the Plasmodium species.
All children with microscopically confirmed malaria were treated according to the national treatment guide-lines [21]. Treatment was administered by the parents and/ or guardians of the children, and consisted of 25 mg/kg
of chloroquine (CQ) over three consecutive days for P. vivax, and artemether-lumefantrine (AL) for P. falcipa-rum twice daily according to the body weight as follows: 5–14 kg, one tablet per dose; 15–24 kg, two tablets per dose; 25–34 kg, three tablets per dose; and adult, four tablets per dose. Treatment adherence was monitored during household visits by asking for the medication packages and the remaining pills.
[image:3.595.57.541.89.532.2]by a health facility. In addition, all the health facilities near the study communities were monthly visited to ver-ify their clinical records, checking if any enrolled children had presented a confirmed malaria episode in the past month not being detected during the weekly visits.
The monthly number of episodes by species and data published previously on the density of A. arabiensis dur-ing the study period were shown graphically. Mosquitoes were collected in all 16 communities, once a month, from 18:00 to 6:00 h in two selected houses using light trap catches. Further details on the mosquito collection meth-odology are described elsewhere [11].
Data structure for modelling first and recurrent malaria episodes
Malaria episode data of each child were checked care-fully to identify a first malaria episode as well as any addi-tional malaria episodes after the first malaria episode (i.e. recurrent episodes). For the time at risk, a child treated for a malaria episode was censured for 21 days in order to prevent double counting of episodes and to allow for any prophylactic effect of the antimalarial treatment [24].
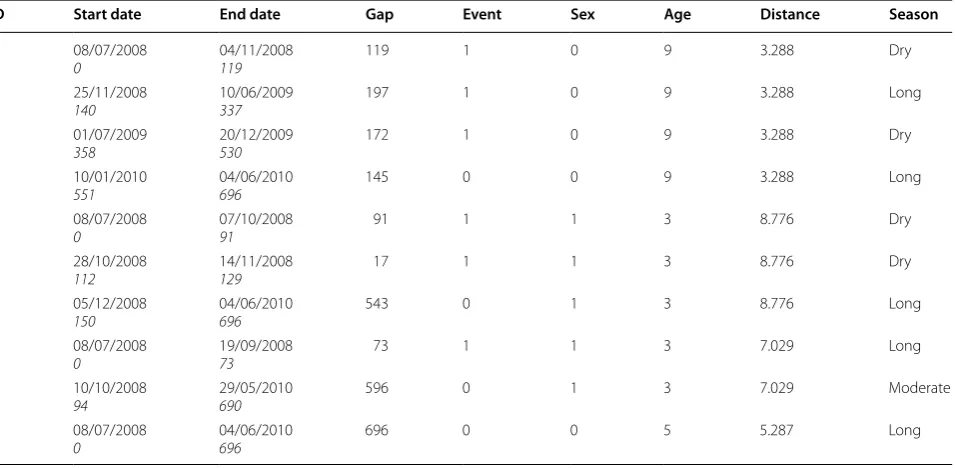
A sub-sample data of four children in Table 1 illustrates the differences in the data structures required for mod-elling first malaria episodes and recurrent malaria epi-sodes. The time from the start of the follow-up (July 8th 2008) to the first episode (time-to-first episode) in chil-dren who presented malaria episodes, and the time to the last censorship in children who did not present malaria
episodes was considered to model first malaria episodes. Therefore, this data structure excluded all additional information after the time of the first malaria episode. According to these criteria, from the sample of four chil-dren data layout (Table 1), only data from the first row of each child were used to model time-to-first episodes.
Conversely, data from children with both one and more malaria episodes were accounted when modelling recur-rent episodes. The time at risk for a recurrecur-rent episode in each child with recurrent episodes was given by the time between two successive malaria episodes minus 21 days (i.e. a discontinuous time interval data structure). For instance, the follow-up history of one child is described by the first four rows of Table 1. The first row indicates that the child began the follow-up at time 0 and remained at risk of presenting a malaria episode until day 119 when an episode was confirmed; the second row indi-cates that the risk of presenting another episode in the child re-started 21 days after a previous episode at day 140 and ended on day 337 when the episode occurred; the third row indicates that the risk re-started at day 358 and ended on day 530; and the fourth row indicates that the child was followed until day 696, no longer present-ing additional malaria episodes. The second child had two malaria episodes at day 91 and 129 and the follow-up ended on day 696, the third child had one malaria episode at day 73 and the follow-up ended on day 690 without a malaria episode, and the fourth child had no episodes during the follow-up period. Additional file 1
Table 1 Data structure showing a sample of four children malaria episode history (July 2008–June 2010) for the analysis of time-to-recurrent malaria episodes
ID Start date End date Gap Event Sex Age Distance Season
1 08/07/2008
0 04/11/2008119 119 1 0 9 3.288 Dry
1 25/11/2008
140 10/06/2009337 197 1 0 9 3.288 Long
1 01/07/2009
358 20/12/2009530 172 1 0 9 3.288 Dry
1 10/01/2010
551 04/06/2010696 145 0 0 9 3.288 Long
2 08/07/2008
0 07/10/200891 91 1 1 3 8.776 Dry
2 28/10/2008
112 14/11/2008129 17 1 1 3 8.776 Dry
2 05/12/2008
150 04/06/2010696 543 0 1 3 8.776 Long
3 08/07/2008
0 19/09/200873 73 1 1 3 7.029 Long
3 10/10/2008
94 29/05/2010690 596 0 1 3 7.029 Moderate
4 08/07/2008
[image:4.595.62.540.484.718.2]shows the follow-up history of a sample of four children and the data structure representation for time-to-recur-rent episode models according to a counting process (cal-endar timescale). Figure 2a shows the children follow-up time line; one time line represents the total follow-up period history. In the calendar time layout (Fig. 2b), each time line represents the length of time at risk for a new malaria episode in the same child.
Statistical analysis
Malaria incidence rates (by species) were calculated by dividing the number of episodes during the study period by child-months at risk, and expressed as the number of episodes per 1000 child-months at risk. A child-month at risk corresponds to a child that had at least once weekly visit of the total 4 weeks of a specific month. Correspond-ingly, 95 % confidence intervals (95 % CI) of the incidence rates were calculated assuming that the number of new malaria episodes was Poisson distributed.
Frailty models were applied to calculate hazard ratios (HRs) of species-specific incidence using separately time-to first episode data and time-time-to-recurrent episode data. The following potential risk factors were included in the univariate and multivariate models: gender, age groups (≤3, 3–7, ≥7 years), household distance to the dam res-ervoir (in kilometres), and season (long rainy season, dry season, and moderate rainy season). For covariates with more than two categories, a global single p value was
calculated, using a Wald test. Models were fitted in R ver-sion 3.2 using the package ‘frailtypack 2.5.1’ [25].
The time-to-first episode data was modelled through a piecewise Weibull frailty model. The piecewise inter-val was introduced taking into account the hazard rate changes in malaria incidence between the different sea-sons in the 2 years (thus in total six constants, one for each season and year combination). This flexible para-metric approach has been used in a previous study aim-ing to model malaria recurrent events, with good results [24]. The two parameter model is given by the formula h(t)=ρt∧(ρ−1); where λ (lambda) is the scale
param-eter, and ρ (rho) the shape parameter.
The time-to-recurrent malaria episode data was mod-elled by nested frailty models allowing to account for the hierarchical clustering of the data by including two nested random effects that act multiplicatively on the hazard function [25], using a calendar timescale with discontinuous time interval data structure. In this study, village was introduced as a cluster while children within each village were considered as a sub-cluster. The clus-ter “village” random effect variance was estimated by Ɵ
(theta) while the sub-cluster “individual” random effect variance was estimated by η (eta) from the nested frailty model. For model checking, martingale residual of the frailty model were plotted against covariates at a continu-ous level, confirming the fit of the data when no system-atic or clear pattern is observed [26].
[image:5.595.60.540.449.715.2]Results
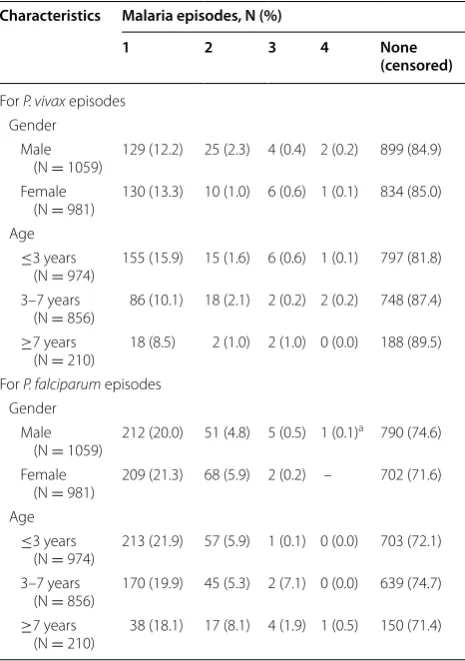
The 2040 children, followed-up from 2008 to June 2010, accounted for 46,972 child-months at risk. Male children (51.9 %) slightly outnumbered female children (48.1 %), and the median age at the time of enrolment was 5 years. A total of 1070 clinical malaria episodes were registered during the study period, including 685 episodes of P. fal-ciparum in 548 children (421 with one episode, 119 with two, seven with three, and one with five episodes) and 385 episodes of P. vivax in 316 children (263 with one episode, 40 with two, 10 with three, and three with four episodes). Plasmodium falciparum and P. vivax malaria incidence rates were 14.6 (95 % CI: 13.4–15.6) and 8.2 (95 % CI: 7.3–9.1) per 1000 children per month, respec-tively. Plasmodium falciparum episodes predominated over P. vivax episodes in all selected communities (Addi-tional file 2); episodes by both species peaked during the dry season after an increase of the mosquito density in the previous months (Fig. 2). While P. vivax episodes were more frequent in children younger than 3 years of age (p < 0.001), P. falciparum episodes occurred mostly in children older than 7 years (p < 0.001) (Table 2). Differ-ences between boys and girls in the number of species-specific malaria episodes were not statistically significant (p > 0.05).
Table 3 shows the follow-up-time and numbers of chil-dren included in the time-to-first episode models and in the time-to-recurrent episode models. The median time to the first episode in 316 children (134 days) who had at least one P. vivax episode throughout the study period was slightly lower than the median time between the first and second episodes in 53 children (147 days), and between the second and third episodes in 13 children (172 days). On the other hand, the median time to the first episode in 548 children who had at least one P. fal-ciparum episode (286 days) were higher than the median time between the first and second episodes in 127 chil-dren (204 days), and between the second and third epi-sodes in eight children (131 days).
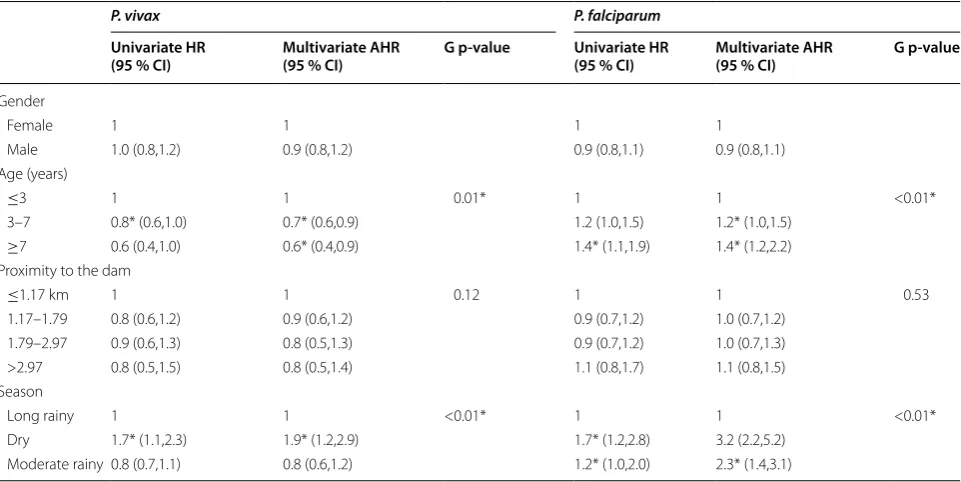
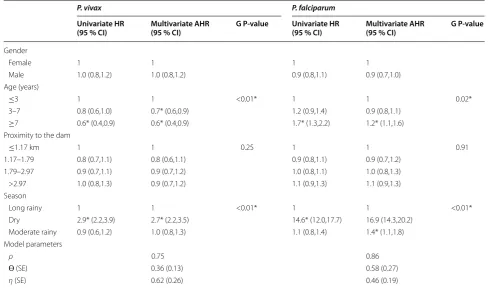
Multivariate time-to-first episode and time-to-recur-rent episode models showed (using global and local p-values) that the age of the child at enrolment and sea-son were significantly associated with the incidence of P. vivax episodes even after controlling for other non-signif-icant potential risk factors such as gender and household proximity to the dam (Tables 4 and 5). While adjusted hazard ratios (AHR), adjusted for age groups were simi-lar in both models indicating that children aged >3 years old were at lower risk of presenting P. vivax episodes than younger children (AHR ~ 0.7; 95 % CI: ~0.5–0.9), AHR estimates for the effect of season categories differed slightly between models. P. vivax episodes occurred 1.9 times more frequently in the dry season than in the long
rainy season according to the time-to-first event model (AHR = 1.9; 95 % CI: 1.2–2.9) (Table 4), while such epi-sodes were estimated to be 2.7 times higher in the dry season than in the long rainy season (AHR = 2.7; 95 % CI: 2.2–3.5) (Table 5), when using time-to-recurrent event model.
[image:6.595.305.538.114.445.2]Similarly to P. vivax models, both types of multivari-ate models for P. falciparum also found that age and season were significantly associated with the incidence of P. falciparum episodes, but with differences in AHR estimates (Tables 4 and 5). For the time-to-first episode model, children aged 3–7 years (AHR = 1.2; 95 % CI: 1.0–1.5) and those older than 7 years (AHR = 1.4; 95 % CI: 1.2–2.2) were at greater risk of having P. falciparum episodes than children aged ≤3 years (Table 4). Con-versely, for the time-to-recurrent episode model, children older than 7 years had higher hazards of new P. falcipa-rum episodes in comparison to children younger than or equal to 3 years (AHR = 1.2; 95 % CI: 1.1–1.6) (Table 5). Although P. falciparum episodes were most common in dry and moderate seasons according to both models, Table 2 Characteristics of the study children by number of malaria episodes
a This child had an additional episode (5th episode)
Characteristics Malaria episodes, N (%)
1 2 3 4 None
(censored)
For P. vivax episodes Gender
Male
(N = 1059) 129 (12.2) 25 (2.3) 4 (0.4) 2 (0.2) 899 (84.9) Female
(N = 981) 130 (13.3) 10 (1.0) 6 (0.6) 1 (0.1) 834 (85.0) Age
≤3 years
(N = 974) 155 (15.9) 15 (1.6) 6 (0.6) 1 (0.1) 797 (81.8) 3–7 years
(N = 856) 86 (10.1) 18 (2.1) 2 (0.2) 2 (0.2) 748 (87.4) ≥7 years
(N = 210) 18 (8.5) 2 (1.0) 2 (1.0) 0 (0.0) 188 (89.5) For P. falciparum episodes
Gender Male
(N = 1059) 212 (20.0) 51 (4.8) 5 (0.5) 1 (0.1)
a 790 (74.6)
Female
(N = 981) 209 (21.3) 68 (5.9) 2 (0.2) – 702 (71.6) Age
≤3 years
(N = 974) 213 (21.9) 57 (5.9) 1 (0.1) 0 (0.0) 703 (72.1) 3–7 years
(N = 856) 170 (19.9) 45 (5.3) 2 (7.1) 0 (0.0) 639 (74.7) ≥7 years
AHR estimates resulting from time-to-recurrent episode model for the dry season compared to the long rainy season were considerably higher (AHR = 16.9; 95 % CI: 14.3–20.2) than the ones obtained from the time-to-first episode model (AHR = 2.7; 95 % CI: 2.2–3.5). Gender and distance to the dam were not significantly associated with P. falciparum incidence in both models. Regard-ing model parameter estimates, ρ values lower than one, indicated that for both species incidence rates decreased with time, but incidence rates for P. vivax (ρ ~ 0.7) dur-ing the study period decreased faster than those for P. falciparum (ρ ~ 0.8). The malaria risk variation among villages for P. falciparum (ɵ ~ 0.5) was higher than for P. vivax (ɵ ~ 0.3). Moreover, malaria risk variation among children (η) were higher for P. vivax than for P. falcipa-rum. Additional file 3 shows the fit of the data by plotting martingale residual by the covariate at a continuous level. The lowess estimates did not show a clear pattern, sug-gesting a good fit.
Discussion
This study reports species-specific clinical malaria epi-sode patterns in a 2-year longitudinal cohort study of 2040 children under 10 years old living nearby the Gilgel-Gibe hydropower dam, in south-western Ethio-pia. Multiple P. falciparum and P. vivax malaria episodes
occurred in respectively 127 and 53 children along the study period. Plasmodium vivax clinical episodes were more obvious in younger age groups and occurred mostly in the dry season, while P. falciparum episodes predominated in older children and occurred in the dry and moderate season but with a substantial peak in the first months of the dry season. Both P. vivax and P. fal-ciparum incidence rates decreased with time and were not associated with the household proximity to the dam reservoir.
This is the first study analysing recurrent malaria epi-sodes with two statistical approaches, i.e. time-to-first event models and time-to-recurrent event models with discontinuous risk intervals. Although no major differ-ences in parameter estimates for evaluating risk factors were found between both models using the data at hand, it is not the rule for all health conditions with recurrent episodes and possibly mainly explained by the low occur-rence of recurrent malaria episodes in the study. Indeed, a re-analysis of data from a pneumococcal conjugate vaccine trial and the simulation of scenarios found that the difference between effect estimates of the vaccine obtained from first event models and time-to-recurrent event models was substantial especially when a high incidence of recurrent episodes was noted [27]. Moreover, a number of studies dealing with recurrent Table 3 Number of children by the number of episodes for both species, along with time included in time-to-first event and time-to-recurrent event models
a This child had an additional episode (5th episode)
Follow‑up
Until 1st episode Between 1st
and 2nd episodes Between 2nd and 3rd episodes Between 3rd and 4th episodes
For P. vivax episodes
Number of followed‑up children
Total (N) 2040 316 53 13
With episodes 316 53 13 3
Censored 1724 263 40 10
Follow‑up time
Mean (days) 221 208 196 139
Median (days) 134 147 172 99
[Min.–max.] [7–696] [9–621] [49–402] [66–180]
For P. falciparum episodes Number of followed‑up children
Total (N) 2040 548 127 8
With episodes 548 127 8 1a
Censored 1492 421 119 7
Follow‑up time
Mean (days) 283 233 133 111
Median (days) 286 204 131 105
[image:7.595.59.536.113.378.2]health conditions have observed different results when applying both models separately [15, 24, 26, 28].
The shape model parameter value below one confirmed that malaria incidence rates for both species decreased with time during the study period. A similar decreasing malaria incidence trend has been reported in southwest Ethiopia [29] and may be explained by positive effects of control interventions in the area. Indeed, the government re-started indoor residual spraying with deltamethrin in 2009 and replaced old long-lasting insecticidal nets (LLINs) in 2010 [30].
Although previous studies in Ethiopia and other Afri-can countries have reported dams influencing malaria transmission by increasing vector abundance due to breeding sites associated with dam´s floods on the shore-lines [6, 31–33], the present study did not identify an association between the proximity to the Gilgel-Gibe dam reservoir and the species-specific clinical malaria incidence. The design and the automatic operation of this dam may prevent the appearance of shoreline pud-dles and consequently the formation of breeding sites near the dam [32]. On the other hand, agriculture field puddles, wet lands, man-made pools, and rain pools located extensively in all the study area would become the most important sources of mosquitoes, and these sources may significantly enlarge after the long rainy sea-son. In addition, since the main economic activities in
the communities are related to cattle, animal hoof-prints filled with water would emerge after rains, thus facilitat-ing the development of mosquitoes [34].
The differences in clinical malaria incidence between species with respect to age may be related to a differ-ent species-specific acquisition rate of immunity in the Ethiopian children, which may be related to differ-ent exposure levels for both species in the early years of live. Those differences are in line with previous find-ings from longitudinal studies conducted in co-endemic malaria areas of Papua New Guinea [8, 14, 35]. Malarial immunity in New Guinean children is acquired much more rapidly with P. vivax than with P. falciparum. After 5 years of continuous exposure, children can acquire an almost complete clinical immunity to P. vivax, which is characterized by their control of blood-stage para-site densities rather than the acquisition of a significant immunity against infection [14, 35]. This differential pattern between species was also reported in low trans-mission setting. In longitudinal studies conducted in Thailand [36, 37], and in Vanuatu [38] the incidence of P. vivax malaria also decreased significantly faster with age than that the incidence of P. falciparum, while a cohort study in the Brazilian Amazon indicated that P. vivax malaria started to decrease after 5–6 years of residence in the endemic area compared to 8–9 years for P. falci-parum [39].
Table 4 Univariate and multivariate adjusted risk factors analysis for time-to-first P. vivax episode and P. falciparum epi-sode
HR hazard ratio; AHR adjusted hazard ratio; G p-value global p-value * P < 0.05
P. vivax P. falciparum
Univariate HR
(95 % CI) Multivariate AHR (95 % CI) G p‑value Univariate HR (95 % CI) Multivariate AHR (95 % CI) G p‑value
Gender
Female 1 1 1 1
Male 1.0 (0.8,1.2) 0.9 (0.8,1.2) 0.9 (0.8,1.1) 0.9 (0.8,1.1)
Age (years)
≤3 1 1 0.01* 1 1 <0.01*
3–7 0.8* (0.6,1.0) 0.7* (0.6,0.9) 1.2 (1.0,1.5) 1.2* (1.0,1.5)
≥7 0.6 (0.4,1.0) 0.6* (0.4,0.9) 1.4* (1.1,1.9) 1.4* (1.2,2.2)
Proximity to the dam
≤1.17 km 1 1 0.12 1 1 0.53
1.17–1.79 0.8 (0.6,1.2) 0.9 (0.6,1.2) 0.9 (0.7,1.2) 1.0 (0.7,1.2)
1.79–2.97 0.9 (0.6,1.3) 0.8 (0.5,1.3) 0.9 (0.7,1.2) 1.0 (0.7,1.3)
>2.97 0.8 (0.5,1.5) 0.8 (0.5,1.4) 1.1 (0.8,1.7) 1.1 (0.8,1.5)
Season
Long rainy 1 1 <0.01* 1 1 <0.01*
Dry 1.7* (1.1,2.3) 1.9* (1.2,2.9) 1.7* (1.2,2.8) 3.2 (2.2,5.2)
[image:8.595.58.539.114.355.2]Although a weekly identification of symptomatic chil-dren and the consequent diagnosis and treatment of malaria infections during the study are likely to have con-tributed to the decrease of malaria transmission in the area and consequently possibly explain the decrease of the malaria incidence rate in time, it is worth to notice that the decrease may also be associated with the acquisi-tion of immunity in the study children. Further longitudi-nal studies incorporating the detection and follow-up of both symptomatic and asymptomatic infections in young children are necessary to understand the role of immu-nity (i.e. immuimmu-nity to infection and/or clinical immuimmu-nity) in the malaria transmission in the co-endemic Ethiopia [8, 14, 35].
Many studies have reported high mosquito densities and an increased malaria risk following the rainy sea-son [5, 40]. After rainy periods, intermittent streams could create pockets or pools of water which can serve as potential breeding sites for mosquitoes, contributing to an increase in mosquito density and vector-human contacts; therefore contributing to a greater number of malaria episodes during the dry season. Although malaria is transmitted by both species in the study, it occurred seasonally and mainly after increased rainfall,
P. vivax clinical episodes being less sensitive to seasonal and environmental changes than P. falciparum, an important proportion of the former possibly being hyp-nozoite-triggered relapses [7–9]. This hypothesis is fur-ther supported by the fact that children with confirmed P. vivax episodes only received CQ, following the national guidelines for areas where the glucose-6-phosphate dehy-drogenase deficiency (G6PD deficiency) is not known and where tests to detect that condition are not avail-able [23]. A previous study that used a life-table method showed that in Ethiopia the cumulative risk of recur-rent episodes at day 157 was significantly higher in the CQ group (61.8 %), compared with the CQ + PQ (pri-maquine) group (26.3 %) [41].
Conclusion
The analysis of all malaria episodes (first and recurrent epi-sodes) found different species-specific patterns of malaria disease in the enrolled children, with mild seasonality in the incidence of P. vivax episodes, mostly seen in younger age groups, and with marked seasonality in the incidence of P. falciparum episodes mainly observed in older chil-dren. The decision-making and planning of malaria control interventions will have to consider the seasonal patterns of Table 5 Univariate and multivariate adjusted risk factors analysis for time-to-recurrent P. vivax episodes and P. falcipa-rum episodes
HR hazard ratio; AHR adjusted hazard ratio; SE standard error, G p-value global p-value * P < 0.05
P. vivax P. falciparum
Univariate HR
(95 % CI) Multivariate AHR (95 % CI) G P‑value Univariate HR (95 % CI) Multivariate AHR (95 % CI) G P‑value
Gender
Female 1 1 1 1
Male 1.0 (0.8,1.2) 1.0 (0.8,1.2) 0.9 (0.8,1.1) 0.9 (0.7,1.0)
Age (years)
≤3 1 1 <0.01* 1 1 0.02*
3–7 0.8 (0.6,1.0) 0.7* (0.6,0.9) 1.2 (0.9,1.4) 0.9 (0.8,1.1)
≥7 0.6* (0.4,0.9) 0.6* (0.4,0.9) 1.7* (1.3,2.2) 1.2* (1.1,1.6)
Proximity to the dam
≤1.17 km 1 1 0.25 1 1 0.91
1.17–1.79 0.8 (0.7,1.1) 0.8 (0.6,1.1) 0.9 (0.8,1.1) 0.9 (0.7,1.2)
1.79–2.97 0.9 (0.7,1.1) 0.9 (0.7,1.2) 1.0 (0.8,1.1) 1.0 (0.8,1.3)
>2.97 1.0 (0.8,1.3) 0.9 (0.7,1.2) 1.1 (0.9,1.3) 1.1 (0.9,1.3)
Season
Long rainy 1 1 <0.01* 1 1 <0.01*
Dry 2.9* (2.2,3.9) 2.7* (2.2,3.5) 14.6* (12.0,17.7) 16.9 (14.3,20.2)
Moderate rainy 0.9 (0.6,1.2) 1.0 (0.8,1.3) 1.1 (0.8,1.4) 1.4* (1.1,1.8)
Model parameters
ρ 0.75 0.86
Ɵ (SE) 0.36 (0.13) 0.58 (0.27)
[image:9.595.53.542.114.402.2]malaria transmission in order to reduce malaria incidence, as well as a species-specific policy.
Authors’ contributions
DY conceived and designed the study and reviewed the manuscript; DS per‑ formed the data cleaning, statistical analysis and drafted the manuscript; YG was involved in supervision of statistical methods and critically reviewed the manuscript; VR supervised the analysis and reviewed the manuscript; LD was involved in designing the idea of the study and critically reviewed the manu‑ script; AR contribute to draft the manuscript, read critically and approved the final manuscript; NS generated and designed the idea of the study, was involved in the analysis, coordinated and critically reviewed and revised the manuscript. All authors read and approved the final manuscript.
Author details
1 Institute of Health and Society (IRSS), Université catholique de Louvain, Brussels, Belgium. 2 Department of Statistics, Natural Science College, Jimma University, Jimma, Ethiopia. 3 Department of Statistics and Operations Research, University of Limpopo, Polokwane 0727, South Africa. 4 INSERM EMI 0338 (Biostatistics), Université Victor Segalen Bordeaux 2, 146 rue Leo Saignat, 33076 Bordeaux Cedex, France. 5 Department of Laboratory Technol‑ ogy Science and Pathology, College of Public Health and Medical Science, Jimma University, Jimma, Ethiopia. 6 Department of Comparative Physiology and Biometrics, Faculty of Veterinary Medicine, Ghent University, Ghent, Bel‑ gium. 7 Institute of Tropical Medicine “Alexander von Humboldt”, Universidad Peruana Cayetano Heredia, Lima, Peru.
Acknowledgements
We acknowledge the financial support from the Institutional University Coop‑ eration IUC‑JU project under the umbrella of the Flemish Interuniversity Coun‑ cil (VLIR‑UOS). We thank also Kibiralem Sisay who is Statistics Department staff in Jimma University for helping with me in writing R codes to manage the data. We would like to than the two anonymous reviewers and the editor‑in‑ chief, for their constructive comments which helped to improve the paper.
Competing interests
The authors declare that they have no competing interests.
Received: 29 December 2015 Accepted: 30 March 2016
References
1. WHO. World Malaria Report 2015. Geneva: World Health Organization; 2015.
2. Nigatu W, Abebe M, Dejene A. Plasmodium vivax and P. falciparum epidemiology in Gambella, south‑west Ethiopia. Trop Med Parasitol. 1992;43:181–5.
3. Gething PW, Elyazar IRF, Moyes CL, Smith DL, Battle KE, Guerra CA, et al. A long neglected world malaria map: Plasmodium vivax endemicity in 2010. PLoS Negl Trop Dis. 2012;6:e1814.
4. Olana D, Chibsa S, Teshome D, Mekasha A, Graves PM, Reithinger R. Malaria, Oromia regional state, Ethiopia, 2001–2006. Emerg Infect Dis. 2011;17:1336–7.
Additional files
Additional file 1. Recurrent malaria episode data representation for a sample of four children: (a) four children follow‑up history; (b) children malaria episode information using calendar timescale or counting process approach.
Additional file 2.Plasmodium falciparum and Plasmodium vivax episodes by village in south western Ethiopia (July 2008–June 2010).
Additional file 3. Martingal residual plots with corresponding lowess estimates (red line) (a) for P. vivax, (b) for P. falciparum.
5. Woyessa A, Deressa W, Ali A, Lindtjørn B. Prevalence of malaria infection in Butajira area, south‑central Ethiopia. Malar J. 2012;11:84.
6. Ghebreyesus TA, Haile M, Witten KH, Getachew A, Yohannes M, Lindsay SW, et al. Household risk factors for malaria among children in the Ethio‑ pian highlands. Trans R Soc Trop Med Hyg. 2000;94:17–21.
7. White NJ. Determinants of relapse periodicity in Plasmodium vivax malaria. Malar J. 2011;10:297.
8. Mueller I, Galinski MR, Baird JK, Carlton JM, Kochar DK, Alonso PL, et al. Key gaps in the knowledge of Plasmodium vivax, a neglected human malaria parasite. Lancet Infect Dis. 2009;9:555–66.
9. Wells TNC, Burrows JN, Baird JK. Targeting the hypnozoite reservoir of Plasmodium vivax: the hidden obstacle to malaria elimination. Trends Parasitol. 2010;26:145–51.
10. Yewhalaw D, Legesse W, Van Bortel W, Gebre‑Selassie S, Kloos H, Ducha‑ teau L, et al. Malaria and water resource development: the case of Gilgel‑ Gibe hydroelectric dam in Ethiopia. Malar J. 2009;8:21.
11. Yewhalaw D, Getachew Y, Tushune K, Michael WK, Kassahun W, Ducha‑ teau L, et al. The effect of dams and seasons on malaria incidence and anopheles abundance in Ethiopia. BMC Infect Dis. 2013;13:161. 12. Stefani A, Hanf M, Nacher M, Girod R, Carme B. Environmental, entomo‑
logical, socioeconomic and behavioural risk factors for malaria attacks in Amerindian children of Camopi, French Guiana. Malar J. 2011;10:246. 13. Le Port A, Cottrell G, Martin‑Prevel Y, Migot‑Nabias F, Cot M, Garcia A. First
malaria infections in a cohort of infants in Benin: biological, environmen‑ tal and genetic determinants. Description of the study site, population methods and preliminary results. BMJ Open. 2012;2:e000342. 14. Michon P, Cole‑Tobian JL, Dabod E, Schoepflin S, Igu J, Susapu M, et al.
The risk of malarial infections and disease in Papua New Guinean chil‑ dren. Am J Trop Med Hyg. 2007;76:997–1008.
15. Ullah S, Gabbett TJ, Finch CF. Statistical modelling for recurrent events: an application to sports injuries. Br J Sports Med. 2014;48:1287–93. 16. Rondeau V, Mazroui Y, Gonzalez J. Frailtypack: an R package for the
analysis of correlated survival data with frailty models using penalized likelihood estimation. J Stat Softw. 2012;47:1–24.
17. Liu L, Wolfe RA, Huang X. Shared frailty models for recurrent events and a terminal event. Biometrics. 2004;60:747–56.
18. Duchateau L, Janssen P. The Frailty model. Berlin: Springer Science & Busi‑ ness Media; 2007.
19. Parpia S, Thabane L, Julian JA, Whelan TJ, Levine MN. Empirical com‑ parison of methods for analyzing multiple time‑to‑event outcomes in a non‑inferiority trial: a breast cancer study. BMC Med Res Methodol. 2013;13:44.
20. Duchateau L, Janssen P, Kezic I, Fortpied C. Evolution of recurrent asthma event rate over time in frailty models. Appl Statist. 2003;52:355–63. 21. Gabbett TJ, Ullah S, Finch CF. Identifying risk factors for contact injury in
professional rugby league players–application of a frailty model for recur‑ rent injury. J Sci Med Sport. 2012;15:496–504.
22. http://www.vliruos.be/media/74091/mid_term_evaluation_jimma_uni‑ versity.pdf.
23. FDRE. Ministry of Health: National Malaria Guideline. 3rd ed. Addis Ababa: Ministry of Health; 2012.
24. Sagara I, Giorgi R, Doumbo OK, Piarroux R, Gaudart J. Modelling recurrent events: comparison of statistical models with continuous and discontinu‑ ous risk intervals on recurrent malaria episodes data. Malar J. 2014;13:293. 25. Rondeau V, Filleul L, Joly P. Nested frailty models using maximum penal‑
ized likelihood estimation. Stat Med. 2006;25:4036–52.
26. Twisk JW, Smidt N, de Vente W. Applied analysis of recurrent events: a practical overview. J Epidemiol Community Health. 2005;59:706–10. 27. Cheung YB, Xu Y, Tan SH, Cutts F, Milligan P. Estimation of intervention
effects using first or multiple episodes in clinical trials: the Andersen‑Gill model re‑examined. Stat Med. 2010;29:328–36.
28. Guo Z, Gill TM, Allore HG. Modeling repeated time‑to‑event health conditions with discontinuous risk intervals: an example of a longitudinal study of functional disability among older persons. Methods Inf Med. 2008;47:107–16.
29. Sena L, Deressa W, Ali A. Dynamics of Plasmodium falciparum and Plasmo-dium vivax in a micro‑ecological setting, Southwest Ethiopia: effects of altitude and proximity to a dam. BMC Infect Dis. 2014;14:625. 30. MOH. National malaria guidelines. 3rd ed. Addis Ababa: Federal Demo‑
• We accept pre-submission inquiries
• Our selector tool helps you to find the most relevant journal • We provide round the clock customer support
• Convenient online submission • Thorough peer review
• Inclusion in PubMed and all major indexing services • Maximum visibility for your research
Submit your manuscript at www.biomedcentral.com/submit
Submit your next manuscript to BioMed Central
and we will help you at every step:
31. Lautze J, McCartney M, Kirshen P, Olana D, Jayasinghe G, Spielman A. Effect of a large dam on malaria risk: the Koka reservoir in Ethiopia. Trop Med Int Health. 2007;12:982–9.
32. Kibret S, McCartney M, Lautze J, Jayasinghe G. Malaria transmission in the vicinity of impounded water: evidence from the Koka Reservoir. Ethiopia. IWMI Res Rep. 2009;132:47.
33. Kibret S, Lautze J, McCartney M, Wilson GG, Nhamo L. Malaria impact of large dams in sub‑Saharan Africa: maps, estimates and predictions. Malar J. 2015;14:339.
34. Mayagaya VS, Nkwengulila G, Lyimo IN, Kihonda J, Mtambala H, Ngonyani H, et al. The impact of livestock on the abundance, resting behaviour and sporozoite rate of malaria vectors in southern Tanzania. Malar J. 2015;14:17.
35. Lin E, Kiniboro B, Gray L, Dobbie S, Robinson L, Laumaea A, et al. Dif‑ ferential patterns of infection and disease with P. falciparum and P. vivax in young Papua New Guinean children. PLoS One. 2010;5:e9047.
36. Lawpoolsri S, Chavez IF, Yimsamran S, Puangsa‑Art S, Thanyavanich N, Maneeboonyang W, et al. The impact of human reservoir of malaria at a community‑level on individual malaria occurrence in a low malaria transmission setting along the Thai‑Myanmar border. Malar J. 2010;9:143.
37. Phimpraphi W, Paul RE, Yimsamran S, Puangsa‑art S, Thanyavanich N, Maneeboonyang W, et al. Longitudinal study of Plasmodium falcipa-rum and Plasmodium vivax in a Karen population in Thailand. Malar J. 2008;7:99.
38. Maitland K, Williams TN, Bennett S, Newbold CI, Peto TE, Viji J, et al. The interaction between Plasmodium falciparum and P. vivax in children on Espiritu Santo island, Vanuatu. Trans R Soc Trop Med Hyg. 1996;90:614–20. 39. da Silva‑Nunes M, Codeço CT, Malafronte RS, da Silva NS, Juncansen C,
Muniz PT, et al. Malaria on the Amazonian frontier: transmission dynam‑ ics, risk factors, spatial distribution, and prospects for control. Am J Trop Med Hyg. 2008;79:624–35.
40. Abate A, Degarege A, Erko B. Community knowledge, attitude and practice about malaria in a low endemic setting of Shewa Robit Town, northeastern Ethiopia. BMC Public Health. 2013;13:312.