Proximity Map Projection:
Interactive Visualisation for
Image-Guided Surgery
David F. Marshall
A thesis submitted for the degree of
Doctor of Philosophy
The Australian National University
Except where otherwise indicated, this thesis is my own original work.
Acknowledgments
I would like to acknowledge Dr Henry Gardner, Professor Bruce Thomas, Dr Dun-can Stevenson, and Dr Hongdong Li for the substantial guidance and direction that they provided me with during the course of this research. Their efforts can not be overstated.
I greatly appreciate the opportunity, provided by the Macquarie University Hos-pital, to observe several surgical procedures there. Dr Andrew Davidson and Dr Celi Varol provided me with great insight into procedures relevant to my research of proximity map projection.
This research is supported by an Australian Research Training Program (RTP) Scholarship.
An earlier version of this thesis received copy-editing and proofreading by A+ Academic Editing Canberra.
My family, Jen, Al, and Liz, have been a tremendous support during this project. I greatly appreciate their tolerance of the time that I needed to dedicate to this effort.
Colophon
This thesis was typeset with LATEX 2ε. The figures were created with R and PostScript.
Most of the figures are best viewed in colour.
Abstract
This thesis describes a new interface technique for neurosurgeons and interventional radiologists performing image-guided therapies such as the ablation of brain tu-mours. This new technique is called Proximity Map Projection (PMP).
Based on an analysis of related work, including the documented recent progress in enabling technologies, a case is made that present-day interactive visualisations supporting image-guided treatment of tumors will need to be dramatically improved to take advantage of the increased image refresh rates available as soon as 2020. This probable requirement for improved visualisation technology in the very near future motivated the invention and investigation of the PMP technique described in this thesis. The PMP technique is an interactive 2-D visual projection of the proximity of two 3-D surfaces – in particular, the surface representing the boundary of a thermal treatment region, and the surface of a tumour that is the target of this treatment. By clicking on interesting points in the PMP, surgeons are able to quickly select the 2-D MRI slices corresponding to those interesting points. The PMP provides a quick way of selecting a desired image from a large stack of 2-D MRI data, thus freeing up surgeons to spend a greater proportion of their time applying their expertise to decision making, rather than to navigating through image data.
In this thesis, the PMP technique is presented and then refined as user studies are undertaken. In a series of investigations exploring its effectiveness, it is shown that the PMP technique enables non-expert users to quickly and accurately navigate to, and observe, desired individual medical images within large stacks of such im-ages. A further experiment finds no significant differences in the way that medically experienced and inexperienced users use PMP to complete tasks. That study also ver-ifies that users pay visual attention to PMP, regardless of whether or not they have interacted with it via the mouse. Observation of the visual attention of users
ing simulated tasks is used to provide further explanation of why PMP is effective. PMP’s potential to be used by medical professionals is then assessed via a series of semi-structured interviews with surgeons and interventional radiologists. Such ex-perts are found to be optimistic about the potential for PMP to be incorporated into their workflows. This last phase of the research then culminates with observations of a number of medical procedures on human patients that are similar to the kinds of procedures to which PMP might be applied. From these observations it appears that, while they do enable life-saving therapies, present software interfaces are not en-tirely satisfying for the surgeons who use them. Opportunities for significant future research collaborations were identified during these interviews and observations.
Contents
Acknowledgments vii
Colophon ix
Abstract xi
List of Figures xix
List of Tables xxi
1 Introduction 1
1.1 Motivation . . . 1
1.2 Research Question and Approach . . . 4
1.3 Thesis Organisation . . . 7
2 Literature Review 9 2.1 Introduction . . . 9
2.2 Image-Guided LITT . . . 9
2.3 Interaction Scenario for Image Guided Thermal Therapy . . . 12
2.4 Technological and Human Context of Image-Guided LITT . . . 16
2.4.1 Visualisation of LITT . . . 16
2.4.2 Human in the Loop . . . 17
2.4.3 Thermal Damage Mechanisms . . . 19
2.4.4 MR Thermometry . . . 20
2.5 System Performance . . . 24
2.6 Visualisation Studies . . . 26
2.6.1 Map Projection . . . 27
2.6.2 3-D Rendering . . . 29
2.6.3 Augmentations . . . 30
2.6.4 Other Visualisation Studies . . . 30
2.6.5 Ongoing Related Research . . . 32
2.7 Summary . . . 33
3 Proximity Map Projection 35 3.1 Introduction . . . 35
3.2 Visualisation . . . 36
3.3 Implementation . . . 37
3.4 Usage Scenario Considered . . . 38
3.5 Interaction . . . 40
3.6 Summary . . . 42
4 Navigating Proximity Data - PMP in the Static Scenario 45 4.1 Introduction . . . 45
4.2 Experimental Design . . . 45
4.2.1 Participants . . . 46
4.2.2 Tasks . . . 47
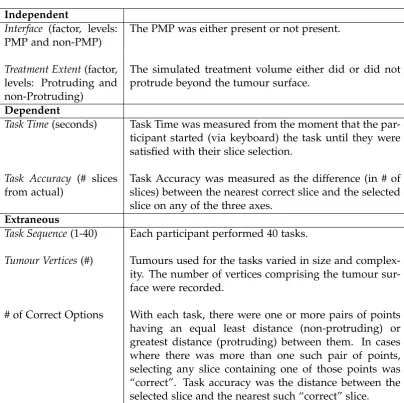
4.2.3 Study Variables . . . 48
4.2.4 Strategies for Usage . . . 48
4.3 Results . . . 49
4.3.1 Assumptions for Parametric Methods . . . 50
4.3.2 Standard Effect Size . . . 51
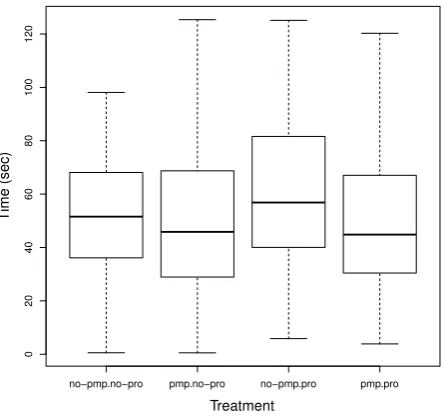
4.3.3 Completion Time . . . 52
4.3.4 Accuracy . . . 53
4.3.5 Satisfaction and Ease-of-Use . . . 55
4.3.6 User Feedback and Strategies . . . 57
Contents xv
4.4.1 Assumptions for Parametric Methods . . . 58
4.4.2 Standard Effect Size . . . 58
4.4.3 Task Completion Time . . . 59
4.4.4 Task Accuracy . . . 59
4.4.5 Satisfaction and Ease-of-Use . . . 60
4.4.6 User Feedback and Strategies . . . 60
4.5 Conclusions . . . 61
4.6 Summary . . . 62
5 Realtime Navigation - PMP in the Dynamic Scenario 63 5.1 Introduction . . . 63
5.2 Experimental Design . . . 64
5.3 Results . . . 66
5.3.1 Satisfaction and Ease-of-Use . . . 66
5.3.2 User Feedback and Strategies . . . 68
5.4 Discussion and Conclusions . . . 69
6 Inner-Dynamic vs Outer-Static Surface Projection in PMP 71 6.1 Introduction . . . 71
6.2 PMP Variant - Inner Surface Projection . . . 72
6.3 Experimental Design . . . 73
6.4 Results . . . 75
6.4.1 Satisfaction and Ease-of-Use . . . 76
6.4.2 User Feedback and Strategies . . . 78
6.5 Discussion and Conclusions . . . 78
7 Visual Attention - Medical Experience and PMP 79 7.1 Introduction . . . 79
7.2 Experimental Design . . . 80
7.3.1 Attention Transitions . . . 81
7.3.2 Attention and Interaction . . . 83
7.3.3 Attention and Medical Experience . . . 84
7.4 Discussion . . . 84
7.5 Conclusions . . . 86
7.6 Summary . . . 86
8 Interviews and Observations with Surgeons 87 8.1 Introduction . . . 87
8.2 Interviews . . . 88
8.2.1 Group Interview . . . 88
8.2.2 Individual Interviews . . . 89
8.2.3 Discussion . . . 90
8.3 Neurosurgeries . . . 90
8.3.1 Ventricular Shunt Insertion . . . 91
8.3.2 Brain Tumour Resection . . . 92
8.3.3 Neurosurgeon Interview . . . 94
8.3.4 Discussion . . . 98
8.4 Prostate Surgeries . . . 98
8.4.1 MR-Guided Prostate Biopsies . . . 99
8.4.2 MR-Guided Prostate Focal Therapy (LITT) . . . 100
8.4.3 Discussion . . . 101
8.5 Summary and Conclusions . . . 102
9 Conclusions and Future Research 103 9.1 Conclusions . . . 103
9.2 Contributions . . . 104
9.3 Future Research . . . 105
Contents xvii
9.3.2 Long-Term Goals . . . 107 9.3.3 Applications in Non-Medical Domains . . . 107 9.4 Concluding Remarks . . . 108
Appendices 109
A Code Listings 111
A.1 KDTree Search . . . 111 A.2 Colour Encode Points . . . 113
B User Study Apparatus 115
C MICCAI Dataset 117
D Common User Study Design 119
E Eye Tracking Apparatus 121
F Lap-Top vs Touch-Device Survey 123
F.1 Design . . . 123 F.2 Results . . . 124
G Participant Survey - Static and Dynamic Studies 125
G.1 Interview Guidance Questions . . . 125 G.2 Questionnaire . . . 126
H Participant Survey - Projection Study 127
H.1 Interview Guidance Questions . . . 127 H.2 Questionnaire . . . 128
Glossary 129
List of Figures
1.1 Thermal Therapy . . . 2
1.2 Navigation Problem . . . 3
1.3 Research Approach . . . 6
2.1 Research Context . . . 12
2.2 Image Guided Tissue Therapy . . . 13
2.3 Obscured Data . . . 15
2.4 LITT Schematic . . . 16
2.5 Temporal Resolution Timeline . . . 22
2.6 An Evaluation Framework . . . 25
2.7 Cylindrical Map Projection of the Earth . . . 27
3.1 Proximity-to-Colour Scale . . . 37
3.2 Standard Anatomic Orientations . . . 38
3.3 Experimental Software . . . 39
3.4 Tumour Boundary . . . 40
3.5 PMP Schematic . . . 42
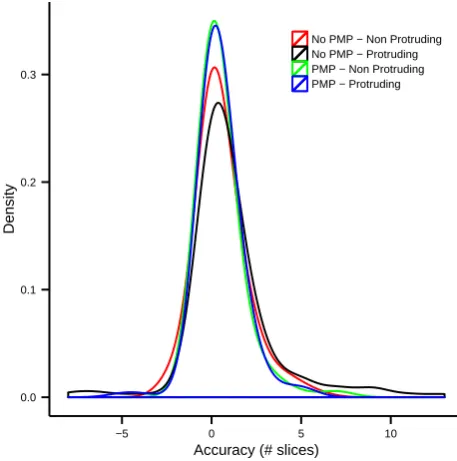
4.1 Task Time and Selection Accuracy . . . 49
4.2 Normality of Accuracy . . . 50
4.3 Completion Time by Condition . . . 52
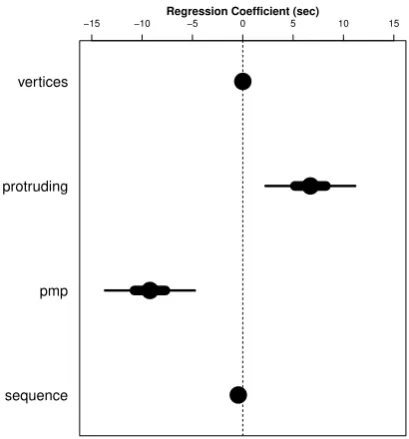
4.4 Coefficients (Completion Time) . . . 53
4.5 Accuracy by Condition . . . 54
4.6 Coefficients (Accuracy) . . . 55
4.7 Satisfaction . . . 56
4.8 Ease-of-Use . . . 56
4.9 Tumour Boundary . . . 58
5.1 PMP Example (Updates) . . . 65
5.2 Normality of Accuracy . . . 67
5.3 Selection Accuracy . . . 67
5.4 Satisfaction . . . 67
5.5 Ease-of-Use . . . 68
6.1 Inner vs Outer Projection . . . 72
6.2 PMP Example (Updates) . . . 74
6.3 Normality of Accuracy . . . 75
6.4 Selection Accuracy . . . 76
6.5 Satisfaction . . . 77
6.6 Ease-of-Use . . . 77
7.1 Interface Regions . . . 82
7.2 Transfer Matrix (Overall) . . . 82
7.3 Transfer Matrix (Strategies) . . . 82
7.4 Attention by Active/Passive . . . 83
7.5 Transfer Graph . . . 84
7.6 Attention by Experience . . . 85
8.1 Example DVH . . . 96
C.1 MICCAI Data Example . . . 117
List of Tables
2.1 Thermal Damage Mechanisms . . . 19
3.1 PMP Design Decisions . . . 43
4.1 Study Design . . . 47
4.2 Static Study Variables . . . 48
Chapter1
Introduction
1
.
1
Motivation
This research project was initially motivated by the author’s industry experience, where he worked for four years (from 2007 until 2011) as a software developer con-tributing to the NeuroBlate system with Monteris Medical Incorporated. Two prob-lems emerged from this experience in relation to user scenarios for the use of visu-alisations within image-guided medical therapies (described in more detail below). In abstracted form, these problems were: firstly, “How can a user effectively monitor
the changing proximity of two 3-D surfaces when one is predominantly enclosed by the other?” and secondly, “How can the efficiency of navigationthrough a treatment volume be improved?”
Throughout this thesis, three terms are used that may be understood differently in different fields of expertise, but that should be understood, in this discussion, as follows. Focal therapyinvolves the focus of an energy source onto a tissue target, the principle action of which may or may not be heat (e.g. laser, ionizing radiation).
Hyperthermiarefers to knowledge concerning the response of tissue to elevated
tem-perature, and includes therapies that involve such elevated temperatures. Thermal
therapy is a form of hyperthermia, and commonly refers to therapies such as heat
ablation (destruction). The technique described in this thesis was developed to be applied to focal therapy, but was examined predominantly in a thermal therapy sce-nario. A discussion of hyperthermia is required, in order to adequately understand an important factor that influences thermal therapy systems.
In the medical context considered throughout this thesis, one of these surfaces is the boundary of a tumour and the other is the boundary of a treated tissue region. The treatment boundary is commonly defined as a quantity of accumulated ther-mal energy. Navigation through the treatment volume corresponds to navigation through a collection of 2-D magnetic resonance imaging (MRI) cross-sections familiar to surgeons. This navigation is guided by the proximity of the two surfaces, and the relative proximity of these surfaces informs the surgeon’s decisions about the progress of treatment. One of the motivations for more efficient navigation is to enable a surgeon to spend more time applying their expertise to making clinical de-cisions, and less time navigating a software interface. The application of focal therapy considered is MR guided (MRg) thermal therapy, specifically laser interstitial thermal therapy (LITT).
MRg thermal therapy involves treating a volume of tissue by applying heat, as illustrated in Figure 1.1. With such therapy, it is desired that the treatment volume matches the target volume (tumour) as closely as possible. The treatment volume and the tumour volume can both be represented by 3-D surfaces, and their prox-imities can be calculated. During treatment, those inter-surface proxprox-imities would be continually changing, and regularly updated for the user. Effective monitoring is needed and this is typically carried out by looking at sets of 2-D surface projections.
§1.1 Motivation 3
Surgeons are accustomed to analysing volumetric image data by looking at 2-D slices through that data (see Figure 1.2)[1]. While 2-D slices provide a detailed-view for a subset of a volume of data, they lose overview-level information about the whole volume. They also introduce the challenge of navigating between the slices.
In recent times, improved understanding of thermal damage mechanisms, and improvements in the underlying algorithms for MRI imaging (leading to faster image refresh rates), both motivate the need for improved methods for the interactive visu-alisation of MRg focal therapy. Constructing new interactive visuvisu-alisation interfaces for such systems might be thought of as a challenge in human computer interaction (HCI). The following are interrelated aspects of this HCI challenge: Real-time Visual-isation, Human Factors, Thermal Damage Mechanisms, and MR Thermometry.
The abstract problem underlying the research in this thesis can be described as monitoring the changing proximities of two 3-D surfaces, and selecting 2-D slices from the volumetric data describing those surfaces. The changing images will be available to users in regular refreshes, between which the images are static. Surgeons may need to estimate when to cease treatment based on their understanding of static images (a “static scenario” involving the interpretation of the images obtained
lowing a refresh) or based on changing images (a “dynamic scenario” when the time rate of change of certain images might be used to estimate when to cease treatment). In both scenarios, a surgeon needs to navigate across a large stack of 2-D images and good interfaces will enable users toselect appropriate images quickly and accurately. In the static scenario, the principal concern ishow quicklya user might select a “good enough” 2-D image, in order to make a therapeutic decision. In the dynamic scenario, time is constrained bymagnetic resonance (MR) system refresh rates (of the order of one second). In such a scenario, it is important to have the best possible image projections in order to monitor the time-rate of change of such images.
In both static and dynamic scenarios, there is a need for interaction techniques that enable quick and accurate 2-D image selections (from a data stack comprising a large number of such images). The interaction technique of central concern in this thesis is one where a “map projection” of the two 3-D surfaces of interest is used to enable navigation through the stack of 2-D images.
1
.
2
Research Question and Approach
The main research question of this thesis is: Can an interactive map projection technique support more effective performance for MRg therapies, compared with
contemporary interfaces?
To answer this question, this thesis presents a new interaction technique known as
proximity map projection (PMP). Through a process of human-factors experimentation
§1.2 Research Question and Approach 5
As described in subsequent chapters of this thesis, the overarching research ques-tion is investigated by examining a number of smaller, specific quesques-tions. For reasons of consistency, these questions can be formulated as the “hypotheses” shown below:
Hypothesis 1 PMP will decrease the selection time of 2-D slices from volumetric MR data.
Hypothesis 2 PMP will increase selection accuracy of 2-D slices from volumetric MR data.
Hypothesis 3 Users will find PMP easier to use.
Hypothesis 4 Users will find PMP more satisfying to use.
Hypothesis 5 Medically experienced users will use PMP with different visual strategies.
Hypothesis 6 Surgeons will see PMP as a potentially desirable part of their workflows.
Hypothesis 7 A (more quickly computed) PMP projection of the inner (smaller) surface will
not decrease 2-D slice selection accuracy
The strategy followed to answer the overarching research question via these spe-cific hypotheses is a mixture of experimental research and situated interviews and observations based on case studies. The experimental research is based on formal HCI experimentation designed to address both the human and computational per-formance aspects of monitoring MRg therapies.
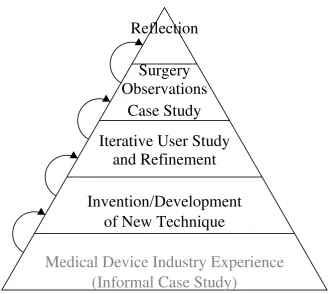
The main phases of the research approach of this thesis are shown in Figure 1.3. Prior to formal commencement of this research, the author gained experience as a software engineer, working with Monteris Medical Inc [7], who developed the Neu-roBlate system. This real-world experience familiarised the author with the context of MRg laser therapy and acted as an “informal case study”, suggesting that an interac-tion technique like PMP could be of use for the future development of such systems. During the course of this research program, an initial PMP prototype technique was developed “in the laboratory”. This prototype then became further developed and it-eratively refined using HCI experimentation (also “in the laboratory"). As a capstone, surgical therapies to which PMP might be applied were then observed and reflected on in order to once again position the PMP technique, and the overall research, in the real world.
(Informal Case Study)
Medical Device Industry Experience
of New Technique
Invention/Development
and Refinement
Iterative User Study
Case Study
Observations
[image:28.595.112.446.409.703.2]Surgery
Reflection
§1.3 Thesis Organisation 7
1
.
3
Thesis Organisation
This thesis is structured following the phases of research that were carried out on the PMP technique. Portions of Chapters 2, 3, and 5 have previously been published in Marshall [8] and Marshall et al. [9].
• Chapter 2presents a literature review, describes the background of the research questions, and addresses the urgency of answering those questions.
• Chapter 3 describes the PMP technique and prototype software developed to investigate the challenge revealed by the above analysis.
• Chapters 4 and 5describe studies that were conducted to investigate the effec-tiveness of PMP when used by medically inexperienced users on tasks similar to those that might be encountered during image-guided focal therapy.
• Chapter 6describes an investigation of an opportunity to increase the compu-tational performance of the PMP prototype by projecting the (inner) treatment surface rather than the (outer) tumour surface. This increased speed is neces-sary for achieving refresh rates closer to that which would be predicted to be required in the future (of close to once per second).
• Chapter 7describes a user study conducted to further investigate how partic-ipants used the second variation of PMP. That study led to a deeper under-standing of why PMP enabled users to be quicker and more accurate.
• Chapter 8describes interviews with surgeons and observations made of their procedures. Having learned about PMP’s effectiveness with medically inex-perienced users, a case study involving medical professionals was conducted. Several surgeons and radiologists were interviewed, and a number of proce-dures were observed, involving image-guidance for which PMP might be used.
Chapter2
Literature Review
2
.
1
Introduction
This chapter describes HCI support for surface proximity monitoring during image-guided focal therapy procedures. Sections 2.2 and 2.3 provide a background to image-guided focal therapy, including a thermal therapy interaction scenario and the potential role of software visualisations in support of such a scenario. Sections 2.4 and 2.5 discuss a range of human and technological factors influencing the evolu-tion of focal therapy systems, and update an earlier predicevolu-tion that was made by the author regarding the future evolution of such systems[8]. Section 2.6 reviews the use of map projections and related visualisation technologies in medicine, with a focus on the problem of determining the proximity of two surfaces.
2
.
2
Image-Guided Focal Therapy
Image guidance can be used before, during, and after surgical procedures. Appli-cations of image guidance before and after needle-based radiofrequency ablation (RFA), for planning and outcome assessment, are reviewed by Rieder [10]. Image guidance is also used during surgical procedures (interoperatively) for real-time feedback and control [11] and it it thisintraoperativeuse of image guidance that is the focus of this thesis. Many medical device manufacturers offer image-guided therapy systems, in-cluding Philips (Azurion), GE Healthcare (ASSIST), Siemens (ARTISTE), Medtronic (Visualase), and Monteris Medical (NeuroBlate).
Intraoperative image guidance provides real-time, or near-real-time, feedback during medical procedures. In the case of thermal therapies, heat is applied (by various means, including laser and radio frequency) in order to create alesion(in or-der to, for example, destroy cancerous tissue). MR thermometry (discussed in detail in Section 2.4.4) can be used to intraoperatively estimate the temperature of tissues. Tissue destruction is not immediately evident during therapy and may occur some time after the treatment. Eventual tissue destruction can be predicted by monitoring the accumulated application of heat to that tissue. Because of this, accurate real-time monitoring of thermal dose accumulation is important.
Thermal therapy involves an application of heat to a target region in order to pro-mote cell death. The specific method of heat application varies across different ther-apies, such as: laser, radio frequency, orultrasound. An example of laser delivered thermal therapy is MRg LITT, and two commonly used systems are the Visualase Thermal Therapy System[12], and the Monteris Medical NeuroBlateR System[13].
Both of these systems are minimally-invasive procedures, where an incision or entry is made through the patient’s tissue. Examples of radiofrequency-delivered thermal therapy are the Medtronics Cool-tipTM, AngioDynamic 1500X, Boston Scientific RF
3000TM, and Celon CelonPower[14] systems. All of these procedures destroy tumours
by ablative heating. An example of ultrasound-delivered thermal therapy, which is completely non-invasive, is MRgfocussed ultrasound (FUS)[15].
Improved accuracy and timeliness of decision-making during focal therapy sup-ports more thorough treatment of tumours, reduced unintended damage to sur-rounding tissue, and reduced length of procedures. The essential decision point
is when to halt treatment: treating too much might result in unacceptable damage
§2.2 Image-Guided LITT 11
MRI has been increasingly used to guide and assess the progress of surgeries over the last 20 years[17]. Quesson et al. [18] provides an overview of MR thermometry methods used in applications such as focal therapy. In addition to differentiating between tissues, MR is also capable of measuring temperature and has been shown by Fan et al. [19] to provide a major advantage in the monitoring and control of LITT. Image-guided focal therapy is an increasingly common feature of modern surgical practice, particularly for the treatment of tumours[19, 20] and Lewin et al. [21] found that interactive MR image-guidance enabled a high success rate (for treatments using
radiofrequency ablation (RFA)).
The use of intraoperative imaging has increased dramatically over the past 20 years. Carpentier et al. [12] stated that LITT (which provides the primary motivation for the present research) provides a new and efficient treatment for focal metastatic brain disease. Other medical procedures using real-time image-guidance include:
high intensity focussed ultrasound (HIFU)and RFA. Image guided focal therapy can be applied other than in the brain, such as the kidney[21], liver[22], and prostate[23], as well as for purposes other than cancer treatment, such as epilepsy control[24]. Section 8.4 describes observations of MRg LITT applied to prostate tumours.
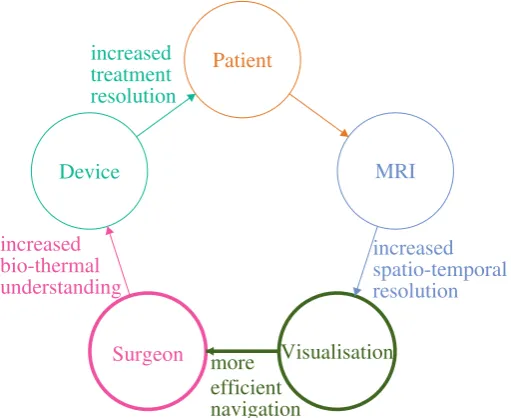
While the interaction of the components in such systems is complex, a simplified perspective is illustrated in Figure 2.1. The components: MRI, visualisation, surgeon, device, and patient, are depicted in a “loop”, each enabling the next step in the process. Links between those components show that, for example, a new device technology may provide increased treatment resolution. This research is focussed on the provision of an effective visualisation of medical image data to surgeons during therapies (at the bottom of the figure).
2
.
3
Interaction Scenario for Image Guided Thermal Therapy
As discussed above, 3-D MRI data can be used to guide the thermal treatment of brain tumours[26]. Systems using 3-D MRI require a surgeon to monitor the prox-imity of a growing treatment volume to the boundary of a tumour, while applying their expert judgment to critical decisions about when to stop a thermal application. The real-time nature of such a task, and the potential impact of inaccuracy on the patient, make a strong case for an interactive visualisation that enables a quick and
Patient
increased treatment resolution
Device
increased bio-thermal understanding
Surgeon more
efficient navigation
Visualisation
[image:34.595.151.407.482.691.2]increased spatio-temporal resolution MRI
§2.3 Interaction Scenario for Image Guided Thermal Therapy 13
accurate exploration of the data. Such an interface should, ideally, allow the user to spend as much time as possible applying their expert domain knowledge, rather than consuming unnecessary time navigating to regions of interest within that data. This section describes a typical interaction scenario that would involve such an interface.
An interaction scenario for image-guided thermal therapy is one where a sur-geon activates a heat source while monitoring thermometry imagery for indications that cell death has been initiated. Once satisfied that a sufficient thermal dose has been applied, the surgeon may reposition the source in order to treat a different re-gion. With each positioning of the source, the surgeon must decide for how long to apply heat. As represented in Figure 2.2, the goal is to grow a heat treatment vol-ume to the boundary of a tumour (green) and to avoid under-treating (blue) which would require re-treatment, or over-treating (red) which would result in the damage of healthy tissue. The treatment volume (bearing in mind that cell-death is not imme-diately evident) is some probability that cell damage has occurred. Although Figure 2.2 presumes a single treatment surface, multiple “probability surfaces” might be
de-sensitive Brain
Tumour
over-treat
under-treat
optimally-treat
fined, expressing a range of acceptable damage probabilities. Treatment in a single start-stop sequence is important because of theheat-shockeffect, which can make cells less sensitive to further heating[27].
MR data acquired to monitor thermal therapy treatment is commonly presented as 2-D slices in three anatomical orientations: sagittal,coronal, andaxial. In comtem-porary LITT procedures, these image sets can be refreshed every ten seconds[26]. Typical thermal application times, for each positioning within a LITT procedure, range from one to three minutes[12]. The number of individual positionings depends upon tumour complexity, the heat propagation shape of the applicator, and sensitive anatomy near the treatment volume. A more complex tumour shape may require more individual positionings. An applicator with a more directional heat propaga-tion shape may be better able to “sculpt” complex target volumes, resulting in fewer positionings. The presence of sensitive anatomy near the tumour may require more positionings to avoid over-treatment. The thermal image guided portion of a typical thermal therapy procedure can take between 5 minutes and 1 hour. Carpentier et al. [28] reported image guided treatment times between 7 and 52 minutes.
The interaction scenario involves a surgeon closely monitoring a set of changing medical images as they stop and start thermal treatment. In order to best inform a clinical decision to stop heat application, the surgeon typically needs to navigate
through the 2-D thermometry images to select those most accurately showing the region where the treatment and tumour boundaries are closest to each other.
§2.3 Interaction Scenario for Image Guided Thermal Therapy 15
of transparency. In the case of the challenge addressed by PMP, the data of primary interest lies at the surface of the volume. Requiring a surgeon to view “back” surface data through “front” surface data was not considered to be a satisfying solution.
When one considers, for example, a 3-D view of a sphere’s surface, only half of the surface may be visible at one time. With 3-D rendering, the user must navigate a screen object to rotate the obscured data into view. When one instead considers a stack of n 2-D slices through a sphere, with m slices visible at one time, each slice shows the perimeter of the sphere at one point on an axis. In that case, roughly m/n of the available surface information will be visible at one time. If (m = 3) slices are visible at a time and there are (n = 30) or more slices in the stack, as is common, then 10% or less of the surface data may be visible at one time. This can be seen in Figure 2.3. With such stacked images, the user gains information about the space neighbouring the surface but their view is limited to a small number of images at any one time and they must move back and forth between those images. The prospective advantage of the PMP technique, central to this thesis, is that it provides the user with complete, simultaneous perception of the proximity of the two surfaces.
Figure 2.3: Obscured Data - This image illustrates the data obscured using a 3-D volume visualisation (left) and stacks of 2-D slices (right). Visible data is shown in
2
.
4
Technological and Human Context of Image-Guided LITT
Medical therapy systems are complex interactions of multiple contributing technolo-gies, knowledge areas, and human performance factors. MRg therapeutic lesion formation is no exception. This section describes some of the influences on the per-formance of MRg therapeutic lesion formation systems.
2.4.1 Visualisation of LITT
LITT involves the laser heating of tissue, such as a brain tumour, to the point of causing cell death by mechanisms including coagulation and ablation. This area of dead tissue is known as a therapeutic lesion. LITT is a well-established treatment methodology. A LITT system includes a laser, optical fibre, and probe for direction of the energy. An MRg LITT system, in addition, includes an MR system, software, and hardware to visualise and control the progress of the treatment. Figure 2.4 is a schematic illustration of such a system.
As early as 1998, Skinner et al. [20] identified that interstitial heating had become the most commonly used method of heating tumours. This approach has continued to be refined. In 2010, Tyc and Wilson [26] reported that NeuroBlateR allows
sur-geons to selectively direct the thermal treatment, depending upon the specific nature of the tissue in the target area. The ability to selectively direct thermal treatment is
MR System
Visualisation and Control Laser System
Brain Tumour
§2.4 Technological and Human Context of Image-Guided LITT 17
important because the characteristics of tissues within the target may vary. For exam-ple, some portions of the target may contain greater vasculature (i.e. blood vessels), which dissipate heat. Other portions of the target may be nearer to neighbouring tissue, damage to which would be detrimental to the patient’s quality of life.
It is important to note that lesion formation and therefore, cell death, do not necessarily occur during the timeframe of the treatment itself. Actual lesion for-mation lags behind the application of heat. It is, therefore, critically important to be able to monitor the accumulated application of heat in real-time. The effects of over-treatment would, otherwise, only become apparent after it is too late.
Once heat has been applied, and a lesion has started to form, the thermal char-acteristics of the heated region will differ from surrounding tissue. This makes it difficult to apply a precise follow-up dose to an already-heated area. It is desirable to start and stop heating of a given region once, rather than stopping and deciding it is necessary to extend the heat application. This necessitates accuracy in the vi-sual monitoring. Since the lesion and tumour volumes can be irregularly shaped, and since the lesion volume’s growth is unpredictable, monitoring the convergence of the surfaces of these two volumes is a non-trivial visualisation task. The research problem here is to address the foreseeable challenges affecting this visualisation task.
2.4.2 Human in the Loop
Pretlove and Skourup [29] discussed issues surrounding decision support sys-tems and the shifting role of the human in the loop towards supervision and excep-tion control. Chen et al. [30] examined more than 150 papers investigating human performance issues. They were particularly concerned with teleoperated robots, not limited to medical device systems. Their suggested mitigations included stereoscopic displays, information overlays, and decision support systems. Carriere et al. [31] re-cently investigated the use of a 3-D model of a prostate biopsy needle’s tip, to assist with accurate needle trajectory. The surgeon was responsible for needle insertion, while the device system kept the needle on the intended trajectory.
The effects of cognitive load and a surgeon’s age on performance are particu-larly important in the context of monitoring therapeutic lesion formation. Surgery is an inherently busy task, which increases the cognitive load on surgeons performing visual tasks on a computer screen. Holland[32] found that busier people showed de-creased static and dynamic peripheral visual acuity. This could impact the ability of surgeons to detect important details in areas outside of their central focus. The need to design interfaces for high cognitive loads has been recognised. Research suggests that technologies should be designed to support human attentional processes[33] and that interfaces for radiologists should eliminate as many distractions as possible[34].
§2.4 Technological and Human Context of Image-Guided LITT 19
2.4.3 Thermal Damage Mechanisms
The mechanisms by which heat damages tissue are complex, and include the coag-ulation of blood, carbonisation of tissue, and increased sensitivity tocytotoxicdrugs. In the case of LITT, the primary mechanism of cell death near the centre of the treat-ment volume (or centre of heat application) is coagulation. Table 2.1 summarises the categories of mechanisms by which elevated temperatures cause damage to human cells. Not all of these categories of damage occur with LITT, such carbonisation.
Cumulative equivalent minutes at43◦C(CEM43)is a widely-used measure for com-paring accumulated thermal dose between therapies with different temperature pro-files. CEM43 is discussed in detail by Sapareto and Dewey [40] (1984) and is defined below. CEM43 accumulates more slowly below, and more rapidly above, 43◦C, re-sulting in plot lines with an inflection point at 43◦C. This can be seen in Figure 2.6. In practice, this formula only applies to temperatures above body temperature. Temperatures below 42◦C may take more than an hour to cause damage.
CEM43= R(43−temperature)×minutes
whereR=0.25, iftemperature<=43◦C
orR=0.5, iftemperature>43◦C.
Table 2.1: Thermal Damage Mechanisms - Mechanisms by which elevated tempera-tures cause damage to human tissue, as summarised by Okhai and Smith[39].
Temperature Thermal Damage Mechanism
<42◦C Cells die after a relatively long period of time ('60 minutes).
42◦C - 45◦C Cells become more susceptible to chemotherapy and radiation.
≥46◦C Irreversible damage depends on duration of thermal dose.
50◦C - 55◦C Irreversible damage occurs in four to six minutes.
60◦C - 100◦C Irreversible damage occurs almost instantaneously.
In his discussion of standard ways to calculate thermal therapy dosage, Atkinson[41] (1977) predicted that numerical values for cytotoxicity will improve as clinical expe-rience increases. This anticipated improvement of our understanding of thermal damage mechanisms is one of the factors that will drive the need for better inter-faces and improved thermal measurement. Numerous studies[42, 43, 44] (circa 2003) demonstrate sigmoidal curves with a steep increase in cell death at a certain accu-mulated thermal dose. Despite the amount of research effort that has been applied to these processes, Milleron and Bratton [45] (2007) found that the mechanisms of heat-shock-induced cell death remain poorly understood.
As of 2018, there continues to be great research interest in therapeutic lesion formation (or focal therapy), such as by Onik [46]. As our understanding of this in-teraction is refined, one would hope that heat will be applied with smaller tolerances for error. For example, if we desire an accuracy of plus or minus half a CEM43, rather than plus or minus two CEM43, then we would need an interface that allows us to monitor heat application with that level of accuracy.
2.4.4 MR Thermometry
§2.4 Technological and Human Context of Image-Guided LITT 21
of tissue, the resolution of imaging, the physical acquisition method, the algorithm used to interpret the radio-frequency signals, and the computer hardware capability.
In 1982, when human MR imaging was in its infancy, image acquisition times ranged between 1 and 30 minutes, depending on the technique[49]. Over the subse-quent decade, acquisition times in similar circumstances have fallen below 1 minute. Temperature mapping by MRI was first reported in 1983 by Parker et al. [50]. Parker’s experiments involved 1 minute acquisition times and images containing cylinders ap-proximately 2.5cm by 10cm. In 1985, Haase et al. [51] invented a new sequence for MRI acquisition, calledfast low angle shot (FLASH), which reduced acquisition times by a factor of 100, compared to what was available in 1985[52].
New techniques have continued to improve MR thermometry refresh rates. As of 2012, multiple studies had demonstrated MR thermometry acquisition times of one second or less for images of the approximate size used in thermal therapy[53, 54]. Acquisition times are proportional to the number of voxels scanned, and Yuan et al. [55] (2012) point out that reduced field of view scanning can reduce acquisition times. Uecker et al. [52] (2012) list factors affecting progress in MR acquisition times over the previous two decades, including improvements to: magnetic fields and coils; parallel algorithms; spiral and radial encoding; and, mathematical methods.
The potential of multiplegraphics processing unit (GPU)processing continues to be taken advantage of by an increasing number of medical imaging modalities such as, for example, ultrasound[56]. Parallel computing can reduce the processing time for some acquisition methods, but Uecker et al[52] stated that (as of 2012), while some MR vendors supported the use of a single GPU, none supported multiple GPUs.
In 2013, Sloan et al. [11] described NeuroBlateR as refreshing thermometry at
The combination of technologies involved in such medical device systems is com-plex, and precise estimates of their rates of development are likely to be difficult to achieve. Gillam et al. [58] discussed the accelerating rate (over the past 2500 years!) at which medical discoveries become widespread medical practice. Extrapolating this trend, they claim that an “instantaneous” translation of medical knowledge into practice may be inevitable by about 2025.
While this prediction does not directly relate to technology development in the context of PMP, it does suggest that the time-pressures on developing techniques such as PMP might increase. In their treatment, Gillam et al. [58] examined the adoption of medicalknowledge, while this section discusses the adoption oftechnology. Medical knowledge motivating the use of therapies to which PMP might be applied has already moved from discovery into practice. Rather than trying to make a precise prediction of technology progressions, an approach is taken, in this section, of using comparable technology examples to establish upper and lower time bounds.
In 2014, the problem was considered by using the pace of development in anal-ogous situations to arrive at likely upper and lower bounds for the timeframe[8]. Bounding in this way gives a useful idea of the likely timeframe, without trying to be unrealistically precise. As an estimate of the lower bound, the development of the NeuroBlate system itself was considered. The prototype system for NeuroBlateR
was completed four years after Monteris Medical was formed and the first com-mercial use of the system occurred seven years after that. This suggested that an improved visualisation might be required within as little as four years. Figure 2.5 shows how temporal resolution has developed over the past 40 years.
1980 1990 2000 2010 2020
60-180s 8s 1-2s ?s
Figure 2.5: Temporal Resolution Timeline - The temporal resolution demonstrated in different years is shown, beginning in 1982 (1 to 3 minutes), including 2013 (8
§2.4 Technological and Human Context of Image-Guided LITT 23
As an estimate of the upper bound, the development of MR technology as a whole, was considered. The development and commercialisation of an entire system of technological components, such as MRI, would be expected to take longer than the development of novel uses of such a system. A United States Congressional re-port on super-conduction commercialisation noted that it took 38 years to go from scientific discovery to commercialisation of MR[59]. A quarter of that time (approx-imately 10 years) was taken with hardware engineering alone. Advancements such as faster acquisition times for thermometry use existing MR hardware, benefiting from completed work. When a given MR thermometry refresh rate is demonstrated to be possible in the laboratory, 10 years can reasonably be considered as an upper estimate for the potential commercialisation of such a rate.
Two years after the 2014 estimate[8], a review of published progress in the field shows that techniques (using PRF) enabling MR thermometry acquisition times in the order of 1 second have been demonstrated in the laboratory during the previ-ous 5 years. As of 2016, Wang et al. [60] showed improved temperature accuracy in the presence of motion, at acquisition rates of approximately 2 seconds. As of 2016, NeuroBlateR and Visualase continued to be the two main commercially used MRg
LITT systems[61]. Furthermore, in 2016, NeuroBlateR appears not to have
appre-ciably increased the refresh rate of thermal data, and continues to use the same MR thermometry method as in 2013 (T1 magnitude image evaluation - FLASH 2-D)[62].
All of the necessary technologies are in place to support real time MR thermom-etry of thermal therapy at temporal resolutions in the order of one second for typical image acquisiations. With the addition of multi-GPU support and parallel processing by manufacturers, as well as reduced field of view imaging, thermometry updates for systems such as NeuroBlateR could be reduced to as little as 1-2 seconds. It
2
.
5
System Performance
Having discussed the contextual influences in Section 2.4, this section will discuss the combined implications on MRg thermal therapy performance.
MRg thermal therapy systems have an image update time which is presently in the order of several seconds. During this period of time, a thermal dose can accumulate without evidence of cell-death immediately showing up in the images, which can be unsafe. In order to address this safety issue, current systems monitor the accumulation of thermal dose in order to predict the probability of cell-death, rather than wait for the indications of cell-death having occurred.
Monteris Medical has demonstrated that surgeons, using the NeuroBlateR
sys-tem, can effectively deal with today’s quality of information being updated at eight second intervals[11]. This section describes the ways in which that performance space may be expanded when, for example, MR is able to deliver faster image updates.
Temperature at the periphery of the target treatment volume is a key factor in the performance space within which thermal therapy systems operate. The periphery represents an expanding region of cell-death. Regardless of instantaneous tempera-ture, tissue death becomes more likely with a greater accumulated thermal dose. A safety margin of two CEM43 has previously been identified[11]. Van Rhoon et al. [63] suggests that actual safety margins might be as high as 2 - 9 CEM43.
§2.5 System Performance 25
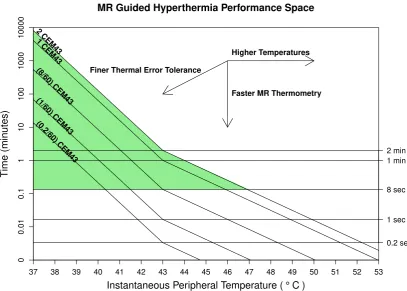
MR Guided Hyperthermia Performance Space
Instantaneous Peripheral Temperature ( ° C)
Time (min utes) 2 CEM43 1 CEM43 (8/60) CEM43 (1/60) CEM43 (0.2/60) CEM43
Faster MR Thermometry Finer Thermal Error Tolerance
Higher Temperatures
37 38 39 40 41 42 43 44 45 46 47 48 49 50 51 52 53
[image:47.595.114.522.110.401.2]0 0.01 0.1 1 10 100 1000 10000 0.2 sec 1 sec 8 sec 1 min 2 min
Figure 2.6: An Evaluation Framework - The x-axis shows the temperature. The y-axis shows time. Five curves, representing different amounts of thermal dose, are plot-ted. 2 CEM43 (the top curve) is a commonly-used thermal error tolerance. The green shaded region represents the parameters within which current hyperthermia systems operate (i.e. with desired thermal error tolerance ≤ 2CEM43 and thermometry ca-pable of being delivered not faster than every 8 seconds.) The three arrows indicate the effects that temperature, time, and thermal error tolerance have on the operating range of device systems. Increased operating temperature, faster MR thermometry, or finer thermal error tolerance, all increase the range of conditions in which the
system may need to operate.
The area above the eight second line represents the performance space within which current systems such as NeuroBlateR operate. The area between the eight
would not be able to react quickly enough to such information. Such a performance space would require a change in responsibilities, with the focus of the “human in the loop” shifting further towards supervision and exception handling.
Essentially, a typical hyperthermia system performs within the green region of the graph. As the capabilities of the system progressively increase, however, con-temporary visualisations become increasingly insufficient to the task (below and to the right of the green area). An increasing understanding of thermal damage mecha-nisms might affect the desired thermal error tolerance (2 CEM43 in this case). It might also limit the maximum peripheral temperature as a result of limiting the maximum tolerable amount of thermal accumulation between thermometry refreshes.
An example of how this figure may be used: If the system delivers thermal dose refreshes at eight-second intervals and the surgeon desires to apply heat with an accuracy of plus or minus 2 CEM43, then the maximum peripheral temperature fitting within these parameters would be approximately 47◦C. With time, the bottom of the green region can be expected to move downwards. The question, in this performance space illustration, is: How closely can the current refresh rate approach one second, before the surgeon starts to have difficulty dealing with that rate of information flow using contemporary interfaces? It is the objective of this research to be prepared for that time, by providing the “new contemporary” interface.
2
.
6
Visualisation Studies
§2.6 Visualisation Studies 27
2.6.1 Map Projection
Map projection is the projection of data from one space into another space. Such projections are commonly performed in order to facilitate the perception of the data by users. Typically, the projection is onto a surface of lower dimensionality such as a 2-D plane. Although, in the general sense, these surfaces need not be in Euclidean space, this research is particularly concerned with surfaces existing in physical 3-D space. A rectangle on a 2-D plane is easily visualised on a computer display, and is an efficient shape in a windowed environment.
There are, theoretically, an unlimited number of data projection methods. Snyder [64] described more than 200 cartographic projections used between the 15thand 20th
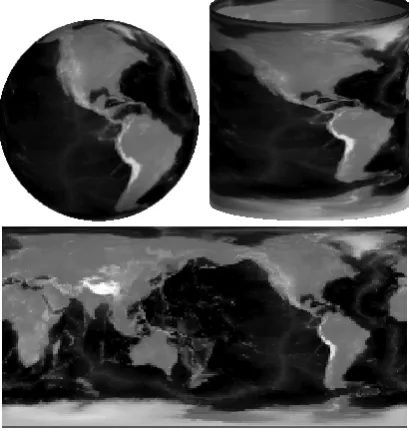
centuries. All projections have some distortion. Projections can be differentiated from each other by where they minimise distortion, as well as computational complexity. Figure 2.7 is an example of a basic cylindrical projection. Such a projection has both low computational cost and high familiarity to users.
[image:49.595.216.421.471.687.2]“Texture-mapping”, a range of techniques using patterns and images to enhance
Figure 2.7: Cylindrical Map Projection of the Earth - A projection of grey-scale en-coded elevations is projected onto a cylinder and flattened into a 2-D rectangle. This
3-D graphics, may be a source of alternate mapping techniques. Heckbert [65] pro-vides a useful survey of techniques. Texture-mapping techniques might be investi-gated in a future study of alternate projection methods, as described in Section 9.3
The use of map projection is becoming increasingly common in medical software. Minoshima et al. [66] (1995) applied “Three-DimensionalStereotacticSurface Projec-tion” (of brain image data) to alzheimer’s disease diagnosis. This involved trans-forming points on an actual brain surface to points on a standard “atlas” of a brain surface. Haker et al. [67] (2000) developed virtual colonoscopy, projecting computed tomography (CT) data of the colon onto a flat surface. This used variations of colon to cylinder and cylinder to plane projections. Kanitsar et al. [68] (2002) developed
curved planar reformation (CPR)for displaying tubular structures projected onto a flat surface. CPR was used to project a tube-like structure onto a plane which was then curved in one dimension and flattened. Scheef et al. [69] (2003) used a projection method for functional MR image data in order to preserve “the spatial relation of
eloquentareas to lesions. Curved Surface Projection is similar to CPR. Uwano et al. [70] (2008) used “Stretched” CPR to provide a flat view of the brain surface. With the exception of Minoshima et al. [66], all used a method related to CPR, which is a generalisation of a cylindrical projection (a cylinder being a curved surface).
§2.6 Visualisation Studies 29
Inter-surface proximities are what is expected to be encoded at surface points and, therefore, in a map projection. Efficiently storing 3-D points, and finding the nearest point in a surface to another point, will be important. This problem is referred to as a “nearest-neighbour” search. While more efficient algorithms have been identified for nearest-neighbour search in high-dimensional space[71], the K-D Tree algorithm[72] performs adequately for points in 3-D space.
2.6.2 3-D Rendering
Tory et al. [73] (2006) described experiments using a range of 2-D, 3-D, and 2-D - 3-D combination interfaces. They found that the interface that performed best depended on the nature of the task. Some 3-D interfaces allowed quicker task completion while some 2-D interfaces facilitated greater accuracy. Similarly, PMP was designed to facil-itate a specific category of tasks. PMP is designed to enable faster and more accurate decisions regarding the proximity (especially convergence) of two 3-D surfaces.
Chen et al. [74] (2009) used a combination of 3-D and embedded 2-D views of neural fibres to facilitate navigation, selection, and examination of the fibres. Jianu et al. [75, 76] (2009, 2012) have also considered the interaction between 3-D data and 2-D embeddings. PMP also uses a 3-D to 2-D projection, but does so interactively and intraoperatively in real-time.
In 1991, Bomans et al. [77] discussed (then) new 3-D MRI acquisition and visuali-sation techniques. They investigated multiple shading methods and determined that different methods were ideally suited to different anatomical objects. While their ob-jective was near photo-realistic visualisation of anatomical objects, PMP is concerned with more functional information, such as inter-surface distances.
volume rendering, PMP projects surface information. Coenen et al. [79] concluded that a 3-D visualisation of pyramidal tract fibres is a helpful supplemental tool for neurosurgeons during brain tumour surgery. This was, again, a volume visualisation, rather than a surface projection, as with PMP.
2.6.3 Augmentations
Gross et al. [80] (1997) described a variation of the “mass-spring” system approach to identifying multidimensional data relationships (originally proposed by Eades [81]). A mass-spring system is basically an algorithm for graph-drawing, modelled on at-tractive and repulsive forces. One novel aspect of their system was the initialisation of the mass-spring components onto the inner of two concentric spheres for its ulti-mate visualisation on the surface of the outer sphere. Whereas this use of projection is relatively abstract, PMP’s use of a similar projection deals with surfaces in physical 3-D space. Halos (ie. isolines, or contour lines) were overlaid on slices to visualise safety margins around anatomical structures.
Tietjen et al. [1] (2006) demonstrated two techniques, “LiftCharts” and “halos”, for enhancing slice-based visualisations of volumetric medical data. The LiftChart adds overview information, showing the ranges (within a stack of slices) that contain different anatomical structures. The fact that LiftCharts were used interactively to navigate slices is of particular interest to this research. PMP takes a related approach, of creating an overview which can be used to assist in slice navigation.
Dick et al. [82] (2011) described a technique of viewing distance indicators on
a 3-D surface, for guiding medical implant planning. This is similar to the PMP technique’s computation of inter-surface proximities, prior to projection onto a 2-D surface. By contrast, PMP is used with less-predictable dynamic surfaces.
2.6.4 Other Visualisation Studies
§2.6 Visualisation Studies 31
where the data is changing with time. Their focus was on automatically creating animated sequences of views through a dynamic dataset in a way that maximises viewable information and smoothness. Their method and the PMP technique share some underlying attributes, such as the selection of a desirable view at a point in time. Whereas their technique involved the automatic selection of appropriate views on dynamic data via post-processing, the PMP technique enables interactive selection of appropriate views on dynamic data in real-time.
Zhang et al. [84] described a virtual reality representation of volume and surface information from MRI data. This information was presented in a Cave[85] environ-ment, and was designed to assist pre-operative planning and post-operative assess-ment of results. PMP, by comparison, is designed to be used intra-operatively.
The examination of map projection solutions reveals additional applications of such techniques in medicine. A dose-volume histogram (DVH) is a common visuali-sation in radiotherapy planning, where one or more lines represent different tissue volumes. Each of those lines are defined by a treatment planned to deliver a dose to a percentage of the volume. DVH is described in detail by Drzymala et al. [86], and illustrated further in Chapter 8. Drzymala et al. note that DVH does not provide 3-D spatial information about the treatment plan. Cheng and Das [87] proposed zDVH (spatial-DVH) as a way of addressing that lack of spatial information. ZDVH essen-tially involves creating a DVH for each slice through a volume. A stack of zDVH’s comes with similar navigation challenges as a stack of volume slices. The published literature has a gap in the area of navigating DVH and zDVH information.
qualitative comparison were not the subject of their study. The published literature has a gap in the area of tools and techniques specifically supporting the qualitative comparison of medical image segmentation methods.
2.6.5 Ongoing Related Research
During the course of the research described in this thesis, additional relevant pub-lications have appeared in the literature. Three particularly relevant examples are noted below together with some comments (in itallics) regarding how this recent work relates to PMP.
Fischer-Valuck et al. [91] described a two-year case study of the use of a MR image-guided radiotherapy system. The visualisation technique used was of the common “stack of slices” style. Comment: This study identifies an additional therapy to which the PMP technique might be applied.
Hettig et al. [92] demonstrated a technique that visualised simplified anatomical structures in a 3-D volume and cut-planes to place a liver ablation probe. User interaction with that system was simplified by having the visualisation controlled solely by the position and orientation of the probe. Comment: PMP is used to monitor the progress of treatment progression, rather than probe placement as in this reference. Even
though PMP has been forumulated for use in a different phase of medical therapies to this
paper, it shares the theme of data-simplification that is discussed by these authors. Thus, this
study identifies an additional area that might be useful for PMP in the future.
The application ofAugmented Reality (AR)to image-guided surgery has also been of increasing interest during this research program. Detmer et al. [93] reviewed more than 50 studies of AR in the field of renal interventions alone. Comment: Although AR and PMP are quite different visualisation techniques, the use of AR in combination with
§2.7 Summary 33
2
.
7
Summary
This chapter has described the context of surface proximity monitoring during real-time image-guided focal therapy. MRg thermal therapy on tumours was used to illustrate the importance of such monitoring. There continues to be interest and progress in key fields relating to real-time image guided medical procedures. Real-time MRg focal therapy (such as NeuroBlateR) has not only been the subject of
significant research, but has also been used to treat human patients.
Chapter3
Proximity Map Projection
3
.
1
Introduction
This chapter describes a technique and prototype that were developed to address the challenges described in Chapter 2. The PMP technique has been designed to enable efficient monitoring of the proximity between two 3-D surfaces, particularly where one or both of these surfaces is changing over time. Consequently, the user will be able to focus more of their attention on expert decision making, rather than on distance comparisons and navigation of image data.
A typical visualisation approach for this problem would be to make use of 3-D surface or volume rendering, together with “stacked” 2-D images. Such approaches have serious limitations (especially occlusion) as previously discussed in Section 2.3. The potential approach of dealing with occlusion in volume rendering by using trans-parency was considered unlikely to be a satisfying solution in the context addressed by PMP. Instead, PMP takes an approach of providing complete, simultaneous per-ception of the proximity of the two surfaces.
PMP monitors the proximity of two surfaces by using 3-D to 2-D mapping (a technique identified in Section 2.6.1). While numerous mapping techniques are pos-sible, the technique used by PMP is much the same as a Mercator projection (chosen as it is a familiar way to map the spheroidal earth onto a flat rectangle). The main attribute encoded onto the projected surface in PMP is the closest proximity of one of the surfaces to the other.
3
.
2
Visualisation
PMP’s objective is to provide complete, simultaneous perception of the proximity of the two surfaces, supporting LITT visualisation, as discussed in Section 2.4.1. PMP allows a user to perceive the proximity between a tumour surface and a treatment surface at all surface points, and to navigate to 2-D images that show the details at a selected point. PMP handles singular masses with no internal holes, or more complex tumours that have been subdivided into individual treatment targets. Initial surface points, in this research, were taken from expert segmentations in the sample data. Key steps in creating the PMP include: proximity calculation, coordinate conversion, projection, and proximity to colour scaling. These steps are detailed below.
The surface points are stored in a KD-Tree data structure[72] (identified in Section 2.6.1, having construction timeO(3nlogn)and search timeO(logn). The minimum tumour-treatment proximity is calculated for every point on the tumour. The K-D Tree search is detailed in Appendix A.
The cartesian coordinates (x, y, z) of the tumour surface points are converted to spherical coordinates (rradius, θinclination,φazimuth). The coordinate conversion is made
simple, using the IDL language’s CV_COORD function. The tumour surface points are projected onto a sphere, by setting r to a fixed distance, and then onto a plane, with x=θ andy =φ. Below is an extract of IDL code accomplishing this:
1 sphericalCoords=cv_coord(from_rect=centeredCoords,/to_sphere)
2 self.sphericalCoords = ptr_new(sphericalCoords)
3 triangulate, sphericalCoords[0,*],sphericalCoords[1,*],triangles,CONNECTIVITY=c
4 gridSize = fix(sqrt(n_elements(sphericalCoords)/3))
5 *self.projectedProximities=griddata(sphericalCoords[0,*],sphericalCoords[1,*],*self.
proximities,dimension=[800,400],/nearest_neighbor,triangles=triangles)
§3.3 Implementation 37
to reduce cognitive load, a challenge identified in Section 2.4.2. The colour-scale is illustrated in Figure 3.1. The colour encoding is detailed in Appendix A.
3
.
3
Implementation
The PMP prototype was developed using IDL[94] version 8.2. IDL was chosen for de-veloping the prototype due to its interface development features and its orientation towards visualisation. IDL has graphical and matrix oriented routines that are useful in this context. MATLAB[95] shares similarities with IDL, but the author’s familiar-ity with IDL made it an expedient choice, in terms of development efficiency. While C/C++ and a framework such as the Medical Image Interaction Toolkit (MITK)[96], would eventually allow for greater software refinements, IDL better suited the time and scope of this research. A specialised solution such as 3DSlicer[97], while han-dling some tasks better, would not have offered the flexibility of IDL.
The prototype was developed using the hardware system described in Appendix B. Although a survey described in Appendix F later suggested that an affordance might exist for PMP usage via a touch-interface, a mouse and keyboard interface
Figure 3.1: Proximity-to-colour scale for the PMP view, as used in Figure 3.3. The top row shows treatment surface proximities from most distant, non protruding, in black, through to most distant, protruding, in dark red. The bottom row shows 2-D views of surface proximities matching the colour above. Limits for scaling are most
was used in the user studies described in this research. While a mouse and keyboard system might not lend itself to a sterile operating theatre, therapies such as MRg LITT commonly have the computing hardware in a separate (non-sterile) control room.
Without further optimisation, the current PMP prototype performs sufficiently well to study user interaction at common current MR thermometry refresh rates (noted in Section 2.5) of six to eight seconds. IDL has the ability for its built-in func-tions to take advantage of multiple CPUs and general purpose GPUs. It is expected that the current PMP prototype will be capable (possibly with a hardware upgrade) of performing at thermometry refresh rates of less than six seconds, if desired. The capability of PMP to accommodate such increased refresh rates can be verified when conducting potential future investigations identified in Section 9.3.1.
3
.
4
Usage Scenario Considered
The standard anatomical orientations of planes in medical imaging (as noted in Sec-tion 2.3) are axial (down through the top of the head), coronal (from the front, at the face), and sagittal (from the side of the head), as illustrated in Figure 3.2. For the benefit of medically-inexperienced participants, the prototype software was labeled with “x”, “y”, and “z” planes, as can be seen in Figure 3.3.
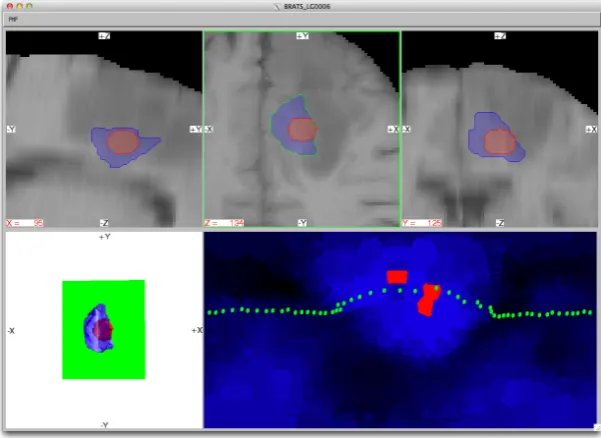
Figure 3.3, from Marshall et al. [9], shows: the prototype with the PMP view (lower-right) enabled and the axial plane (top-middle) selected; and the most inter-esting visual aspects of the software, which are the PMP view and its relationship
Axial Coronal Sagittal Slices
Figure 3.2: Standard Anatomic Orientations - These are planes passing through the body. From left to right: axial (from the top), coronal (from the front), and sagittal
§3.4 Usage Scenario Considered 39
Figure 3.3: Experimental Software - A view of the PMP prototype is presented. The top row contains 2-D slice views. The selected slice view is highlighted with a green border and the plane of this slice is shown in the 3-D volume visualisation at bottom-left. At bottom-right is the PMP view, with blue to red colour-encoded inter-surface proximity values and a green dotted line representing the tumour boundary. This
colour scale is further described in Figure 3.1.
with the other views. The scenario is for a tumour located in the brain, for which the patient is undergoing thermal treatment. The treatment volume is shown as a sphere inside the irregular tumour volume.
The selected (top-middle) view is highlighted and the selected plane is displayed, in green, in the 3-D volume view (lower-left). The boundary of the tumour in the se-lected slice is drawn on the PMP (lower-right). This relationship between the sese-lected slice and the boundary shown in the PMP is illustrated in Figure 3.4. All points on the tumour surface have 3-D coordinates. Each PMP point is linked to a tumour sur-face point. This simplifies the association of tumour boundary points between the 2-D and PMP-views, reducing cognitive load (as discussed in Section 2.4.2).