DOSAGE FORM BY HPLC
Dissertation Submitted toTHE TAMILNADU Dr. M.G.R. MEDICAL UNIVERSITY
CHENNAI
In partial fulfillment for the award of the degree of
MASTER OF PHARMACY
In
(Pharmaceutical Analysis) Submitted By
MUSTAFA HAMID
Reg.No:
261430012
Under the Guidance ofDr. N.Ramalakshmi, M.Pharm., Ph.D
Assistant Professor
DEPARTMENT OF PHARMACEUTICAL ANALYSIS
C.L. BAID METHA COLLEGE OF PHARMACY
(An ISO 9001-2000 certified institute)
THORAIPAKKAM, CHENNAI – 600097
Dr. N.Ramalakshmi, M.Pharm., Ph.D
Department of Pharmaceutical Analysis
CERTIFICATE
This is to certify that the project entitled, “METHOD DEVELOPMENT AND
VALIDATION FOR THE SIMULTANEOUS ESTIMATION OF AMBRISENTAN IN
TABLET DOSAGE FORM BY HPLC ” submitted by Regd. No.261430012
in partial fulfillment for the award of degree of Master of Pharmacy (Pharmaceutical Analysis). The
project was carried out at IDEAL ANALYTICAL LAB, PONDYCHERRY and C.L.Baid
Metha college of Pharmacy, Chennai-97 under my supervision during the academic year
2015-2016.
Date: Dr. N.Ramalakshmi, M.Pharm., Ph.D
Assistant Professor
Place: Chennai-97 Department of Pharmaceutical Analysis
C.L.Baid Metha college of Pharmacy
Dr. C.N NALINI M. Pharm., Ph.D
Prof and HOD of pharmaceutical analysis
CERTIFICATE
This is to certify that the project entitled “METHOD DEVELOPMENT AND
VALIDATION FOR THE SIMULTANEOUS ESTIMATION OF AMBRISENTAN IN
TABLET DOSAGE FORM BY HPLC” submitted by Regd. No. 261430012 in partial
fulfillment for the award of degree of Master of Pharmacy (Pharmaceutical Analysis). The
project was carried out at IDEAL ANALYTICAL LAB PONDYCHERRY and C.L.Baid
Metha college of Pharmacy, Chennai-97 under the guidance of Dr. N.Ramalakshmi,
M.Pharm., Ph.D during academic year 2015-2016
Date: Dr. C.N NALINI M. Pharm., Ph.D
Professor and Head of the Department
Place: Department of Pharmaceutical Analysis
C.L.Baid Metha college of Pharmacy
Dr. Grace Rathnam, M.Pharm., Ph.D
Principal
CERTIFICATE
This is to certify that the project entitled “METHOD DEVELOPMENT AND
VALIDATION FOR THE SIMULTANEOUS ESTIMATION OF AMBRISENTAN IN
TABLET DOSAGE FORM BY HPLC” submitted by Regd. No. 261430012 in partial
fulfillment for the award of degree of Master of Pharmacy (Pharmaceutical Analysis). The
project was carried out at IDEAL ANALYTICAL LAB PONDYCHERRY and C.L.Baid
Metha college of Pharmacy, Chennai-97 under the guidance of Dr. N.Ramalakshmi,
M.Pharm., Ph.D during academic year 2015-2016
Date: Dr. Grace Rathnam M. Pharm., Ph.D
Place: Principal
C.L.Baid Metha College of Pharmacy,
DECLARATION
I hereby declare that this dissertation entitled, “METHOD DEVELOPMENT AND
VALIDATION FOR THE SIMULTANEOUS ESTIMATION OF AMBRISENTAN IN
TABLET DOSAGE FORM BY HPLC” has been originally carried out by me under the
guidance and supervision of Dr. N.Ramalakshmi, M.Pharm., Ph.D. Department of
Pharmaceutical Analysis, C.L.Baid Metha College of Pharmacy, Chennai – 97 during the
academic year 2013-2015. The work embodied in this thesis is original, and is not submitted
in part or full for any other degree of this or any other University.
Date: [Reg. No: 261430012]
“Success is how high you bounce when you hit bottom”
“If you can dream it, you can do it”
It affords me an immense pleasure to acknowledge with gratitude the help and guidance rendered to me by a host of people, whom, I owe a substantial measure for the completion of the dissertation.
Firstly, I glad to have the blessings of God and my Father in the implementation of our thought of doing this project. I thank God for providing me strength and power to overcome all the hurdles and hindrances that come in the way of doing the project work.
I take this golden opportunity to express my humble gratitude and respect to my research guide Dr. N.Ramalakshmi, M.Pharm., Ph.D. Assistant professor, Department of Pharmaceutical Analysis, C.L.Baid Metha College of Pharmacy,
Chennai – 97, for her inspiring guidance, constant encouragement and intellectual
suggestions throughout the course of the dissertation.
I express our profound sense of gratitude to our honorable Principle Dr. Grace
rathnam, M.pharm., Ph.D Principal, and Head of the Department of
Pharmaceutics
It is my privilege to express my grateful and sincere thanks to Dr. C.N NALINI M. Pharm., Ph.D, Professor and Head of the Department of Pharmaceutical
analysis, C.L.Baid Metha College of Pharmacy.
This is my great privilege to thank Dr. Shantha Arcot M.sc Pharmacy Ph.D
for her great support and motivation for completing my project.
I would like to use this opportunity to thank Managing Director
K.Maruthappapandian, R.Parmaguru, Ideal Analytical and Research Institution
I extend my sincere thanks to Librarian M.Rajalakskmi C.L Baid Metha College of Pharmacy in helping me to utilize the library facilities for references. I thank all non-teaching staff members of our college including Mrs R.Usha, Mrs Valli and Mrs A.P.
Kalpakam for their help extended during my project work.
I profusely thank to all my classmates and juniors for their timely help and good wishes. And also I thank one and all, who helped me directly or indirectly for the successful completion of my project work.
Last but not least I am highly grateful and dedicated to my Mom (Maa) and my brothers for their moral support.
MUSTAFA HAMID
Reg.No:
261430012
Dept. of pharmaceutical Analysis
Date:
CHAPTER
NO.
TITLE
PAGE
NO.
1
INTRODUCTION
2
LITERATURE REVIEW
3
AIM AND OBJECTIVE
PLAN OF WORK
4
DRUG PROFILE
5
MATERIALS AND EQUIPMENTS
6
ANALYTICAL METHOD DEVELOPMENT
AND OPTIMIZTION
7
VALIDATION OF DEVELOPED METHOD
8
SUMMARY AND CONCLUSION
TABLE
NO. TITLE
PAGE NO.
1 Suitable parameters for HPLC method development
2 Comparison of Validation Parameters Required for HPLC Assay Methods
3 List of Instruments
4 List of Chemicals
5 List of Standard drugs
6 Marketed formulation
7 List of Apparatus
8 Results for trial 1
9 Results for trial 2
10 Results for trial 3
11 Results for trial 4
12 Results for trial 5
13 Results fortrial 6
14 Chromatographic Conditions
15 Tabular Column for the Assay of Marketed formulation
16 HPLC Chromatogram of blank (mobile phase)
17 Linearity of Ambrisentan
18 Accuracy results for Ambrisentan
19 Precision results for Ambrisentan
20 Lod and Loq Determination
22 Result of Column temperature change
23 Result of pH change
24 System suitability data of Ambrisentan
FIGURE
NO. TITLE
PAGE NO.
1. Schematic diagram of HPLC
2. Retention time
3. Resolution oftwo peaks
4. Tailing Factor
5. HPLC chromatogram for first trial
6. HPLC chromatogram for second trial
7. HPLC chromatogram for third trial
8. HPLC chromatogram for fourth trial
9. HPLC chromatogram for fifth trial
10. HPLC chromatogram for sixth trial
11. HPLC chromatogram of Ambrisentan for marketed formulation
12. HPLC Chromatogram of blank (mobile phase)
13. HPLC chromatogram of Placebo
14. HPLC chromatogram of standard Ambrisentan
15. HPLC chromatogram of sample
16. HPLC chromatogram of Ambrisentan for linearity 50%.
17. HPLC chromatogram of Ambrisentan for linearity 60%.
18. HPLC chromatogram of Ambrisentan for linearity 80%.
19. HPLC chromatogram of Ambrisentan linearity 100 %.
20. HPLC chromatogram of Ambrisentan linearity 120 %
21. HPLC chromatogram of Ambrisentan linearity 150 %
24. HPLC chromatogram of Ambrisentan for Accuracy 50% Inj (2)
25. HPLC chromatogram of Ambrisentan for Accuracy 50% Inj (3)
26. HPLC chromatogram of Ambrisentan for Accuracy 100% Inj (1)
27. HPLC chromatogram of Ambrisentan for Accuracy 100% Inj (2)
28. HPLC chromatogram of Ambrisentan for Accuracy 100% Inj (3)
29. HPLC chromatogram of Ambrisentan for Accuracy 150% Inj (1)
30. HPLC chromatogram of Ambrisentan for Accuracy 150% Inj (2)
31. HPLC chromatogram of Ambrisentan for Accuracy 150% Inj (3)
32. HPLC chromatogram of Ambrisentan for Precision Inj (1)
33. HPLC chromatogram of Ambrisentan for Precision Inj (2)
34. HPLC chromatogram of Ambrisentan for Precision Inj (3)
35. HPLC chromatogram of Ambrisentan for Precision Inj (4)
36. HPLC chromatogram of Ambrisentan for Precision Inj (5)
37. HPLC chromatogram of Ambrisentan for Precision Inj (6)
38. HPLC chromatogram of Ambrisentan for robustness (Flow 0.9ml/min)
39. HPLC chromatogram of Ambrisentan for robustness (Flow 1.1 ml/min)
40. HPLC chromatogram of Ambrisentan for robustness (Temp 30˚C)
41. HPLC chromatogram of Ambrisentan for robustness (Temp 40˚C)
42. HPLC chromatogram of Ambrisentan for robustness (pH2.8)
43. HPLC chromatogram of Ambrisentan for robustness (pH 3.2)
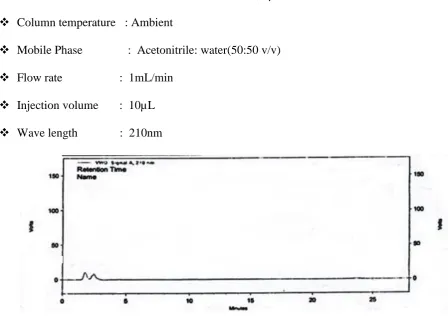
[image:12.595.70.546.66.742.2]45.
+2%)
46. HPLC chromatogram of Ambrisentan for solution stability after 24 hrs
47. HPLC chromatogram of Ambrisentan for solution stability after 48 hrs
AUC Area under concentration
Conc. Concentration
FDA Food and drug administration
gms Gram
hrs Hours
ICH International conference on harmonization
LOD Limit of detection
LOQ Limit of quanitation
mg Milli gram
mL Milli liters
Mins Minutes
mm Milli meter
ng Nano gram
NLT Not less than
nm Nano meter
NMT Not more than
ODS Octadecylsilane
PAH Pulmonary arterial hypertension
Rt Retention time
S. No. Serial number
Std.Dev Standard deviation
USP United states pharmacopoeia
UV Ultra violet
µL Micro liters
µm Micro meters
µg (or) mcg Micro gram
0C Degree Celsius
C. L. Baid Metha College of Pharmacy Page 1 1. INTRODUCTION
Pharmaceutical analysis plays a vital role in the Quality Assurance and Quality
control of bulk drugs. Analytical chemistry involves separation, identification, and
determining the relative amounts of components in a sample matrix; Pharmaceutical
analysis is a specialized branch of analytical chemistry that derives its principles from
various branches of sciences like physics, microbiology, nuclear science, and electronics
etc. Qualitative analysis is required before a quantitative analysis can be undertaken.
Analytical method development and validation is a good research in the field of
Pharmaceutical analysis, utilized to determine the drug content in bulk and pharmaceutical
dosage forms and in biological fluids like blood, serum, urine etc. In view of the industrial
scenario and literature, it was noted that chromatographic techniques like HPLC, LC–
MS/MS methods have created revolutionary precision and accuracy in quantification of
drugs in Formulation and in Biological fluids even at low concentration.
Need for pharmaceutical Analysis
New drug development.
Method Validation as for ICH Guidelines
Research in Pharmaceutical Sciences
Clinical Pharmacokinetic Studies
1.1 Chromatographic Techniques
Recently, the IUPAC has defined chromatography as; “Methods used primarily for
the separation of the components of a sample, in which the components are distributed
between two phases, one of which is stationary while other moves. The stationary phase may
be a solid or a liquid supported on a solid or a gel, and may be packed in a column, spread as
C. L. Baid Metha College of Pharmacy Page 2
M.T Swett coined the term "chromatography" to describe the process of separating
colorful leaf pigments in a column made of chalk.2 Chromatography is a non-destructive
technique used for separating a mixture of compounds into individual components using a
stationery phase and mobile phase.3 Chromatography is used routinely in almost every
laboratory for a large number of tasks. These range from the separationof mixtures on an
analytical as well as preparative scale, purification and pre concentration of an analyte to
controlling the progress of a chemical reaction.
Classification of Chromatographic Techniques
According to the nature of stationary and mobile phase
Gas Solid Chromatography
Gas Liquid Chromatography
Solid Liquid Chromatography
Liquid Liquid Chromatography
According to mechanisms of separation, chromatographic methods are divided into
Adsorption chromatography
Partition chromatography
Ion exchange chromatography
Ion pair chromatography
Size exclusion or gel permeation chromatography
Affinity chromatography
C. L. Baid Metha College of Pharmacy Page 3 1. Adsorption chromatography
The principle of separation is adsorption. Separation of components takes place
because of the difference in affinity of compounds towards stationary phase. This principle
is seen in normal phase as well as reverse phase mode, where adsorption takes place.
2. Partition chromatography
When two immiscible liquids are present, a mixture of solutes will be distributed
according to their Partition co efficient .When a mixture of compounds are dissolved in the
mobile phase and passed through a column of liquid stationery phase, the component which
is more soluble in the stationery phase travels slower. The component which is more soluble
in the mobile phase travels faster. Thus the components are separated because of the
differences in their partition efficient. No two components have the same partition
co-efficient for a particular combination of stationery phase, mobile phase and other conditions.
The stationery phase as such cannot be a liquid
3. Ion exchange chromatography
The principle of separation is ion exchange, which is reversible exchange of
functional groups. In ion exchange chromatography, an ion exchange resin is used to
separate a mixture of similar charged ions. For cations, a cations exchange resin is used. For
anions, an anion exchange resin is used. In ion exchange chromatography, the stationary
solid phase of the chromatographic column (or sheet or other device) commonly consists of
a resin with covalently attached anions or cat ions.4When the sample, dissolved in water or
another liquid, is run over the column, sample ions of the opposite charge are attracted to the
C. L. Baid Metha College of Pharmacy Page 4
sample components are then eluted by application of a salt gradient which gradually desorbs
the sample molecules in order of increasing electrostatic interaction with the ions of the
column.
4. Ion pair chromatography
In ion pair chromatography, a reverse phase column is converted temporarily into
ion exchange column by using ion pairing agents like pentane or hexane or heptanes or
octane sulphonic acid sodium salt, tetraethyl or tetra methylhydroxide etc.
5. Size exclusion or gel permeation chromatography
In this type of chromatography, a mixture of components with different molecular
sizes is separated by using gel. The gel used acts as molecular sieve and hence mixture of
substances with different molecular sizes is separated. Soft gels like dextran are also used.
6. Affinity chromatography:
Affinity chromatography uses the affinity of the sample with specific stationary
phases. This technique is mostly used the field of biotechnology, micro biology,
biochemistry etc.
7. Chiral phase chromatography
Separation of optical isomer can be done by using chiral stationary phases different
principles operate for different types of stationary phases and different samples. The
stationary phases are used for this type of chromatography are mostly chemically bonded
C. L. Baid Metha College of Pharmacy Page 5
In chromatographic separation, HPLC and HPTLC methods have widely been exploited in
pharmaceutical analysis because of its simplicity, precision, accuracy and reproducibility of
results.1
1.2 INTRODUCTION TO HPLC
High performance liquid chromatography is basically a highly improved form of column
chromatography. Instead of a solvent being allowed to drip through a column under gravity,
it is forced through under high pressures of up to 400 atmospheres.
HPLC allows the use of very small particle size for the column packing material
which gives a much greater surface area for interactions between the stationary phase and
the molecules flowing past it. This allows a much better separation of the components of the
mixture. Its simplicity, high specify and wide range of sensitivity makes it ideal for analysis
of many drugs in both dosage forms and in biological fluid.
1.3 TYPES OF HPLC TECHNIQUES
A. Based on modes of separation: There are two modes, normal phase mode and reverse
phase mode5.
i) Normal phase mode: In this mode, the stationary bed is strongly polar in nature (e.g.,
silica gel), and the mobile phase is nonpolar (such as n-hexane or tetrahydrofuran). Polar
samples are thus retained on the polar surface of the column packing longer than less polar
materials.
ii) Reveres phase modeReverse-phase chromatographyis the inverse of Normal phase
mode. The stationary bed is nonpolar (hydrophobic) in nature, while the mobile phase is a
C. L. Baid Metha College of Pharmacy Page 6
the material is, the longer it will be retained.Non-polar compounds in the mixture will tend
to form attractions with the hydrocarbon groups because of vanderwaals dispersion forces.
Since most of the drugs and pharmaceuticals are polar in nature, they are not retained for a
longer time and eluted faster which is advantageous. Different columns used are ODS
(octadecylsilane), C18, C8, C4 etc.
B. Based on elution technique
Isocratic separation In this technique the same mobile phase combination is used
throughout the process of separation, the same polarity or elution strength is maintained
through the process.
Gradient separationIn this technique, a mobile phase combination of low polarity or
elution strengths is used followed by gradually increasing the polarity or elution strengths.
C. Based on the scale of operation:-
Analytical HPLCIn this technique only analysis of the samples are done. Recovery of the samples for reusing is normally not done, since the sample used very low. Ex. µgm
quantities.
Preparative HPLCIn this technique individual fraction of pure compounds can be collected using fraction collector. The collected samples are reused. Ex. Separation of few grams of
mixtures by HPLC.
D. Based on the type of analysis
Qualitative analysisIt is done to identify the compound, detect the presence of impurity, to
C. L. Baid Metha College of Pharmacy Page 7 Quantitative analysisItis doneto determine the quantity of the individual or several
components in a mixture. This is done by comparing the peak area of the standard and
sample.
1.4
PRINCIPLE OF HPLCThe principle of separation in normal phase mode and reverse phase mode is adsorption
and/or partition.
ADSORPTION
When a mixture of components is introduced in to a HPLC column they travel
according to their relative affinities towards the stationary phase. The component which has
more affinity towards the stationary phase travels slower. The component which has less
affinity towards the stationary phase travels faster. Since no two components have the same
affinity towards the stationary phase the components are separated
PARTITION
When a mixture of compounds are dissolved in the mobile phase and passed
through a column of liquid stationery phase, the component which is more soluble in the
stationery phase travels slower. The component which is more soluble in the mobile phase
travels faster. Thus the components are separated because of the differences in their partition
co-efficient. No two components have the same partition co-efficient for a particular
combination of stationery phase, mobile phase and other conditions.
1.4
INSTRUMENTATION OF HPLCC. L. Baid Metha College of Pharmacy Page 8
a) Mobile phase reservoir
b) pumps
c) Sample mixing units
d) Sample injectors
e) Column
f) Detectors.
g) Recorders and injectors
Fig No 1: Schematic diagram of HPLC
a) Mobile phase Reservoirs The modern HPLC apparatus is equipped with one or more
glass or stainless steel reservoirs each of which contains 200-1000ml of a solvent. The
mobile phase are often equipped with a mean of removing dissolved gasses usually oxygen
or nitrogen. These bubbles cause band spreading, in addition they often interfere with
performance of the detectors. Often the systems also contain a means of filtering dust and
particulate matter from the solvent to prevent these particles from damaging the pumping
systems or clogging systems. This treatment removes gases as well as suspended matter. A
C. L. Baid Metha College of Pharmacy Page 9
elution. Frequently separation efficiency is greatly enhanced by gradient elution. Here two
difference solvent systems that differ significantly on polarity are employed.
b) PumpsThe most important component of HPLC in solvent delivery systems is the pumps
because its performance directly affects the retention time reproducibility and detector
sensitivity.
Three types of pumps each with its own set of advantages are encountered namely.
Reciprocating pumps
Displacement –type pumps
Pneumatic pumps
i) Reciprocating Pumps
They usually consist of chamber in which the solvent is pumped by the back and forth
motion of a motor drive piston. The two ball check valves which open and close alternately
control the flow of solvent in to and (close alternately control the flow of solvent in to and)
out of a cylinder track with the piston.
ii) Displacement Pumps
Displacement pump consist of large, syringe like chambers equipped with a
plunger that is activated by a screw driven mechanism powered by a stepping metor. The
output is pulse free.
iii) Pneumatic Pumps
The pneumatic pumps, the melphis contained in a compatible container housed
C. L. Baid Metha College of Pharmacy Page 10
and pulse free6-7, they suffer from limited capacity and pressure output as well as a
dependence of flow rate on solvent viscosity and column back-pressure. In addition they are
not amiable to gradient elution and are limited to pressure less than about 2000psi.
c) Flow Control and Programming Systems
As part of their pumping systems, many commercial instruments are equipped with
computer controlled devices for measuring the flow rate by determining the pressure drop
across a restrictor located at the pump outlet.
d) Sample Mixing Units
Mixing unit is used to mix solvents in different proportions and pass through the column.
They are Low pressure mixing chamber which uses helium for degassing solvents and High
pressure mixing chamber does not require helium for degassing solvents.
e) Sample Injector
Often the limited factor in the precision of liquid chromatographic measurement lies in the
reproducibility with which samples can be introduced in to columns packing. Exaggerated
by band broadening which accompanies overloading columns. These volumes used must be
minuscule a (Thus, the volumes used must be mini) of a ml to perhaps 500ml.It is
convenient to be able to introduce the sample without depressurizing the system.
f) Columns
HPLC columns are ordinarily constructed from smooth-bore stainless steel tubing, although
C. L. Baid Metha College of Pharmacy Page 11 Analytical columns
The majority of HPLC columns range in length from 10-30cm. Normally columns are
straight with added length when needed, being gained by coupling two or more columns
together occasionally called columns are encountered
The inside diameter of liquid column is often 2-5mm.The most common particles
size of packed columns is 5-10µm .the most common columns currently in use is one that is
15-25cm in length,4.6mm inside diameter ,and packed with 5µm particles. Columns of this
type contain 4000-6000plates/meter.
Guard columns
The guard columns have very small quantity of adsorbent and improve the life of
the analytical columns. It also acts as a prefilter to remove particulate matter and any other
material. Guard column has the same material as that of analytical column but does not
contribute to any separation.
g) Column thermostats
For many applications close control of column temperature is not necessary and columns are
appareled at combined temperature often. However better chromatograms are obtained by
monitoring column temperature constant to few degree centigrade. Most modern
commercial instruments are now equipped with column heaters that control, column
temperature to a few tenths of degree from near obtained to 100-150 ºc. Columns may also
be fitted with water jackets fed from a constant temperature bath to give precise temperature
C. L. Baid Metha College of Pharmacy Page 12 h) Column material
The columns are made up of either stainless steel glass polyethylene, PEEK (poly ether
ether ketone). Most widely used are stainless steel which can with stand high pressure.
Latest ones are PEEK columns whose length varies from 5-30cm, diameter ranges from
2-5mm and particle size from 1µ-20µ.Particle should be spherical and uniform in nature.
Porous materials are used. Surface area of 1gm of stationary phase provides surface area
ranging from 100-860 mts.
i) Functional group
The functional group present in stationary phase depends on the type of
chromatographic separation in normal phase mode it contain following groups
o C18 –octadecylSilane (ODS) column
o C8-octylcolumn
o C4-butyl column
o CN-cyano column
o NH2-amino column
j) DETECTORS
The function of detector in HPLC is to monitor the mobile phase as it emerges through the
column
Types of detectors
i) Absorbance detectorA ‘Z’ shaped flow through cell for absorbance measurement on
C. L. Baid Metha College of Pharmacy Page 13
broadening the volume of such a cell is kept as small as possible. The typically
volumes are limited to 1-10µl and cell length to 2-10mm here intensity of the solvent
system are stored in a computer memory and ultimately recalled for the calculation of
absorbance.
ii) UV detectorUV detector is based on the light absorption characteristics of sample. Two
types of this detector are, one is the fixed wavelength detector which operates at 254nm,
and other is variable wavelength detector which can be operated from 190nm to 400nm.
iii) Refractive index detector This is a nonspecific or universal detector. This is not much
used for analytical applications because of low sensitivity and specificity.
iv) Flourimetric detector Flourimetric detector is based on fluorescent radiation emitted by
some class of compound. In most cases fluorescence is absorbed by a photoelectric
detector located at 90ºto the excitation beam. The simplest detectors employ a mercury
excitation sources and one or more filters to isolate a band of emitted radiation. This
detector has more sensitivity and specificity.
v) Conductivity detector Based upon electrical conductivity, the response is recorded.
This detector is used when the sample has conducting ions like anions and cat ions
vi) Amperometric detector Amperometric detector is based on the reduction or oxidation
of the compounds when a potential is applied. The diffusion current recorded is
proportional to the concentration of the compound eluted this is applicable when
compounds have functional group which can be either oxidized or reduced this is a
highly high sensitive detector.
vii) PDA detectorPDA detector is a recent one which is similar to UV detector which
operates from 190-600nm. Radiations of all wavelengths fall on the detector
simultaneously. The resulting spectrum is 3-D or three dimensional plot of response Vs
C. L. Baid Metha College of Pharmacy Page 14 k) Recorders and integrators Recorders are used to record the responses obtained from
detectors after amplification, if necessary. They record the base line and all the peaks
obtained, with respect time to time. Retention time for all the peaks can be found out from
such recordings, but the area of individual peaks cannot be known.
Integrators are improved variation of recorders with some data processing
capabilities. They can be recorded the individual peaks with retention time, height and width
of peaks, peak area, percentage of area, etc.
1.
1.5
GENERAL INFORMATION ON HPLC METHOD DEVELOPMENTA good method development strategy should require only as many experimental
runs as are necessary to achieve the desired final result. Finally method development should
be as simple as possible, and it should allow the use of sophisticated tools such as computer
modeling.
The important factors, which are to be taken into account to obtain reliable
quantitative analysis, are
a) Careful sampling and sample preparation.
b) Precise sample injection.
c) Appropriate choice of the column.
d) Choice of the operating conditions to obtain the adequate resolution
e) Reliable performance of the recording and data handling systems.
f) Suitable integration/peak height measurement technique.
g) The mode of calculation best suited for the purpose
C. L. Baid Metha College of Pharmacy Page 15 Separation goals:
The goals of HPLC separation need to be specified clearly include the use of HPLC to
isolate purified sample components for spectral identification or quantitative analysis. It may be
necessary to separate all degradants or impurities from a product for reliable content In quantitative
analysis, the required levels of accuracy and precision should be known (a precision of 1 to 2% is
usually achievable). Whether a single HPLC procedure is sufficient for raw material or one or more
for mutations and/or different procedures are desired for formulations. When the number of samples
for analysis at one time is greater than 10, a run time of less than 20 minutes often will be
important.
Getting Started On Method Development
One approach is to use an isocratic mobile phase of some average solvent strength
(50%) organic solvent. A better alternative is to use a very strong mobile phase first
(80-100%) then reduce %B as necessary.
The initial separation with 100% B results in rapid elution of the entire sample, but few
groups will separate. Decreasing the solvent strength shows the rapid separation of all
components with a much longer run time, with a broadening of latter bands and reduced
retention sensitivity.
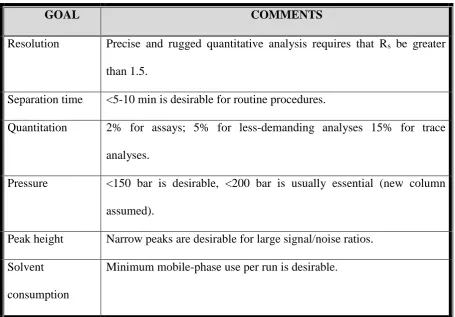
Goals that are to be achieved in method development are briefly summarized in
C. L. Baid Metha College of Pharmacy Page 16
GOAL COMMENTS
Resolution Precise and rugged quantitative analysis requires that Rs be greater
than 1.5.
Separation time <5-10 min is desirable for routine procedures.
Quantitation 2% for assays; 5% for less-demanding analyses 15% for trace
analyses.
Pressure <150 bar is desirable, <200 bar is usually essential (new column
assumed).
Peak height Narrow peaks are desirable for large signal/noise ratios.
Solvent
consumption
[image:31.595.85.541.86.403.2]Minimum mobile-phase use per run is desirable.
Table No:1 Suitable parameters for HPLC method development
1.6 VALIDATION
The word “validation” means “Assessment” of validity or action of validity or action of
providing effectiveness’.
Definitions
FDA defines validation as “establish the documented evidence which provides a high of
assurance that a specific process will consistently produce a product of predetermined
Specifications and quantity attributes”.
WHO action of providing that, any procedure, process, equipment, material, activity, or
C. L. Baid Metha College of Pharmacy Page 17 EUMGP define validation as “action of proving in accordance with the principle of Good
manufacturing practice (GMP), that any material, activity or system actually lead to
expected result”.
AUSTRALIAN GMP defines validation as “the action of proving that any material,
process, activity, procedure, system, equipment or mechanism and intended results”.
1.7 METHOD VALIDATION GUIDELINES
1.7.1 FDA guidelines
The FDA published the draft on “Guidance for Industry on Analytical Procedures and
Method Validation” to aid pharmaceutical companies in meeting the code of federal
regulations requirement [FDA, 2000]. This guidance, when approved, supersedes the FDA
Guidance for Industry on Submitting Samples and Analytical Data for Method Validation
[FDA, 1987]. According to the FDA, analytical methods are categorized into four tests:
identification, testing for impurities (quantitative and limit), assay (dissolution, content,
potency), and specific tests. Recently, the Centre for Drug Evaluation and Research
(CDER), a division of the FDA, also issued guidance for validation of bio analytical
methods [FDA-CDER, 2001].
1.7.2 ICH guidelines
The ICH was initiated around 1990. It is an important regulatory initiative to standardize
regulatory requirements between the European Community, Japan and the United States.
Recognizing the benefits of having consistent international requirements, ICH developed a
number of guidelines that have been recognized in these countries. The two main documents
of ICH guidelines pertaining to analytical method validation are:
C. L. Baid Metha College of Pharmacy Page 18
(ii) Q2B: Validation of Analytical Procedure Methodology [ICH-Q2B, 1997] (6)
1.7.3 USP guidelines
The USP [USP, 2006] categorizes analytical methods into four types of tests: quantisation of
major components of drug product, testing for impurities (quantitative and limit),
performance characteristics and identification tests. USP refers to the same definitions of
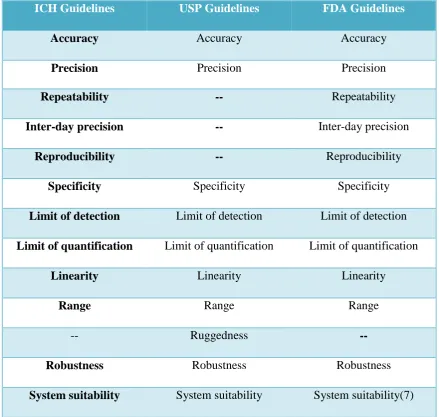
[image:33.595.81.521.307.724.2]ICH Q2A and Q2B recommendations for procedures on meetingvalidation requirements.
Table 2:Comparison of Validation Parameters Required for HPLC Assay Methods
ICH Guidelines USP Guidelines FDA Guidelines
Accuracy Accuracy Accuracy
Precision Precision Precision
Repeatability -- Repeatability
Inter-day precision -- Inter-day precision
Reproducibility -- Reproducibility
Specificity Specificity Specificity
Limit of detection Limit of detection Limit of detection
Limit of quantification Limit of quantification Limit of quantification
Linearity Linearity Linearity
Range Range Range
-- Ruggedness
--Robustness Robustness Robustness
C. L. Baid Metha College of Pharmacy Page 19 1.8 ANALYTICAL METHOD VALIDATION
Method validation is the process for establishing that performance characteristics of
the analytical method are suitable for the intended application. Chromatographic methods
need to be validation before first routine use. To obtain the most accurate results, all of the
variables of the method should be considered, including sampling procedure, sample
preparation, chromatographic separation, detection and data evaluation, using the same
matrix as that of the intended sample. The validity of an analytical method can only be
verified by laboratory studies. All validation experiments used to make claims or
conclusions about validity of the method should be documented in report.
Types of analytical procedures to be validated
Identification test for impurities
Quantitative test for impurities
Limit test control of impurities
Quantitative test for the active moiety in samples of drug substance or drug product,
or other selected components (s) in the drug product.
Dissolution testing.
1.9 VALIDATION PARAMETERS AS PER ICH & FDA GUIDELINES
1.9.1 Specificity:
Specificity is the ability to assess unequivocally the analyte in the presence of components,
which may be expected to be present. Typically, these might include impurities, degradants,
matrix, etc. For formulation assay, a sample matrix may include impurities, degradation
C. L. Baid Metha College of Pharmacy Page 20
specific and sensitive as required for all known relevant degradation products and/or
impurities.
Lack of specificity of an individual analytical procedure may be compensated by other
supporting analytical procedures
This definition has the following implications:
Identification : to ensure the identity of an analyte.
Purity Tests : to ensure that all the analytical procedures performed allow an
accurate statement of the content of impurities of an analyte, i.e.
related substances test, heavy metals, residual solvents content, etc.
Assay (content or potency): to provide an exact result which allows an accurate
statement on the content or potency of the analyte in a
sample.
1.9.2 Linearity:
The linearity of an analytical procedure is its ability (within a given range) to obtain test
results which are directly proportional to the concentration (amount) of analyte in the
sample. A range of standards should be prepared containing at least 5 different
concentrations of analyte, which are approximately evenly spaced, and span 80-120% of the
label claim.
Acceptance criteria:
Correlation coefficient should be not less than 0.9990.
% of y-intercept should be ± 2.0. % of RSD for level 1 and level 5 should be not more
C. L. Baid Metha College of Pharmacy Page 21 1.9.3 Range:
The range of an analytical procedure is the interval between the upper and lower
concentration (amounts) of analyte in the sample (including these concentrations) for which
it has been demonstrated that the analytical procedure has a suitable level of precision,
accuracy and linearity.
The specified range is in general derived from linearity studies and depends on
the intended application of the procedure. It is established by confirming that the analytical
procedure provides an acceptable degree of linearity, accuracy and precision when applied to
samples containing amounts of analyte within or at the extremes of the specified range of the
analytical procedure.
The following minimum specified ranges should be considered:
For the assay of a drug substance or a finished (drug) product: normally from 80 to120
percent of the test concentration.
For content uniformity, covering a minimum of 70 to 130 percent of the test
concentration, unless a wider more appropriate range, based on the nature of the dosage
form (e.g., metered dose inhalers), is justified.
For dissolution testing: +/-20 % over the specified range.
1.9.4 Accuracy
The accuracy of an analytical procedure expresses the closeness of agreement between the
value, which is accepted either as a conventional true value or an accepted reference value
C. L. Baid Metha College of Pharmacy Page 22
The accuracy may be determined by application of analytical method to an analyte
of known purity (example: reference standard) and also by comparing the results of the
method with those obtained using an alternate procedure that has been already validated.
The true value for accuracy assessment can be obtained in several ways and the
value found as:
One method is to compare the results of the method with results from an established
reference method. This approach assumes that the uncertainty of the reference method is
known.
Secondly, accuracy can be assessed by analyzing a sample with known concentrations and
comparing the measured value with the true value as supplied with the material.
Third method if certified reference materials or control samples are not available, a
blank sample matrix of interest can be spiked with a known concentration by weight or
volume. After extraction of the analyte from the matrix and injection into the analytical
instrument, its recovery can be determined by comparing the response of the extract with the
response of the reference material dissolved in a pure solvent. Because this accuracy
assessment measures the effectiveness of sample preparation, care should be taken to mimic
the actual sample preparation as closely as possible. At each recommended level studied,
replicate samples are evaluated. Accuracy should be assessed using a minimum of
determinations over a minimum of 3 concentrations (3 replicates each of the total analytical
procedure). Validation and as well the accuracy should be within the range 98-102%.
1.9.5 Precision
The precision of an analytical procedure expresses the closeness of agreement between a
C. L. Baid Metha College of Pharmacy Page 23
under the prescribed conditions. Precision of an analytical procedure is usually expressed
the variance, standard deviation of coefficient of variation of a series of measurement.
Precision may be considered at three levels: repeatability, intermediate precision and
reproducibility. Precision should be investigated using homogeneous, authentic samples.
However, if it is not possible to obtain a homogeneous sample it may be investigated using
artificially prepared samples or a sample solution.
For a good method precision, the intra-day and inter-day precisions should be within
the acceptance criteria of % RSD ≤2.0 respectively.
1.9.5.1 Repeatability
Repeatability expresses the precision under the same operating conditions over a short
interval of time. Repeatability is also termed intra-assay precision.
1.9.5.2 Intermediate precision
Intermediate precision expresses within-laboratories variations: different days, different
analysts, different equipment, etc.
1.9.5.3 Reproducibility
Reproducibility expresses the precision between laboratories (collaborative studies, usually
applied to standardization of methodology).
1.9.6 Limit of detection & Limit of quantification
The LOD of an individual analytical procedure is the lowest amount of analyte in a sample,
which can be detected but not necessarily quantified as an exact value. The LOQ of an
individual analytical procedure is the lowest amount of analyte in a sample, which can be
quantitatively determined with suitable precision and accuracy. The typical methods
C. L. Baid Metha College of Pharmacy Page 24
(i) Signal-to-noise ratio: The LOD and LOQ can be expressed as a concentration at a
specified signal-to-noise ratio obtained from samples spiked with analyte.
(ii) Standard deviation of the response and the slope of the calibration curve(s) at levels
approximating the LOD: LOD was defined as 3.3σ/S and LOQ as 10σ/S, where S is
the slope of the calibration curve and σ is the standard deviation that can be
determined based on the standard deviation of the blank, on the residual standard
deviation of the regression line, or the standard deviation of y-intercepts of the
regression lines.
1.9.7 Ruggedness
Ruggedness is the degree of reproducibility of test results obtained by the analysis of the
same samples under a variety of test conditions such as different laboratories, analysis,
instruments, reagent lots, elapsed assay times, temperature, days etc.
It can be expressed as lack influence of the operation and environmental variable on the test
results of the analytical method.
1.9.8 Robustness
It is measure of capacity of an assay to remain unaffected by small but deliberate variation
in method parameters and provide an indication of its reliability in normal usage
degradation and variation in chromatography columns; mobile phase and inadequate method
development are common causes of lack of robustness.
1.10
Parameters in ChromatographyA good resolution of components is achieved by optimization of various parameters such as
Resolution (Rs), number of theoretical plates (N), capacity factor (k'), and peak asymmetry
C. L. Baid Metha College of Pharmacy Page 25 Retention time (Rt)
Retention time is the difference in time between the point of injection and appearance of
peak maxima. Retention time is the time required for 50% of a component to be eluted from
a column. Retention time is measured in minutes or seconds. Retention time is also
proportion to the distance moved on a chart paper; which can be measured in cm or mm.
Figure No 4: Retention time
Retention volume (Rv) - Retention volume is the volume of carrier gas required
to elute 50% of the component from the column. It is product of retention time and
flow rate.
Retention volume = retention time X flow rate
Separation factor (S):-
Separation factor is the ratio of partition co-efficient of the two components
to be separated. It can be expressed and determined by using the following equation:
S= Kb/KA=Ka/Kb= (tb-to)/ (ta-to)
C. L. Baid Metha College of Pharmacy Page 26
Kb, Ka=partition coefficients of b and a
Tb, ta=retention time of substance band a
S= depends on liquid phase, column temperature
If there is more difference in partition coefficient between two compounds, the
peaks are far apart and the separation factors are less.
Capacity factor (k')
It is the measure of how well the sample molecule is retained by the column during an
isocratic separation. It is affected by solvent composition, separation and aging and
temperature of separation.
K’ = V1-V0 /V0
Where V1 = retention volume at apex of the peak
V
0 = void volume of system where an unretained component elutes
Column efficiency (N)
It is called as number of theoretical plates. It measures the band spreading of a peak. When
band spread is smaller, the number of theoretical plate is higher. It indicates to good column
and system performance.
N = 16 (R
t/W) 2
Where, R
t= Retention time
C. L. Baid Metha College of Pharmacy Page 27
Width of peak can be calculated using different methods of calculations. Column efficiency
should be measured under ideal conditions of column, mobile phase and flow rate used. All
these factors affect column efficiency.
Selectivity (α)
It measures relative retention of two components. Selectivity is the function of
chromatographic surface (column), melting point and temperature.
α = K’2/K’1= V2– V0/V1-V0
Resolution
It is a measure of separation between adjacent peaks in chromatogram. The amount of
separation between 2 peaks is a function of 2 parameters. As the difference between
retention time of peak increases, the separation also increases. Resolution is proportional to
difference in retention times of peaks. The amount of separation depends on that portion of
width of each peak which is nearest to the adjacent peak. As half width of peak increases,
the amount of separation between peaks decreases and resolution also decreases.
Rs = 2(Rt
2 – Rt1) / W2 – W
Where, Rt1, Rt2 – retention times of components
W
C. L. Baid Metha College of Pharmacy Page 28 Figure No 5: Resolution oftwo peaks
Peak asymmetric or Tailing Factor
A
F = b/a (at 10% or 5% of peak height)
Figure No 6 :Tailing Factor
Ideal Valves
K' = 2-10 results in good separation
α = 2 good peak separation results
N = 3000-10,000 plates/ column
R
S = 1.5 A good baseline separation occurs
AF = 0.95 – 1.05
If K increases – RS increases but peak becomes broadens
K decreases – R
S decreases but peak becomes sharper
C. L. Baid Metha College of Pharmacy Page 29
N increases – RS increases because peak width narrows
If α increases – R
S increases because peak moves in relation to anterior. 13
Tailing factor establishes the maximum permissible asymmetry of the peak.
T = W / 2 × F
Where: T = Tailing factor
W= Peak width at 5% of peak height
F = time from width start point at of peak height to retention time (Rt)
Mean Value (Average)
It is a measure of the location of the data. It is simply the arithmetic average of data add
them all up and divide by the number of data points. The mean of a set of data is usually
considered the best estimate of the value.14
Where X =mean, n=no of value
Standard Deviation
It is a measure of the spread of data around the sample mean – a precision measure. It is
always in the same units as the mean. Like the mean, it is considered an estimate of the
C. L. Baid Metha College of Pharmacy Page 30
Where S (Xi) =standard deviation, X=mean, n=no of values
Relative Standard Deviation
Relative standard deviation is a measure of the spread of data in comparison to mean of the
C. L. Baid Metha College of Pharmacy Page 31 2. LITERATURE REVIEW
1. RamakrishnaNirogiet.al.,15 developed a LC-ESI-MS/MS method for quantification of ambrisentan in plasma and application to rat pharmacokinetic study. The analyte and the
internal standard (armodafinil) were extracted from plasma by acetonitrile precipitation and
they were separated on a reversed-phase C(18) column with a gradient program. The assay
exhibited a linear dynamic range of 1-2000 ng/mL for ambrisentan in plasma. Acceptable
precision (<10%) and accuracy (100 ± 8%) were obtained for concentrations over the
standard curve range.
2. Douaja M et.al.,16 developed a method for rapid determination of ambrisentan enantiomers by enantio selective liquid chromatography using cellulose-based chiral
stationary phase in reverse phase mode. Six chiral columns were tested in a reversed-phase
system. Excellent enantiomeric separation with the resolution more than 2.5 was achieved
on Chiralcel OZ-3R (cellulose 3-chloro-4-methylphenylcarbamate) using mixture of 20 mM
sodium formate (pH 3.0) with acetonitrile (55:45., v/v).
3. Klivickyet.al.,17 developed a LC/MS/MS method for determination of ambrisentan, midazolam and its metabolite in human plasma. After solid phase extraction on a Strata-X
(Phenomenex) SPE column, the analytes were separated on a Synergi MAX-RP (150×4.6
mm, 4 µm) (Phenomenex) analytical column using isocratic elution with acetonitrile/5mM
ammonium acetate 41:59 (v/v) as a mobile phase.Detection was achieved using tandem
mass spectrometry on a triple quadrupole mass spectrometer.
Ambrisentan-d3,midazolam-d5 and 13 C3-1-hydroxymidazolam were used as internal standards. The calibration curves
were linear between 2.03 and 150 ng/ml for MDL (r2 = 0.9993) and OH-MDL (r2 = 0.9987)
C. L. Baid Metha College of Pharmacy Page 32 4. Jun Xia et.al.,18 developed a method for Synthesis and in vitro evaluation of ambrisentan
analogues as potential endothelin receptor antagonists. A series of novel 2-[(4,
6-dimethylpyrimidin-2-yl) oxy]-3, 3-diphenyl butyric acid derivatives were synthesized and
evaluated for their antagonistic activity for endothelin-1-induced contraction in rabbit aorta.
5. Johanna Weiss et.al.,19 made an in vitro study on Differential modulation of the expression of important drug metabolising enzymes and transporters by endothelin-1
receptor antagonists ambrisentan and bosentan. LS180adenocarcinoma cells were treated for
four days with bosentan or ambrisentan (1–50 μM), the positive control rifampicin, or
medium only (negative control). For evaluation of bosentan also HuH-7 human hepatoma
cells were used. Comparable to rifampicin, bosentan was a moderate to strong inductor for
all cytochrome P450 isozymes and ATP-binding cassette transporters tested, and it also
induced organic anion transporting polypeptides. In contrast, ambrisentan only weakly
induced some of the genes investigated in LS180 cells. These findings corroborate the in
vivo finding that bosentan is much more prone to drug interactions than ambrisentan.
6. JudyW.M.Chenget.al.,20 demonstrated the role of Ambrisentan for the Management of Pulmonary Arterial Hypertension. The available clinical data suggest that
ambrisentan is an effective and well-tolerated therapy for the management of PAH
7. Ronald J.Oudizet.al.,21 made a study on Long-Term Ambrisentan Therapy for the Treatment of Pulmonary Arterial Hypertension. After 2 years of ambrisentan exposure, the
mean change from baseline in 6-min walk distance was improved for the 5-mg (23 m., 95%
confidence interval: 9 to 38 m) and 10-mg (28 m., 95% confidence interval: 11 to 45 m)
groups. Two years of ambrisentan treatment was associated with sustained improvements in
exercise capacity and a low risk of clinical worsening and death in patients with PAH.
Ambrisentan was generally well tolerated and had a low risk of aminotransferase
C. L. Baid Metha College of Pharmacy Page 33 8. J. Dupuis et.al.,22 investigated the role of Endothelin receptor antagonists in Pulmonary
arterial hypertension. The endothelin (ET) system, especially ET-1 and the ETA and ETB
receptors, has been implicated in the pathogenesis of pulmonary arterial hypertension
(PAH). Together with prostanoids and phosphodiesterase 5 inhibitors, ET receptor
antagonists have become mainstays in the current treatment of PAH. Three substances are
currently available for the treatment of PAH. One of these substances, bosentan, blocks both
ETA and ETB receptors, whereas the two other compounds, sitaxsentan and ambrisentan,
are more selective blockers of the ETA receptor.
9. MichaelD.McGoonet.al.,23made a study on ambrisentan therapy in patients with pulmonary arterial hypertension who Discontinued Bosentan or Sitaxsentan Due to Liver
Function Test Abnormalities. Patients who previously discontinued bosentan and/or
sitaxsentan due to LFT abnormalities received ambrisentan, 2.5 mg qd, for 4 weeks
followed by 5 mg/d for 8 w.eeks. The primary end point was the incidence of
aminotransferase levels more than three times ULN considered by the investigator to be
related to ambrisentan and resulting in drug discontinuation. Secondary end points included
aminotransferase levels more than five times ULN requiring drug discontinuation and more
than three times ULN requiring dose reduction, as well as changes in 6-min walk distance
(6MWD
10. Nazzareno Galièet.al.,24 conducted Randomized, Double-Blind, Placebo-Controlled, Multicenter, Efficacy (ARIES) tests in patients receiving ambrisentan for PAH therapy and
concluded that Ambrisentan improves exercise capacity in patients with pulmonary arterial
hypertension and it is is well tolerated and is associated with a low risk of aminotransferase
C. L. Baid Metha College of Pharmacy Page 34 11. BrianCasserlyet.al.,25 conducted a study on role of Ambrisentan in the treatment of
pulmonary arterial hypertension and concluded that Ambrisentan appears to be a safe and
efficacious treatment for PAH patients in WHO functional class II or III.
12. Rebecca Spence et.al.,26 reported the pharmacokinetics and Safety of Ambrisentan in combination with Sildenafil in Healthy Volunteers. The pharmacokinetic interaction
between sildenafil, and ambrisentan, was studied in a 2-period crossover study in 19 healthy
volunteers, with ambrisentan exposure (AUC0-∞) and Cmax determined over 24 hours for a
10-mg dose of ambrisentan alone and again after 7 days of sildenafil 20 mg 3 times daily.
The AUC0-∞ and Cmax for sildenafil and N-desmethyl sildenafil (active metabolite) were
determined over 24 hours for a 20-mg dose of sildenafil alone and again after 7 days of
dosing with ambrisentan 10 mg once daily. There was no clinically relevant
pharmacokinetic interaction between ambrisentan and sildenafil or N-desmethyl sildenafil.
13. Gennyne Walker et.al.,27 conducted the pharmacokinetics and pharmacodynamics of warfarin in combination with ambrisentan in healthy volunteers. Twenty two healthy
subjects were administered a single dose of racemic warfarin 25 mg alone and after 8 days
of ambrisentan 10 mg once daily. Assessments included exposure (AUC0–last) and
maximum plasma concentration (Cmax) for R and S-warfarin, and International Normalized
maximum observerved value (INRmax) and area under the curve (INRAUC(0–
last)).Ambrisentan had no significant effects on the (AUC0–last)of R-warfarin or S-warfarin.
In addition, coadministration of warfarin did not alter ambrisentan steady-state
pharmacokinetics. Adverse events were infrequent, and there were no bleeding adverse
events.
14. HartmutVatteret.al.,28 demonstrated the role of ambrisentan as a Non-peptide Endothelin Receptor Antagonist, concluded that because of convenient physiological and
C. L. Baid Metha College of Pharmacy Page 35
essential role in the therapy of diseases, for which a potent ETA-receptor antagonist with a
moderate selectivity is the most customized approach.
15. Ori Ben-Yehuda et.al.,29 conducted a study on Long-Term Hepatic Safety of Ambrisentan in Patients With Pulmonary arterial hypertension. No evidence of an
association between ambrisentan therapy and hepatotoxicity was identified
16. Rebecca Spence et.al.,30 reported the Pharmacokinetics and Safety interactions of
Ambrisentan in Combination With Taldafil in Healthy Volunteers. Single-dose PK of
ambrisentan (10 mg) and its metabolite, 4-hydroxymethyl ambrisentan, were determined in
the absence and presence of multiple doses of tadalafil (40 mg QD). Similarly, single-dose
PK of tadalafil (40 mg) were evaluated in the absence and presence of multiple doses of
ambrisentan (10 mg QD). In the presence of tadalafil, ambrisentan maximum plasma
concentration (Cmax) was similar and systemic exposure (AUC0–∞) was slightly decreased
compared with ambrisentan alone.
17. M. Halanket.al.,31 conducted a study on patients with ambrisentan therapy and concluded that Ambrisentan Improves Exercise Capacity and Symptoms in Patients with
Portopulmonary Hypertension. No significant changes in blood gas analysis and liver
function tests (aspartate aminotransferase, alanine aminotransferase, total bilirubin, and
international normalized ratio) during therapy with ambrisentan were detectable.
18.J.Craig Hartman et.al.,33 Evaluated the endothelin receptor antagonists ambrisentan, darusentan, bosentan, and sitaxsentan as substrates and inhibitors of hepatobiliary
transporters in sandwich-cultured human hepatocytes, and concluded that Bosentan and
Sitaxsentan ,but not Darusentan and Ambrisentan inhibit human hepatic transporters which
C. L. Baid Metha College of Pharmacy Page 36
3.1 AIM & OBJECTIVE OF WORK
The drug analysis plays an important role in the development of new analytical
methods, their manufacture and the therapeutic use. Pharmaceutical industries rely upon
quantitative chemical analysis to ensure that the raw materials used and the final product
obtained meets the required specification. The components monitored include chiral or
achiral drug process impurities, residual solvents excipents such as preservatives,
degradation products, extractable and leachable matterfrom containers and closuresetc.
Ambrisentan is indicated for the treatment of patients with pulmonaryarterial
hypertension (PAH) classified as World Health organisation (WHO) functionalclass (FC) II
and III, to improve exercise capacity. Ambrisentan, is a propanoic acid-classan endothelin
receptor antagonist that isselective for the endothelin type-A (ETA) receptor. It is a Bio
pharmaceutics Classification System Type II drug.It has a low potential for drug-drug
interactions when compared to other endothelin receptor antagonists and requires only
once-daily administration.
The extensive literature survey reveals that no method has been developed for the
estimation of Ambrisentan in tablet dosage form. The objective of the present work is to
develop a specific, precise, accurate, linear, simple, rapid and validated RP-HPLC method
forAmbrisentan.
The specific aim of the research was
To develop a RP-HPLC method for determination of Ambrisentan in tablet dosage
form.
Validate the optimized method in accordance with ICH guidelines for the intended
C. L. Baid Metha College of Pharmacy Page 37
3.2 PLAN OF WORK
Collection and Identification of AmbrisentanSummary and Conclusion Results and Discussion Validation as per ICH guidelines
Specificity
Linearity and range Accuracy
Precision
LOD
LOQ
Robustness System suitability
Assay
Selection of best trials
Experimental investigation (Method Development) Selection of column
Selection of mobile phase
Selection of chromatographic conditions Optimization of chromatographic and spectral
conditions
C. L. Baid Metha College of Pharmacy Page 38
4. DRUG PROFILE
35Ambrisentan
Chemical formula :C22H22N2O.
Structure :
Chemical name :(2S)-2-[(4, 6-dimethylpyrimidin-2-yl) oxy]-methoxy- 3,
3-diphenylpropanoic acid
Molecular weight : 378.421gm/mol
Description : white to off-white crystalline substance.
Solubility : Insoluble in water (0.06 mg/ml) and soluble in aqueoussolutions of
high pH
PKa : 4.0
Category :Endothelin type A (ETA)-selective receptor antagonist
Dose :5 or 10 mg in tablet
Mechanism of action36
Ambrisentan is an orally active, propanoic acid-class, endothelin receptor antagonist
(ERA) that is selective for the endothelin type A (ETA) receptor. Selective inhibition of the
C-C. L. Baid Metha College of Pharmacy Page 39
mediated cell proliferation, while preserving nitric oxide and prostacyclin production, cyclic
GMP- and cyclic AMP-mediated vasodilation, and endothelin-1 (ET-1) clearance that is
associated with the endothelin type B (ETB) receptor.
Pharmacokinetics 36
Absorption
The absolute bioavailability of ambrisentan is not known. Ambrisentan is absorbed
rapidly in humans. After oral administration, maximum plasma concentrations (Cmax) of
ambrisentan typically occur between 539-1147 ng/ml around 1.5 hours post dose under both
fasted and fed conditions.37Cmax and area under the plasma concentration-time curve
(AUC) increase dose proportionally over the therapeutic dose range. Steady-state is
generally achieved following 4 days of repeat dosing.
Distribution
Ambrisentan is highly plasma protein bound. The in vit