Faculty of Engineering and Surveying
Development of a Mechanical Testing
System to Investigate Road Deformation
A dissertation submitted by
Ryan Domrow
In fulfilment of the requirements of
Courses ENG4111 and 4112 Research Project
towards the degree of
Bachelor of Engineering (Mechanical)
Abstract
Damage to road pavement is a common occurrence in areas near road intersections. This type of road damage is caused by frequent decelerations and accelerations of vehicles near the intersections. When this occurs, the road is said to have failed due to repeated surface tractions. Through the development of a mechanical testing system to investigate road deformation, a better understanding of the effect of surface traction forces on road pavements will be acquired.
The purpose of this project is to develop a mechanical testing system for investigating surface traction forces, and to provide engineers with a better understanding of these forces that can lead to improved road design. Improved road design will not be investigated in this project, and neither will the performance of various road designs.
Certification
I certify that the ideas, designs and experimental work, results, analyses and conclusions set out in this dissertation are entirely my own effort, except where otherwise indicated and acknowledged.
I further certify that the work is original and has not been previously submitted for assessment in any other course or institution, except where specifically stated.
Ryan Domrow
Student Number: Q12221617
_________________________________________
Signature
_______27 October 2005_______________
Acknowledgements
I would like to acknowledge and thank my supervisor Dr. Selvan Pather for his contribution and assistance throughout the entirety of my project
I would also like to thank Dr Jim Shiau for the original project idea, and also for allowing me to work on the project.
I would also like to acknowledge my family and friends for their continual help and support throughout the year.
RYAN DOMROW
Contents
Abstract... ii
Acknowledgements ... v
List of Figures... x
List of Tables ... xii
Chapter 1 ... 1
1.1 Overview... 2
1.2 Goals ... 3
1.3 Need ... 3
1.4 Methodology ... 4
1.5 Conclusion ... 5
Chapter 2 ... 6
2.1 Accelerated Pavement Testing... 6
2.2 Non-Destructive Testing ... 7
2.2.1 Static or Slow Moving Deflection ... 8
2.2.2 Steady State or Dynamic Vibratory Equipment... 8
2.2.3 Impulse Deflection Equipment ... 9
Chapter 3 ... 11
3.1 Heavy Vehicle Simulator ... 11
3.1.1 Specifications... 12
3.1.2 Advantages... 13
3.1.3 Disadvantages ... 13
3.2 Falling Weight Deflectometers ... 13
3.2.4 Disadvantages ... 16
3.3 Rolling Weight Deflectometer ... 16
3.3.1 Specifications... 17
3.3.2 Method of Measurement ... 17
3.3.3 Advantages... 17
3.3.4 Disadvantages ... 18
3.4 Accelerated Loading Facility ... 18
3.4.1 Specifications... 19
3.4.2 Method of Measurement ... 20
3.4.3 Advantages... 21
3.4.4 Disadvantages ... 21
3.5 The Wheel Tracker ... 22
3.5.1 Specifications... 23
3.5.2 Method of Measurement ... 23
3.5.3 Advantages... 24
3.5.4 Disadvantages ... 24
3.6 Sydney Pavement Testing Facility... 24
3.6.1 Specifications... 25
3.6.2 Method of Measurement ... 27
3.6.3 Advantages... 28
3.6.4 Disadvantages ... 28
Chapter 4 ... 30
4.1 Initial Conceptual Design ... 30
4.2 Overhead Rail Concept ... 32
4.3 Rails Concept ... 35
4.4 Decision Matrix for Carriage Design... 36
4.5 Scoring Explanation... 38
4.6 Conclusion ... 41
5.1.2 Electric Three Phase AC Motors ... 49
5.1.3 Electric DC Motors ... 52
5.1.4 Hydraulic Motors ... 56
5.1.5 Motor Decision Matrix ... 58
5.1.6 Motor Decision Matrix Scoring Explanation... 60
5.2 Rails and Wheels... 62
5.2.1 Rails ... 62
5.2.2 Wheels... 64
5.2.3 Rails and Wheels Decision Matrix ... 65
5.2.4 Rails and Wheels Decision Matrix Scoring Explanation... 66
5.3 Lifting Mechanism... 67
5.3.1 Pivot Concept... 67
5.3.2 Actuator... 68
5.4 Return System ... 70
5.4.1 Second Motor on Carriage ... 71
5.4.2 Belt Drive Return System ... 71
5.4.3 Cable Return System... 73
5.5 Methods of Control ... 74
5.5.1 Light Screens ... 74
5.5.2 Limit Switches ... 75
5.5.3 Control Selection ... 77
Chapter 6 ... 78
6.1 Wheel Specification ... 78
6.2 Belt Drive Reduction Ratio... 79
6.3 Electric Motor Specification ... 80
6.4 Rail Specification... 82
6.5 Belt Drive Specification... 84
6.6 V-groove Wheel Specification... 87
6.7.3 Carriage Framework ... 88
6.7.4 Safety Enclosure ... 89
6.8 Final Design ... 89
Chapter 7 ... 91
7.1 Conclusion ... 91
7.2 Further Work... 92
References ... 93
APPENDIX A ... 98
APPENDIX B ... 100
APPENDIX C ... 102
APPENDIX D ... 105
APPENDIX E ... 107
List of Figures
Figure 3.1: Heavy Vehicle Simulator ... 12
Figure 3.2: Heavy Vehicle Simulator Tyre Configuration ... 12
Figure 3.3: Falling Weight Deflectometer ... 14
Figure 3.4: Heavy Weight Deflectometer ... 15
Figure 3.5: Rolling Weight Deflectometer ... 16
Figure 3.6: Accelerated Loading Facility ... 19
Figure 3.7: The Wheel Tracker ... 22
Figure 3.8: Sydney Pavement Testing Facility ... 25
Figure 3.9: Plan of Test Track at Sydney Pavement Testing Facility ... 26
Figure 4.1: Overhead Crane ... 31
Figure 4.2: Overhead Rail Concept Design ... 33
Figure 4.3: 3D view of Overhead Rail Concept ... 34
Figure 4.4: Carriage for Rails Concept ... 35
Figure 4.5: Rails Concept - Final Design... 41
Figure 5.1: AC Motor ... 43
Figure 5.2: DC Motor Stage 1... 52
Figure 5.3: DC Motor Stage 2... 53
Figure 5.4: DC Motor Stage 3... 53
Figure 5.5: Rail Mounting Possibilities ... 63
Figure 5.6: Wheel Types to suit Rails... 64
Figure 5.7: Pivot Concept for Lifting Mechanism... 68
Figure 5.8: Linear Actuator Concept for Lifting Mechanism... 69
Figure 5.9: Different Configuration of Linear Actuator ... 70
Figure 5.13: Simple Limit Switch Diagram... 76
Figure 5.14: Limit Switch Diagram with Diode ... 76
Figure 5.15: Limit Switch Diagram with Two Switches and Diodes ... 77
Figure 6.1: Belt Drive Diagram ... 85
Figure 6.2: GT2 Belt Selection Guide ... 86
Figure B.1: Excerpt from Fallshaw Catalogue for Pneumatic Wheels ... 101
Figure C.1: Excerpt from Baldor Pty Ltd Catalogue for Electric Motors (p12)... 103
Figure C.2: Excerpt from Baldor Pty Ltd Catalogue for Electric Motors (p13)... 104
Figure D.1: Excerpt from One Steel Catalogue for Square Hollow Section Steel Properties ... 106
Figure E.1: Excerpt from Rapid Smart Catalogue for V-Groove Wheels ... 108
Figure F.1: Excerpt from AB Catalogue for Limit Switches... 110
List of Tables
Table 3.1: Specifications of Sydney Pavement Testing Facility ... 27
Table 4.1: Legend for Figure 4.2 ... 33
Table 4.2: Criterion for Carriage Conceptual Design ... 36
Table 4.3: Criterion and Weighting for Carriage Conceptual Design ... 37
Table 4.4: Decision Matrix for Carriage Conceptual Design ... 38
Table 5.1: Criterion and Weighting for Electric Motor Decision Matrix ... 59
Table 5.2: Decision Matrix for Electric Motor ... 60
Table 5.3: Criterion and Weighting for Rails and Wheels Decision Matrix ... 65
Table 5.4: Decision Matrix for Rails and Wheels... 66
Chapter 1
Introduction
“Determining the condition of pavement structures is not easy. It is also extremely important to our daily lives and helps determine the amount we spend on pavements and their repair.” (Bandara, N. & Briggs, R. C., 2004)
There are only a limited number of machines available capable of determining the condition of a pavement structure. For this reason, it has been decided to design a facility capable of applying accurate, simulated traffic loads to a pavement section, and also capable of allowing investigation into the deformation of the layers of the pavement under the surface.
model will allow the wheel to move across the section of test track, lifted above the track, returned to the start, and placed down on the track to being another cycle. These parameters are needed to ensure an accurate simulation of traffic conditions while conducting the experiments on the road pavement.
1.1 Overview
The aim of this project is to design and build a mechanical system to investigate the deformation of road surfaces. The system will be assembled inside a laboratory where conditions can be controlled and altered to simulate variations in weather experienced by road surfaces.
This will involve a mechanical system composed, most probably, of a motor, gearbox, belt drive, and a driving wheel. The wheel will complete a run over a test section of road, be lifted clear of the test track, returned the start of the track, and placed back down on the track. This process will repeat for a large number of cycles, using a process called accelerated pavement testing to create road deformation in this experiment.
In order to do this, all current methods of measuring road deflection will have to be investigated, with research into the areas of accelerated pavement testing (APT) and non-destructive testing (NDT). Research on individual components will also be conducted in order to achieve the best overall design.
1.2 Goals
The overall goal of this project is to develop a mechanical system to investigate the deformation of roads. However, there are certain constraints that need to be considered when choosing the final design.
The project is constrained by a budget, meaning the best-designed system may not be the system that will get built. Consideration will be given to the performance of each component, with the best value for money components being chosen for the final design.
Availability of components is also another issue to be considered. As the project is also constrained by a timeline, preference will be given to components that are readily available rather than those that must be delivered, from either interstate or overseas.
The project also aims to develop a test facility to provide data for better road design. The results obtained from these experiments will allow for the calculation of the elastic modulus of the road, and therefore the fatigue life and maximum stress can all be found from further experimentation and calculation. The structural adequacy of the road can also be obtained from the experiments, as well as an overall estimate of the remaining life of the road.
1.3 Need
designing will allow the user to see clearly the layers that are deforming, and therefore the results obtained could lead to better road design.
A similar test track located at the Sydney University Pavement Testing Facility is inefficient in a number of ways (see Section 3.6) and also utilises outdated technology. In order to better simulate road traffic, and therefore achieve more accurate road deformation, it has been decided to improve upon the Sydney design with the new mechanical system.
1.4 Methodology
In order to achieve the best final design, ideas from a number of different areas must be looked at. These areas definitely include looking specifically at the current methods of simulation of road traffic. New ideas could also be found in equipment not related to traffic simulation, so any components of machinery that undergoes similar loading or movement to the proposed testing system will be considered.
The current mechanical testing system in Sydney at the Sydney University Pavement Testing Facility also featured strongly when choosing both components and an overall system design. However, this system was designed almost 15 years ago and has become somewhat outdated.
After collating all the data found while researching different designs, a number of designs for a mechanical testing system were proposed. Each of these systems has advantages and disadvantages, and to choose the most beneficial system a decision matrix was used.
1.5 Conclusion
Chapter 2
Background
There are two main areas of pavement testing that apply to this project. They are accelerated pavement testing (APT) and non-destructive testing (NDT). Both methods of testing have strengths and weaknesses, and the final design for my mechanical system will need elements from both methods.
2.1 Accelerated
Pavement
Testing
APT allows for the monitoring of pavement performance and response to accelerated accumulation of damage within a shorter time frame, providing road engineers with valuable information concerning the behaviour, performance, and life expectancy of pavement structures. This ultimately results in enhanced understanding of pavement structures and improved, cost effective design and rehabilitation construction methods.
APT furthermore provides a controlled testing environment in which innovative
pavement designs and new materials can be tested and validated in a short period without the financial risks associated with failures of in-service experimental pavements.
The costs involved with full-scale APT testing on test roads using actual traffic initiated research into alternative methods of APT. Currently APT is differentiated into three main categories namely: full scale test roads; mobile APT units; and fixed APT units.
Full-scale test roads are APT facilities at which actual vehicle traffic is utilised for the application of loading.
Mobile APT units are load frames with variable axle and wheel configurations designed to simulate the load application of actual vehicle traffic on a limited test section. Mobile APT units can be transported to various locations for testing and are applicable to the investigation of in-service pavements in addition to specifically constructed test sections.
Fixed APT units also utilise load frames for load application but have a fixed location and cannot be transported easily to various testing locations. [4]
2.2 Non-Destructive
Testing
to calculate the elastic modulus of asphalt, pavement structural adequacy, and the remaining structural life.
There are three main types of non-destructive deflection testing, which are static or slow moving deflection testing, steady state or dynamic vibratory deflection testing, and impulse deflection testing. [4]
2.2.1 Static or Slow Moving Deflection
Static deflection equipment is used to measure pavement surface deflections under static or slow moving loads. The most common piece of equipment used for this is the Benkelman beam. This method of testing provides deflection measurements at any number of points under a non-moving or slow moving load. The Benkelman beam test procedure involves the measurement of a pavement surface rebound with a cantilevered beam as a truck loaded to 80 kN on its rear axle moved from rest. Measurements are made between dual tires on the rear axle at specified intervals in the outer wheel path.
The main advantages of these static or slow moving deflection testing devices are simplicity, low instrument cost and the possibility of utilising realistic load levels. The disadvantages of these devices are that they are slow, labour intensive, do not provide a true deflection basin, and suffer relatively poor precision and bias. [4]
2.2.2 Steady State or Dynamic Vibratory Equipment
However, these systems are generally highly reliable with low maintenance and can produce a full deflection basin. Disadvantages include a significantly low dynamic load, relatively large static preload, susceptibility to errors due to pavement resonance effects and inadequate dynamic load to test heavy pavements. [4]
2.2.3 Impulse Deflection Equipment
Currently, impulse deflection equipment is the most popular and widely used pavement deflection measurement technology. All impulse type NDT devices produce a transient load to the pavement surface typically lasting 25 to 30 ms. The impulse load is generated by a falling mass from one or more predetermined heights. The resulting load pulse is transmitted to the pavement as a half sine wave. The peak deflections and load magnitude are captured, reported and automatically stored
Impulse load devices can apply loads from 1360 to over 22 700 kg based on the device used. This equipment has a relatively low preload so its influence on the pavement response is negligible.
Deflections are most commonly measured with velocity transducers (seven or more), which are mounted on a bar and automatically lowered to the pavement surface with the loading plate. One transducer is located in the centre of the loading plate and others are located at different distances from the loading plate.
2.3 Conclusion
Chapter 3
Current Equipment
There are several current machines specifically designed to measure the deflection in a road surface. These include the Heavy Vehicle Simulator, which fits into the APT area, as well as the Rolling Weight Deflectometer, Falling Weight Deflectometer, and Heavy Weight Deflectometer, which are all in the NDT area of road deflection measurement.
3.1
Heavy Vehicle Simulator
Figure 3.1: Heavy Vehicle Simulator [15]
3.1.1 Specifications
The HVS is electrically powered with hydraulic motors for use inside specific facilities. It is also equipped with a diesel engine to move from test-point to test-point. It weighs approximately 46 tons with dimensions of 22.6 m x 3.5 m. It is capable of applying wheel loads varying from 4 tons to 30 tons per axle (nearly four times the national legal maximum), through a standard half axle dual truck tyre configuration or modified aircraft wheel configuration.
A total of 14000 single directional passes can be completed in 8 hours at a speed of between 13 and 16 km/h. This enables the HVS to apply 20 years worth of heavy traffic in only four or five months. [15]
3.1.2 Advantages
The HVS has several advantages over other simulators, such as being able to simulate a wide range of loading possibilities. The HVS is also the only simulator able to simulate environmental conditions such as temperature and moisture variations above the road surface. This is useful when the local weather is quite unstable with large variances in temperature and humidity, either throughout the day, or over a longer period of time. As mentioned above, the HVS is capable of uni-directional passes to properly simulate road traffic. This ability is an incredible advantage when trying to precisely simulate traffic conditions, and is one of the main design points for the system I am designing. [15]
3.1.3 Disadvantages
Size is the main limiting factor of the HVS. The newest model is almost 23m long and has a mass of 46 tons. Therefore the mobility of the HVS is directly affected. The HVS must be towed to the test site, but it is equipped with a diesel engine to manoeuvre about the test site rather slowly. The other main drawback of the HVS is that it cannot
investigate the deformation caused during the test. Separate equipment is used to
measure the deformation, but most importantly, the specific layers of road base that have deformed throughout the test are unknown. [15]
3.2
Falling Weight Deflectometers
engineering methodology, a system of advanced automated pavement measurement, analysis and management engineering services and products. [8]
3.2.1 Specifications
There are two main types of falling weight deflectometers, the Falling Weight Deflectometer (FWD) and the Heavy Weight Deflectometer (HWD). The two are similar and use the same technology to measure the deflection of road surfaces. The FWD is capable of applying loads from 7 to 120 kN, whereas the HWD can apply loads up to 240 kN. The range of Falling Weight Deflectometers were designed primarily for multi-purpose pavement applications ranging from unpaved roads to airfields. However, the HWD is the only one in the range capable of use on airfields. [8]
Figure 3.4: Heavy Weight Deflectometer [8]
3.2.2 Method of Measurement
The use of a FWD enables the user to determine a deflection basin caused by a controlled load with accuracy. The FWD applying a dynamic impulse load to an area of pavement causes the deflection basin. Measurements are taken by optical sensors and collated by a computer before the load is released and the pavement returns to its original position. The optical sensors measure the difference in time it takes to reflect a beam from the pavement in its original position to the time it takes in the deflected position. Knowing the velocity of the optical beams sent out, the distance the pavement has deformed can be calculated. [8]
3.2.3 Advantages
3.2.4 Disadvantages
The main limitation of the FWD and the HWD is the cycle time. While stationary above one test point, the FWD and HWD have fairly good cycle times, but the limitation becomes evident the machinery must be frequently moved between a number of test points. Each time they must be disassembled at the previous point, moved into position by a separate vehicle, and then reassembled and calibrated at the new point. This amounts to a best cycle time of around 60 test points in each hour. Again, the FWD and HWD can only apply the loads and give no indication into which layers in the road deform under certain types of loads rather than others. [8]
3.3 Rolling
Weight
Deflectometer
The Rolling Weight Deflectometer (RWD) is a device designed to measure and record road deflections at highway speeds, thereby eliminating the need for road closure or specific test facilities. It also helps officials target funding and projects to the segments of road that need structural improvement and rehabilitation. However, the RWD is still in the prototype stage in America and production models are unavailable. [17]
3.3.1 Specifications
The RWD is actually a regular semitrailer 16m long with an aluminium beam running underneath the length of the trailer. The beam measures 7.8m long x 51mm wide x 216mm high and is specifically designed to house four lasers spaced 2.6 metres apart. The beam is mounted on the right side of the trailer, which in America is the side closest to the weakest part of the road, the outside edge. The semitrailer places over 80kN of dead weight over the rear axle of the dual axle trailer. [17]
3.3.2 Method of Measurement
The Harr approach is the most commonly used method to measure the deflection of a road surface. Put simply, it involves gauging the distance from a reference datum to the road surface at three equally spaced points ahead of the load wheel. Once the load wheel has moved forward a distance equal to the spacing between the measurement points, the same three points on the pavement are measured again using the second, third, and fourth sensors. In the case of the prototype RWD, this distance is 2.6m.
The only disadvantage of the Harr approach is the need for the reference datum to be absolutely straight at all times. Obviously, with temperature and loading variations it is impossible to keep the aluminium beam perfectly straight. It is for this reason a set of optical alignment sensors is mounted on each pavement height laser. With constant measurements being taken, the accuracy of the pavement height laser is around 20 µm. [17]
3.3.3 Advantages
loading mechanism; rather it uses the weight of the semitrailer to which it is attached. [17]
3.3.4 Disadvantages
The first disadvantage of the RWD is that it is a relatively new technology. This means it will not be commercially available for some time, and will also probably need several iterations to find and fix flaws in the system. For instance, it has been found the RWD experiences a warming up effect prior to the stabilisation of readings, where the first one or two runs over a test section show markedly higher deflections than the others. Also, when compared with the HVS, it has a relatively slow rate of loading. While the HVS can simulate 20 years accumulation of traffic in only a few months, the RWD only simulates one heavy vehicle for each pass completed over a test section. While the results may arguably be more accurate, the HVS would still be the preferred choice of heavy traffic simulator for the sheer volume of traffic it can simulate. [17]
3.4 Accelerated
Loading
Facility
Figure 3.6: Accelerated Loading Facility [12]
3.4.1 Specifications
The ALF consists of a reciprocating rolling wheel load mechanism used to test pavements. The wheel assembly travels at 8km/h while testing in one or both directions, and with optional random lateral wheel wander of up to 25cm. The 12m wide pit permits testing at several locations across a full-scale pavement facility. The ALF offers considerable flexibility in testing pavements. Not only can different pavement, base, and subgrade materials be tested and compared under known conditions, the heavy duty loading mechanism permits the evaluation of various tire configurations and load levels on performance. These features make it easily the most advanced vehicle simulator when the loading mechanism alone is considered. Current worldwide projects utilising the ALF include studies of ultrathin concrete, verification of three-dimensional pavement models, dowel bars, materials, and other aspects of flexible and rigid pavement structures.
attributes that set it apart from similar machinery around the world. Major features include:
• Bitumen and concrete testing capability,
• Full access for construction equipment to place pavements in accordance with standard highway specifications,
• Multiple test paths across the 6m wide pavement,
• Broad loading versatility with the ability to use various wheel loading configurations, loads from 4000kg to 14000kg, as well as optional random lateral wander of the loaded wheel or wheels, depending on the configuration, to better simulate road traffic,
• Full environmental control within the enclosed test facility to regulate air temperature and humidity. Moisture also can be added to the subsurface pavement structure,
• Optional instrumentation to monitor pavement response to environmental changes and/or dynamic loading.
All of these features together make one of the most advanced traffic simulators throughout the world; making it a popular choice when large scale accelerated pavement testing is needed. [23]
3.4.2 Method of Measurement
While it does have an advanced loading mechanism, the ALF itself does not measure the road deformation it causes. The current idea is for separate facilities to construct their own test pits of pavement and hire an ALF to conduct the accelerated pavement testing. Once the tests are finished, the measurements will be undertaken at the facility to determine the extent of the deformation.
building. An example of this is at Ohio University, where a substantial grant of $1.35 million was given for the construction of a fully enclosed accelerated pavement loading facility. The facility itself consists of the environmental room housing the ALF, and also a dedicated test pit. To reiterate though, while the ALF can be used effectively in conjunction with dedicated facilities to both apply various loading patterns and to measure the deformation, the ALF itself is not capable of measuring the deformation, and is certainly not capable of investigating the deformation further. [23]
3.4.3 Advantages
As mentioned before, the main advantage of the ALF is the advanced loading mechanism. While they vary slightly from machine to machine, the exact specifications for one ALF were available and are listed below.
• Load Range: 40kN to 140kN
• Test Directions: Uni or Bi directional
• Test length: 10.5m
• Tires: Standard single, standard duals, and wide-base single
• Lateral Wheel Wander: Random up to 25cm optional
• Test Speed: up to 8km/h
• Load Applications per Hour: 250 for unidirectional tests, 500 for bidirectional test. [23]
3.4.4 Disadvantages
The other major disadvantage of the ALF is the need for extra equipment to both measure and investigate the deformation caused during the pavement testing. As already shown, many pavement-testing machines throughout the world do not investigate the deformation they cause, and in cases such as the HVS and ALF, they do not even measure the deformation caused. This is the area that will be rectified by this project through the design of a system that can both effectively measure and investigate the deformation caused during the test. [12]
3.5
The Wheel Tracker
[image:34.595.170.425.435.651.2]The Wheel Tracker, shown below in figure 3.7, is a machine designed specifically to assess the resistance of road surfaces to deformation from simulated traffic conditions. Slightly different versions of the Wheel Tracker are available due to the number of different companies manufacturing the system. [20]
3.5.1 Specifications
The Wheel Tracker consists of loaded wheel that travels on a test sample of pavement held on a moving table. The table moves with simple harmonic motion through a distance of 230mm. This differs from the other accelerated pavement testing machinery in that it is the only system where the wheel is held stationary. The table has a frequency of 42 passes per minute. The diameter of the loaded wheel is 200mm and has a thickness of 50mm. A load of 520N is applied to the tyre under standard operating conditions.
The actual cabinet in which the wheel and test section are enclosed can be used to vary both temperature and humidity. Some variations of the Wheel Tracker allow a range of 30°C to 60°C, whereas other models range from 30°C to as high as 65°C.
The Wheel Tracker encompasses a safety device to prevent injury during operation of the machine. Safety switches are fitted to the polycarbonate doors of the cabinet that prevent operation of both the drive and temperature control systems when the doors are opened. [20]
3.5.2 Method of Measurement
The Wheel Tracker is fitted with a LVDT to monitor the depth of the rut during the experiment. The unit can also be fitted with two thermocouple inputs for optional specimen temperature measurement.
3.5.3 Advantages
The Wheel Tracker offers several advantages over the other traffic simulators investigated. It is the first design to actually scale down the sizes and forces to make operation both simpler and less expensive. Also, another excellent advantage of the Wheel Tracker is its computer compatibility. This compatibility means the entire system can be controlled externally by a single operator and also eliminates the need for any immediate human presence during operation, eliminating the possibility of workplace injury.
Another advantage offered by the Wheel Tracker is the extremely low cycle time. Completing 42 passes in 60 seconds deform the pavement extremely quickly, meaning useful results can be obtained in a short period of time. [20]
3.5.4 Disadvantages
While the cycle time of the Wheel Tracker is high, moving the pavement sample with simple harmonic motion underneath the wheel will result in bi-directional passes. While this results in a high cycle time, it is not really an accurate simulation of forces on a road surface as traffic generally travels in only one direction over an area of pavement.
Although the Wheel Tracker is cheaper than its large-scale counterparts, the price of the system is outside that of the budget for this project. The Wheel Tracker retails at QCQA.com for $27 800 US, or about $39 700 AUD. While purpose-built facilities such as that at Ohio University in America cost more than 1 million dollars, the price of the Wheel Tracker is still high enough to push it outside the boundaries of this project. [20]
3.6
Sydney Pavement Testing Facility
randomly change the position of the tyre across the pavement. The facility consists of a test bed, an overhead track, and the loading carriage. [26]
Figure 3.8: Sydney Pavement Testing Facility [26]
3.6.1 Specifications
Figure 3.9: Plan of Test Track at Sydney Pavement Testing Facility [26]
The track itself is an oval configuration measuring an overall length of 5170mm by 1500mm across. The test tank measures 1.4m long by 0.5 m wide. It consists of two hollow steel boxes bolted together to allow the lower boxed to be used to prepare a soil layer if required, and for different materials to be placed in the upper box. A false bottom can be placed into the tank to simulate different pavement thickness if required.
Specifications of Sydney Pavement Testing Facility
Feature Specification
Speed Range (km/h) 0 – 7.2
Wheel Load (kN) 0 – 1.4
Maximum Tyre Pressure (kPa) 500
Tyre Width (mm) 45
Length of Test Section (m) 1.4
Width of Test Section (m) 0.5
Maximum Depth of Tank (m) 0.8
Length of Test Track (m) 12.15
Cycle Time at 1 km/h (s) 44.0
[image:39.595.83.516.122.379.2]Motor Power (kW) 0.75
Table 3.1: Specifications of Sydney Pavement Testing Facility [26]
3.6.2 Method of Measurement
Linear Voltage Transducers are responsible for both measuring subsurface settlements and also monitoring the variation in compression for each spring in the loading mechanism.
The design at the Sydney Pavement Testing Facility is the first to be able to investigate the deformation caused by accelerated pavement testing and repeated surface tractions. This can be done by disassembling the test bed for an actual look at the deformation caused to each layer under the road surface. Measurements can also be taken, both at the surface and also for each layer.
caused underneath the surface in this same design may be greater and lead to more serious pavement damage further along in the testing process. [26]
3.6.3 Advantages
The greatest advantage the Sydney Pavement Facility has over other vehicle simulators is obviously that it is the first design to allow the engineer to investigate the deformation of each layer underneath the road surface. This feature was much needed after the plethora of accelerated pavement testing machines provided good data on surface deformation, but none really looked into deformation in the layers underneath.
Another advantage of the Sydney Pavement Facility is the small scale of the design. Reducing the size of components and forces also reduces the space required to build the facility, and also reduces the costs involved. It may also improve such factors as time involved in construction and testing, and all the while provide accurate test results in the same amount of test time.
The Sydney design also offers other good qualities such as a high rate of data reading and the ability to applied varied loads through the spring loading mechanism. The reliability of the system is also high due to the relative simplicity of the components involved. [26]
3.6.4 Disadvantages
The disadvantages of the Sydney Pavement Testing Facility can be broken into two categories. These are disadvantages when compared to other vehicle simulators and disadvantages when compared with the proposed design for this project.
When compared with the proposed design for this project, the disadvantages of the Sydney design become increasingly numerous. Most of these disadvantages stem from the use of outdated technology that will be rectified in this project.
When the design was first constructed in Sydney, there was not sufficient technology available for the engineers to consider a linear test track. The linear test track presents a need for the wheel to be stopped at the end of a run, lifted above the track, returned to the start, and then placed back onto the track. Because this technology was lacking, it left the engineers with a choice between a circular track and an oval shaped track. An oval track was chosen as it eliminated the need for lifting the wheel off the track, and also allowed a straight test section to be retained.
However, the oval test track does present several disadvantages. The track itself takes up a lot of extra space when compared with a linear test track, and also the test section is very small when compared with the overall size of the track.
Chapter 4
Conceptual Design
An important stage of any design process is the conceptual design phase. To get started on the conceptual design of the new system, several broad ideas were investigated. After collecting several decent ideas, a decision matrix was constructed to choose the best overall design. Once the final design is chosen, the selection of components can commence.
4.1
Initial Conceptual Design
The initial conceptual design process involved looking at systems that involved lifting and dropping of a mass in the vertical direction, as well as systems that moved horizontally. While by no means common, there are systems used for a variety of tasks that exhibit this behaviour.
forwards and backwards along the girders. The crane can also obviously lift and lower a mass independently of its horizontal travel.
Figure 4.1: Overhead Crane
One idea that evolved from looking at an overhead crane was the possibility of having two rails running parallel to the test track. The carriage would roll forwards and backwards along the two rails while being driven by the loaded wheel rolling along the actual test track and test bed. There are many variations of loading mechanisms that could be used in conjunction with this system, such as spring loading, hydraulic loading or simply dead weights.
Another type of system with movements similar to the proposed mechanical testing system is a skill-tester game. These games are usually located in shopping centres or arcades and involve an electric motor moving a mass along a single rail, then dropping a claw or magnet before retracting it again and returning to the original position. This system is slightly more complex than the proposed system for this project because it is required to move in two directions as well as dropping and lifting a mass, rather than moving in only one direction like the carriage for this project.
design of this system is really the redesigning of the Sydney Pavement Testing Facility rig, a lot of work would have already been completed.
So, after the initial conceptual design process, the two main ideas to emerge were:
• a design based upon the system at the Sydney Pavement Testing Facility with modifications made to correct faults, and
• a new system involving a set of parallel rails running the length of the test track with the carriage spanning the gap and being driven by the loaded wheel in the centre.
Both of these concepts were investigated thoroughly before a decision matrix was used to decide upon the best overall design.
4.2
Overhead Rail Concept
Figure 4.2: Overhead Rail Concept Design
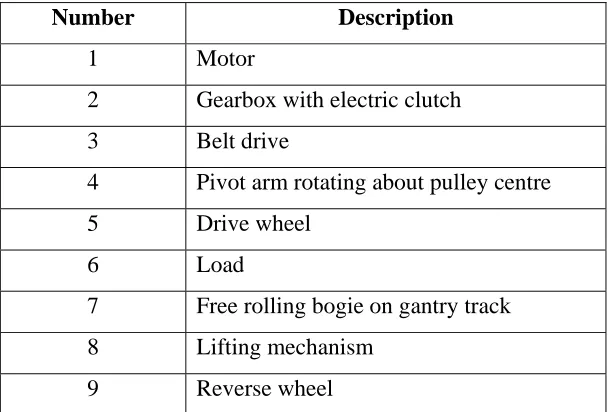
As can be seen from the picture, the most important components of the design are labeled. These labels are explained further in Table 4.1.
Number Description 1 Motor
2 Gearbox with electric clutch
3 Belt drive
4 Pivot arm rotating about pulley centre
5 Drive wheel
6 Load
7 Free rolling bogie on gantry track
8 Lifting mechanism
9 Reverse wheel
[image:45.595.146.452.488.694.2]The overhead rail concept involves a motor and gearbox fixed to a bogie. The bogie is free to move in both directions along the gantry beam shown. While in forwards motion, the bogie will be driven by the drive wheel at all times to properly simulate traffic, rather than having the loaded drive wheel simply rolling over the test section.
Figure 4.2 shows a few additions from the Sydney design. Additions such as a wheel for reverse motion and a cylinder to lift the drive wheel were necessary due to the slightly more complicated design. The entire driving wheel assembly can rotate about the pulley centre when the lifting mechanism is activated. The use of a belt drive has eliminated the possibility of using the drive wheel on the end of a retractable arm.
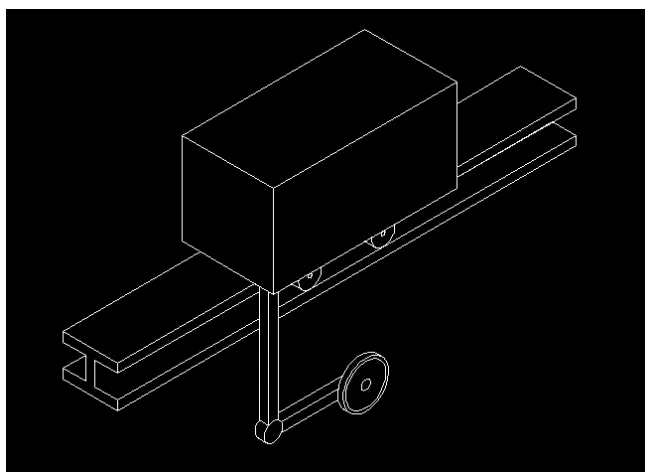
[image:46.595.135.461.383.621.2]A simplified 3D view of the overhead rail concept is shown below in figure 4.3.
4.3 Rails
Concept
As stated earlier, the rails concept involves a set of parallel rails running alongside the test track. The carriage will be required to span the gap between the rails, and will be driven by the loaded wheel running over the test track. Figure 4.4 shows a 3D view of the carriage.
Figure 4.4: Carriage for Rails Concept
It can be seen from figure 4.4 that the motor and gearbox will sit on the top of the carriage with the driving wheel directly underneath. The loaded wheel assembly will still pivot about the centre of the pulleys. However, there is no reverse wheel for the rails concept so a completely new return system will be needed if this design is chosen. The small wheels the carriage uses to run along the rails will need to be specified to allow almost frictionless motion in both directions.
4.4
Decision Matrix for Carriage Design
A decision matrix is a chart that allows analysis and a final rating to be given to a number of different alternatives. The nature of a decision matrix allows a direct comparison between alternatives with the highest scoring alternative being considered the best option for implementation.
After the two alternatives were decided upon, a set of key criteria has to be selected. The qualities deemed important in the carriage design are as follows:
Criterion Low cost
Reproducibility of results Ease of Assembly
Life Maneuverability
Weight Ease of Maintenance
Table 4.2: Criterion for Carriage Conceptual Design
Although there may be other factors influencing the design process such as personal preferences, the list of criteria above was considered to be the most useful qualities when deciding upon the final carriage design.
Criterion Weighting
Low cost 3
Reproducibility of results 3
Ease of Assembly 2
Life 3 Maneuverability 1
Weight 1
Ease of Maintenance 2
Table 4.3: Criterion and Weighting for Carriage Conceptual Design
In table 4.3, it can be seen that both low cost, reproducibility of results, and the life of the carriage are considered the most important characteristics. These are fairly self-explanatory as the importance of low cost stems from the restrictive budget, the reproducibility of results because of the high number of cycles to be conducted with the system, and the life of the carriage, again because of the high number of cycles to be undertaken.
Ease of assembly and maintenance were considered fairly important as the design should be fairly easy to assemble, and it should also be easy to conduct maintenance upon the equipment.
Maneuverability and weight of the carriage were considered less important because once the system is assembled and in place, it should not require any further adjustments. However, the maneuverability and weight of the carriage may have a direct impact on the positioning of the system, which is why they must be taken into account when deciding upon the final design.
Criterion Weight Rails Overhead Rail
Low Cost 3 3 2
Reproducibility of results 3 5 5
Ease of Assembly 2 5 2
Life 3 4 3
Manoeuvrability 1 5 1
Weight 1 3 4
Ease of Maintenance 2 4 3
Total Rating 62 45
Table 4.4: Decision Matrix for Carriage Conceptual Design
To get the total rating given for each of the two alternatives, simply multiply the score from each category by the weighting of that category and sum them.
4.5
Scoring Explanation
As shown in the decision matrix in table 4.4, the scores for each of the alternatives vary significantly throughout the criteria. The reasons for this are outlined below.
associated with hanging the entire assembly from an overhead track. For the reasons listed above, the overhead rail concept was given a slightly lower score of 2.
Both of the concepts were given a perfect score of 5 for reproducibility of results. The overhead rail concept has been shown to provide excellent results at the Sydney Pavement Testing Facility, so it can be inferred that the slightly improved concept design for this project would also produce accurate results. Although the rails concept is a completely new idea for used in accelerated pavement testing, a perfect score has been given because the simplicity of the design would allow for excellent repeatability, and therefore the reproducibility of results would also be very good.
The rails concept was also given a perfect score for ease of assembly. The concept would require only basic mechanical skills to assembly as all the joints are very simple and the wheels and motor are easily fixed to the frame. Weight distribution is not critical either as the nature of the design would allow more weight to be placed on either one side or one end without adversely affecting the life of the carriage or ability of the design to produce accurate results. However, the overhead rail design would be harder to assemble, mainly because of the nature of the design. The loaded wheel assembly will have to be placed to one side of the overhead rail, creating a larger force on one side of the bogie. Also, aligning the wheels of the bogie to run freely in both directions will require extra time and effort, whereas it is not as important for the wheels on the rails concept to run almost without friction. For these reasons, the overhead rail concept scored only a 2 for ease of assembly.
reversing the direction of travel, will increase the longevity of the motor, and also lead to lower maintenance costs. The overhead rail concept scored slightly lower than the rails concept because of the fact the motor must be reversed to drive the carriage back to the start of the track. This process will significantly shorten the life of the motor. Also, the larger moments associated with the overhead rail design will produce increased wear and tear on components such as the free wheeling bogie.
While not very important, the maneuverability of the carriage was a quality that was needed in the final design. If the entire system ever needed to be moved for any reason, such as maintenance or relocation, a carriage with high maneuverability would be advantageous. The maneuverability of the rails concept was considered extremely high, as the carriage can be lifted directly from the track and either carried or rolled to a new destination. The overhead rail concept, however, has very little mobility. In order to move this system, either the entire assembly with the overhead rail must be moved, or the carriage must be disassembled to free it from the gantry beam. For this reason, the overhead rail concept was given a poor score in this category.
Again, while not very important, the overall weight of the carriage does need to be taken into consideration. While both carriages will have basically the same components, the rails concept has the extra mass of the framework to take into account, whereas the overhead rail design has no real framework to consider. Having said this, both carriages will still have a fairly sizeable mass because of the mass of components such as the motor, as well as the amount of steel used in both carriages. The overhead rail concept scored slightly higher in this category than the rails concept because of the lack of a distinct frame.
separate from the test track; meaning undertaking maintenance on the track would be more complicated. Also, if maintenance of components such as the motor or bogie were needed, the carriage would have to be disassembled in order to allow the motor or bogie to be taken away and worked on separately. So for these reasons, the rails concept again scored slightly higher than the overhead rail concept.
4.6
Conclusion
[image:53.595.138.458.375.601.2]As shown in table 4.4, the rails concept has the highest score of the two alternatives after finishing the decision making process. Therefore, the rails concept, shown below in figure 4.5, has been chosen as the final design, and the remaining components will be designed to be compatible only with the rails concept.
Chapter 5
Component Selection
Although the carriage design has been chosen, the rest of the components must now be selected. These include the motor, the return system, the loading mechanism, the lifting mechanism, the drive system, and also specifying the wheels and rail system. The control of the system must also be investigated to ensure a computer can control the entire system.
5.1
Motors
Before a choice can be made on the type of motor for this project, research into the advantages and disadvantages of the more common motors must be undertaken to ensure the final choice is made correctly.
5.1.1 Electric Single Phase AC Motors
[image:55.595.149.453.398.631.2]Induction AC motors are the simplest and most rugged electric motor and consist of two basic electrical assemblies: the wound stator and the rotor assembly. The induction AC motor derives its name from currents flowing in the secondary member (rotor) that are induced by alternating currents flowing in the primary member (stator). The combined electromagnetic effects of the stator and rotor currents produce the force to create rotation.
Figure 5.1: AC Motor [10]
cast-aluminum conductors and short-circuiting end rings. This AC motor, which is referred to as a squirrel cage, rotates when the moving magnetic field induces a current in the shorted conductors. The speed at which the AC motor magnetic field rotates is the synchronous speed of the AC motor and is determined by the number of poles in the stator and the frequency of the power supply:
ns = 120f/p, where
ns = synchronous speed,
f = frequency, and p = the number of poles.
Synchronous speed is the absolute upper limit of AC motor speed. If the rotor turns exactly as fast as the rotating magnetic field, then the rotor conductors cut no lines of force, and torque is zero. When AC motors are running, the rotor always rotates slower than the magnetic field. The rotor speed is just slow enough to cause the proper amount of rotor current to flow, so that the resulting torque is sufficient to overcome windage and friction losses, and drive the load. The speed difference between the rotor and magnetic field, called slip, is normally referred to as a percentage of synchronous speed:
s = 100 (ns - na)/ns, where
s = slip,
ns = synchronous speed, and
na = actual speed.
Polyphase squirrel-cage AC motors are basically constant-speed machines, but some degree of flexibility in operating characteristics results from modifying the rotor slot design. These variations in AC motors produce changes in torque, current, and full-load speed. Evolution and standardization have resulted in four fundamental types of AC motors:
• Design C
• Design D
• Design F
Designs A and B: General-purpose AC motors with normal starting torques and currents, and low slip. Fractional-horsepower polyphase AC motors are generally design B. Because of the drooping characteristics of design B, a polyphase AC motor that produces the same maximum torque as a single-phase AC motor cannot attain the same speed-torque point for full-load speed as single-phase AC motors. Therefore, maximum speed-torque must be higher so that full-load speeds are comparable.
Design C: High starting torque with normal starting current and low slip. AC motors are normally used where breakaway loads are high at starting, but which normally run at rated full load and are not subject to high overload demands after running speed has been reached.
Design D: High slip, AC motor starting torque, low starting current, and low full-load speed. Because of the high slip, speed can drop when fluctuating loads are encountered. This AC motor design is subdivided into several groups that vary according to slip or the shape of the speed-torque curve.
Design F: Low starting torque, low starting current, and low slip. These AC motors are built to obtain low locked-rotor current. Both locked-rotor and breakdown torque are low. Normally these AC motors are used where starting torque is low and where high overloads are not imposed after running speed is reached. [10]
Wound-rotor AC motors are generally started with secondary resistance in the rotor circuit. The AC motor resistance is sequentially reduced to permit the motor to come up to speed. Thus, AC motors can develop substantial torque while limiting locked-rotor current. This secondary AC motor resistance can be designed for continuous service to dissipate heat produced by continuous operation at reduced speed, frequent acceleration, or acceleration with a large inertia load. External resistance gives AC motors a characteristic that results in a large drop in rpm for a fairly small change in load. Reduced AC motor speed is provided down to about 50% rated speed, but efficiency is low.
Two-winding AC motors have two separate windings that can be wound for any number of poles so that other speed ratios can be obtained. However, ratios greater than 4:1 are impractical because of AC motor size and weight. Single-phase multispeed AC motors are usually variable-torque design, but constant-torque and constant-horsepower AC motors are available.
Power output of multispeed AC motors can be proportioned to each different speed. These AC motors are designed with output horsepower capacity in accordance with one of the following load characteristics:
• Variable torque
• Constant torque
• Constant horsepower
The AC motors come in multispeed types, but there is a practical limit to the number of speeds obtained. Two, three, and four-speed motors are available, and speed selection may be accomplished by consequent-pole or two-winding methods.
Single-phase AC electric motors run in the direction in which they are started; and they are started in a predetermined direction according to the electrical connections or mechanical setting of the starting means. General-purpose AC motors may be operated in either direction, but the standard AC motor rotation is anti-clockwise when facing the end opposite the drive shaft. AC motors can be reconnected to reverse the direction of rotation.
Universal AC motors operate with nearly equivalent performance on direct current or alternating current up to 60 Hz. However, in Australia mains frequency is 50 Hz, meaning this is well within the motors capabilities. AC motors differ from DC motors due to the winding ratios and thinner iron laminations. DC motors runs on AC, but with poor efficiency. Universal AC motors can operate on DC with essentially equivalent AC motor performance, but with poorer commutation and brush life than for an equivalent DC motor.
An important characteristic of universal AC motors is that it has the highest horsepower-per-kg ratio of any AC motor because it can operate at speeds many times higher than that of any other 50-Hz electric motor.
With a universal AC motor, speed control is simple, since electric motor speed is sensitive to both voltage and flux changes. With a rheostat or adjustable autotransformer, ac motor speed can be readily varied from top speed to zero.
Synchronous AC motors are inherently constant-speed electric motors and they operate in absolute synchronism with line frequency. As with squirrel-cage induction AC motors, speed is determined by the number of pairs of poles and is always a ratio of the line frequency.
Synchronous AC motors are made in sizes ranging from sub fractional self-excited units to large-horsepower, direct-current-excited AC motors for industrial drives. In the fractional-horsepower range, synchronous ac motors are used primarily where precise constant speed is required.
In large horsepower sizes applied to industrial loads, synchronous AC motors serve two important functions. First, AC motors provide highly efficient means of converting AC energy to mechanical power. Second, AC motors can operate at leading or unity power factor, thereby providing power-factor correction.
There are two major types of synchronous AC motors: non-excited and direct current excited electric motors.
Non-excited electric motors are made in reluctance and hysteresis designs. These electric motors employ a self-starting circuit and require no external excitation supply.
DC-excited electric motors come in sizes larger than 1 hp, and require direct current supplied through slip rings for excitation. Direct current may be supplied from a separate source or from a DC generator directly connected to the AC motor shaft.
motor field is rotating at a synchronous speed, the electric motor must be accelerated before it can pull into synchronism. Accelerating from zero speed requires slip until synchronism is reached. Therefore, separate starting means must be employed.
Although the DC-excited electric motor has a squirrel cage for starting, called a damper winding, the inherent low starting torque and the need for a DC power source requires a starting system that provides full electric motor protection while starting, applies DC field excitation at the proper time, removes field excitation at maximum torque, and protects the squirrel-cage winding against thermal damage under out-of-step conditions. [10]
5.1.2 Electric Three Phase AC Motors
Three phase motors have several distinct advantages over single-phase motors. There are also differences between how three phase motors work and how single-phase motors work. These are outline in the following paragraphs.
For higher-power applications where a polyphase electrical supply is available, the three-phase AC induction motor is used. The three-phase differences between the three three-phases of the polyphase electrical supply create a rotating electromagnetic field in the motor.
Compared to squirrel cage rotors, wound rotor motors are expensive and require maintenance of the slip rings and brushes, but they were the standard form for variable speed control before the advent of compact power electronic devices. Transistorised inverters with variable frequency drive can now be used for speed control and wound rotor motors are becoming less common. Transistorized inverter drives also allow the more-efficient three-phase motors to be used when only single-phase mains current is available.
Several methods of starting a polyphase motor are used. Where the large inrush current and high starting torque can be permitted, the motor can be started across the line, by applying full line voltage to the terminals. Where it is necessary to limit the starting inrush current, reduced voltage starting using either series inductors or any number of other devices. A technique sometimes used is wye-delta starting, where the motor coils are initially connected in wye for acceleration of the load, then switched to delta when the load is up to speed. Transistorised drives can directly vary the applied voltage as required by the starting characteristics of the motor and load.
As in the single-phase motor, through electromagnetic induction, the rotating magnetic field induces a current in the conductors in the rotor, which in turn sets up a counterbalancing magnetic field that causes the rotor to turn in the direction the field is rotating. Also, the rotor must always rotate slower than the rotating magnetic field produced by the polyphase electrical supply; otherwise, no counterbalancing field will be produced in the rotor. This type of motor is excellent for use in traction cases such as locomotives, making it an excellent choice to consider for this project.
The speed of the AC motor is determined primarily by the frequency of the AC supply and the number of poles in the stator winding, according to the relation:
RPM = 2 * F * 60/p, where
p = Number of poles, usually an even number but always a multiple of the number of phases.
The torque is a function of the amount of slip, or difference in rotation, between the rotor and stator fields. Standard motors have between 2-3% slip, special motors may have up to 7% slip, and a class of motors known as torque motors are rated to operate at 100% slip (0 RPM/full stall).
The torque is determined by the amount of slip, or difference in rotation, between the rotor and stator fields.
As with single-phase motors, another type of three-phase motor is the synchronous motor. If the rotor coils of a three-phase motor are fed a separate field current to create a continuous magnetic field the result is a called a synchronous motor because the rotor will rotate in synchronism with the rotating magnetic field produced by the polyphase electrical supply.
Nowadays, synchronous motors are frequently driven by transistorized variable-frequency drives. This greatly eases the problem of starting the massive rotor of a large synchronous motor. They may also be started as induction motors using a squirrel-cage winding that shares the common rotor: once the motor reaches synchronous speed, no current is induced in the squirrel-cage winding so it has little effect on the synchronous operation of the motor. Synchronous motors are occasionally used as traction motors.
5.1.3 Electric DC Motors
[image:64.595.235.366.336.489.2]The classic DC motor has a rotating armature in the form of an electromagnet with two poles. A rotary switch called a commutator reverses the direction of the electric current twice every cycle, to flow through the armature so that the poles of the electromagnet push and pull against the permanent magnets on the outside of the motor. As the poles of the armature electromagnet pass the poles of the permanent magnets, the commutator reverses the polarity of the armature electromagnet. During that instant of switching polarity, inertia keeps the classical motor going in the proper direction. This process is shown below, in figures 5.2 through 5.4. [9]
Figure 5.2: DC Motor Stage 1 [9]
Figure 5.3: DC Motor Stage 2 [9]
The armature continues to rotate, as shown above in figure 5.3.
Figure 5.4: DC Motor Stage 3 [9]
When the armature becomes horizontally aligned, the commutator reverses the direction of current through the coil, reversing the magnetic field. The process then repeats itself.
[image:65.595.233.366.378.527.2]voltage or current flow by using taps in the motor windings or by having a variable voltage supply typically controls the speed.
As this type of motor can develop quite high torque at low speed it is often used in traction applications such as locomotives.
However, there are a number of limitations in the classic design, many due to the need for brushes to rub against the commutator. The rubbing creates friction, and the higher the speed; the harder the brushes have to press to maintain good contact. Not only does this friction make the motor noisy, but it also creates an upper limit on the speed and causes the brushes eventually to wear out and to require replacement. The imperfect electric contact also causes electrical noise in the attached circuit. These problems vanish when you turn the motor inside out, putting the permanent magnets on the inside and the coils on the outside thus designing out the need for brushes in a brushless design. However such designs need electronic circuits to control the switching of the electromagnets.
Industrial applications use DC motors because the speed-torque relationship can be varied to almost any useful form -- for both DC motor and regeneration applications in either direction of rotation. Continuous operation of DC motors is commonly available over a speed range of 8:1. Infinite range for short durations or reduced load is also common.
DC motors are often applied where they momentarily deliver three or more times the rated torque. In emergency situations, DC motors can supply over five times rated torque without stalling.
Wound-field DC motors are usually classified by shunt-wound, series-wound, and compound-wound. In addition to these, permanent magnet and brush-less DC motors are also available, normally as fractional-horsepower DC motors. DC motors may be further classified for intermittent or continuous duty. Continuous-duty DC motors can run without an off period.
When choosing a DC motor for a given application, several factors need to be considered, such as speed range, speed variation with torque, and reversing. Peak torque and heating need to also be taken into account.
If a large speed range is required, the base speed of the motor must be proportionately lower and the motor size must be larger. If the speed range is much over 3:1, armature voltage control should be considered for at least part of the range. Very wide dynamic speed range can be obtained with armature voltage control. However, below about 60% of base speed, the motor should be de-rated or used for only short periods.
Applications requiring constant speed at all torque demands should use a shunt-wound DC motor. If speed-change with load must be minimized, a DC motor regulator, such as one employing feedback from a tachometer, must be used.
When the DC motor speed must decrease as the load increases, compound or series-wound DC motors may be used.
Reversing the motor affects power supply and control, and may affect the brush adjustment if the DC motor cannot be stopped for switching before reverse operation. In this case, compound and stabilizing DC motor windings should not be used, and a suitable armature-voltage control system should supply power to the DC motor.
The load at which damaging commutation begins limits the peak torque that a DC motor delivers. DC motor brush and commutator damage depends on sparking severity and duration. Therefore, the peak torque depends on the duration and frequency of occurrence of the overload. The maximum current that the power supply can deliver often limits DC motor peak torque.
DC motor temperature is a function of ventilation and electrical/mechanical losses in the machine. Some DC motors feature losses, such as core, shunt-field, and brush-friction losses, which are independent of load, but vary with speed and excitation.
The best method to predict a given DC motor's operating temperature is to use thermal capability curves available from the DC motor manufacturer. vIf curves are not available, DC motor temperature can be estimated by the power-loss method. This method requires a total losses versus load curve or an efficiency curve.
For each portion of the duty cycle, power loss is obtained and multiplied by the duration of that portion of the cycle. The summation of these products divided by the total cycle time gives the DC motor's average power loss. The ratio of this value to the power loss at the motor rating is multiplied by the DC motor's rated temperature rise to give the approximate temperature rise of the DC motor when operated on that duty cycle. [9]
5.1.4 Hydraulic Motors
The most important operating specification to consider when researching hydraulic motors is the motor type. Choices for motor type include axial piston, radial piston, internal gear, external gear, and vane. An axial piston motor uses an axially-mounted piston to generate mechanical energy. High pressure flow into the motor forces the piston to move in the chamber, generating output torque. A radial piston hydraulic motor uses pistons mounted radially about a central axis to generate energy. An alternate-form radial piston motor uses multiple interconnected pistons, usually in a star pattern, to generate energy. Oil supply enters the piston chambers, moving each individual piston and generating torque. Multiple pistons increase the displacement per revolution through the motor, increasing the output torque. An internal gear motor uses internal gears to produce mechanical energy. Pressurised fluid turns the internal gears, producing output torque. An external gear motor uses externally-mounted gears to produce mechanical energy. Pressurized fluid forces the external gears to turn, producing output torque. A vane m
![Figure 3.6: Accelerated Loading Facility [12]](https://thumb-us.123doks.com/thumbv2/123dok_us/322044.64160/31.595.160.437.101.317/figure-accelerated-loading-facility.webp)
![Figure 3.8: Sydney Pavement Testing Facility [26]](https://thumb-us.123doks.com/thumbv2/123dok_us/322044.64160/37.595.202.393.164.422/figure-sydney-pavement-testing-facility.webp)
![Figure 3.9: Plan of Test Track at Sydney Pavement Testing Facility [26]](https://thumb-us.123doks.com/thumbv2/123dok_us/322044.64160/38.595.86.510.109.345/figure-plan-test-track-sydney-pavement-testing-facility.webp)
![Table 3.1: Specifications of Sydney Pavement Testing Facility [26]](https://thumb-us.123doks.com/thumbv2/123dok_us/322044.64160/39.595.83.516.122.379/table-specifications-sydney-pavement-testing-facility.webp)

![Figure 5.1: AC Motor [10]](https://thumb-us.123doks.com/thumbv2/123dok_us/322044.64160/55.595.149.453.398.631/figure-ac-motor.webp)
![Figure 5.2: DC Motor Stage 1 [9]](https://thumb-us.123doks.com/thumbv2/123dok_us/322044.64160/64.595.235.366.336.489/figure-dc-motor-stage.webp)
