E-Business Processes and Factors of Influence: One Model does not Fit All
Barbara Roberts and Mark Toleman University of Southern Queensland
Abstract
This empirical study of organisational e-business adoption, utilising both qualitative and quantitative data collection methods, examines four major factors influencing adoption in multiple e-business process domains. Support is found for the proposition that factors influencing e-business adoption behaviour have different levels of impact across different e-business process domains. Different combinations of factors influence different e-business processes and for the most part this occurs independently of organisation size/resource capacity. Governments and powerful supply chain organisations have strong influence over some e-business strategy. In particular, e-government influence is strong with regard to use of e-mail and external web sites due to government’s regulatory compliance power, but weak with regard to operation of an organisation’s web sites. The implication of this research is that frameworks and models for e-business adoption will have greater relevance if they are developed for specific process domains rather than attempting to fit all areas of e-business.
Keywords
e-business, adoption factors, e-government, supply chain
Citation: Roberts, Barbara and Toleman, Mark (2006) E-business processes and factors of
influence: one model does not fit all. In: 10th Pacific Asia Conference on Information
Systems, 6-8 Jul 2006, Kuala Lumpur, Malaysia
1. Introduction
This paper reports on quantitative research into factors which influence e-business adoption, and investigates the proposition that factors influencing e-business adoption have different levels of impact across different e-business process domains. Findings from this research have significance in the development of explanatory e-business models and frameworks. The empirical study was conducted within the Australian wine industry in 2003. The level of influence of four factors over different e-business types is compared. The four factors were identified and selected after a review of literature investigating organisational e-business adoption and diffusion and after a qualitative pilot study involving interviews with winery staff which, among other things, helped to identify two major factors from external environment sources. For the purpose of this research e-business is divided into separate process domains based upon a combination of technology type, ownership and users: use of e-mail; use of web sites operated by groups external to the wineries (external web sites); and three possible types of web sites operated by each winery – a) their own web site designed for the general public (public web sites); b) their own web site designed for access by relevant business groups (extranets); and c) their own web site designed for access by the winery’s own staff (intranets) (Roberts et al. 2003).
Analysis of the pilot study interview data confirmed that the first two factors do influence some e-business adoption, but by no means all adoption. For example, the adoption of EANnet by wineries to provide online product data to large retail customers (e.g. Coles and Woolworths) occurs as a result of pressure and direction from these powerful customers, and occurs despite wineries having no perception of direct relative advantage or obvious spare resource capacity (Roberts et al. 2004). Powerful supply chain organisations and government effectively dictate some e-business strategy and adoption patterns, for example online customs adoption is now virtually mandatory as a result of the roll out of Australian Custom's new Integrated Cargo System (ICS) which requires all imports and exports to be administered online to enhance security, efficiency and accuracy (Australian Customs Service 2004).
2. Background Literature Review
Diffusion of Innovation theory (Rogers 1995) identified a large range of factors influencing adoption of innovations from two major sources: 1) characteristics of the innovation itself; and 2) characteristics of the adopting organisation. The major limitation of DOI theory with respect to e-business adoption is the lack of acknowledgement of the external environment as a rich source of factors influencing adoption and diffusion patterns. Culture, government and legal regulations, and government policy initiatives all appear to have strong explanatory power in improving understanding of e-business adoption and diffusion behaviours (Chen 2003; Gibbs et al. 2003; Palacios 2003; Wong 2003).
The effectiveness of most types of business increases as user numbers increase, and thus e-business has network externality characteristics. For example, the lack of readiness of customers and suppliers has been identified as a key barrier to e-business adoption (Barua et al. 2000). As benefits rise with increasing numbers, so too do normative pressures for other supply chain organisations to adopt (Wu et al. 2003).
Influence from the competitive marketplace environment is also acknowledged as important. In particular, customer power is singled out as having particular influence (Christensen et al. 1996; Wu et al. 2003). A useful conceptual framework of the antecedents and performance outcomes of e-business adoption has been developed by Wu et al. (2003). This research continues the investigation into e-business antecedent factors and examines four factors to compare their levels of influence in different e-business process domains.
3. Method
This paper reports on part of a larger study which employed a multi-method, two-stage approach. First, qualitative interviews were used in a pilot study designed to explore issues and collect empirical data from industry sources. Second, a census survey (excluding micro size wineries) gathered quantitative and descriptive data. Pilot study interviews were conducted in July 2003 in nine Australian wineries. See Roberts et al. (2003) for background details of the study, the winery participants, and findings.
option was also provided. An extra section on e-business in general was included which also included eight factor statements. Analysis of the survey's factor statements enabled the proposition that factors influencing e-business adoption behaviour have different levels of impact across different e-business process domains to be tested.
4. Survey Responses by Winery Size
Of the 1065 questionnaires sent out, 198 responses were received - a response rate of 18.6%. Given that winery size (measured by production) helps determine a winery’s market focus and position (ACIL 2002), organisation size is likely to act as a moderating factor on a range of e-business behaviours. The size categories build on a system employed by other wine industry analysts using quantity of tonnage processed rather then employer numbers (ACIL 2002; Sellitto et al. 2003). An extra category for ‘very large’ wineries was introduced in order to differentiate this group from the other large wineries due to the sheer dominance of the top 20 or so wineries of the Australian wine industry. Therefore for analysis purposes the wineries are grouped into four size categories as shown:
• Small – processing between 20 and 249 tonnes annually;
• Medium - processing between 250 and 999 tonnes annually;
• Large – processing between 1 000 and 9 999 tonnes annually; and
• Very Large – processing more than 10 000 tonnes annually.
Note that the tonnage range of the very large size category is extremely large and open-ended, and covers a much wider range of size by tonnage processed than the other size categories. In 2002 for example, BRL Hardy processed over 270 000 tonnes while Orlando Wyndham processed over 160 000 tonnes (Winetitles 2003, p. 21). Table 1 summarises the population and response numbers using these size categories. The increase in proportion of responses from wineries as the winery size increases is self-evident from Table 1, and the difference is significant (χ2(3) = 32.28, p<.001).
Table 1 Winery size categories, population and response numbers Winery Size
Category Annual Tonnage Range Population Number in Population % Responses Number of Responses as % of Population in Range
Responses as % of Total Responses
Small 20-249 801 75.2% 120 15.0% 60.6%
Medium 250-999 150 14.1% 35 23.3% 17.7%
Large 1000-9999 88 8.3% 31 35.2% 15.7%
Very Large 10000 and over 26 2.4% 12 46.2% 6.1%
Total 1065 100% 198 100%
Survey Response % 18.6%
5. Data Analysis
The responses to the factor statements for e-mail, use of external web sites, use of the winery’s public web site and e-business in general provide four different observations of the same factor for each respondent. A score for each factor/domain combination is computed by adding the responses from the two statements for that factor and dividing the result by two. Where expected frequencies in contingency tables are less than five per cell the significance levels of Fisher’s Exact Test were compared with Pearson Chi-square values: no cases of non-equivalence were found, and thus Pearson Chi-square test results are reported in all cases. For reliability testing purposes the statements were grouped by factor rather than by process domain. Reliability test results carried out on the eight statements relating to the same factor are shown in Table 2. While the low alpha score for the supply chain factor is acknowledged as a limitation to this research, the other reliability scores are acceptable.
Table 2 Cronbach’s Alpha scores for the factor items
Factor Cronbach’s Alpha
N of items = 8 Relative advantage .805, N =150 Resources .657, N = 137 Supply chain .481, N = 126 Government .654, N = 102
[image:4.595.84.514.455.766.2]The Friedman test results are computed for each winery size separately, and also for all respondents regardless of winery size in order to investigate whether winery size alters the trend in differences between different e-business categories. The Freidman test results shown in Table 3 provide strong evidence that the four factors impact in significantly different ways between different e-business categories and this difference occurs regardless of winery size – that is, winery size has no or very little effect.
Table 3 Friedman test results for responses to factor statements Friedman test
results Df = 3
E-mail External Sites Public Web
sites
E-business
in general N Chi-Square Significance
Factor Relative Advantage
All wineries 3.28 2.81 1.65 2.26 150 158.7 0.000
Small 3.35 2.68 1.74 2.24 85 83.2 0.000
Medium 3.24 2.95 1.66 2.15 31 39.5 0.000
Large 3.25 2.98 1.42 2.35 24 32.4 0.000
Very large 2.85 3.10 1.50 2.55 10 11.0 0.012
Factor Resource capacity
All wineries 3.42 2.53 1.80 2.25 137 133.4 0.000
Small 3.36 2.54 1.83 2.27 78 68.0 0.000
Medium 3.31 2.60 1.72 2.36 29 25.8 0.000
Large 3.57 2.52 1.74 2.17 21 27.4 0.000
Very large 3.89 2.28 1.89 1.94 9 15.8 0.001
Factor Supply Chain
All wineries 2.76 2.93 2.23 2.08 126 44.5 0.000
Small 2.88 2.81 2.09 2.21 69 23.5 0.000
Medium 2.73 3.17 2.17 1.92 26 18.5 0.000
Large 2.52 3.00 2.52 1.96 23 8.9 0.031
Very large 2.50 2.94 2.69 1.88 8 3.4 0.336
Factor Government
Small 2.66 2.68 1.52 3.15 60 60.3 0.000
Medium 2.68 3.03 1.32 3.00 19 26.2 0.000
Large 2.63 2.94 1.19 3.25 16 27.3 0.000
Very large 2.57 3.00 1.21 3.21 7 11.7 0.009
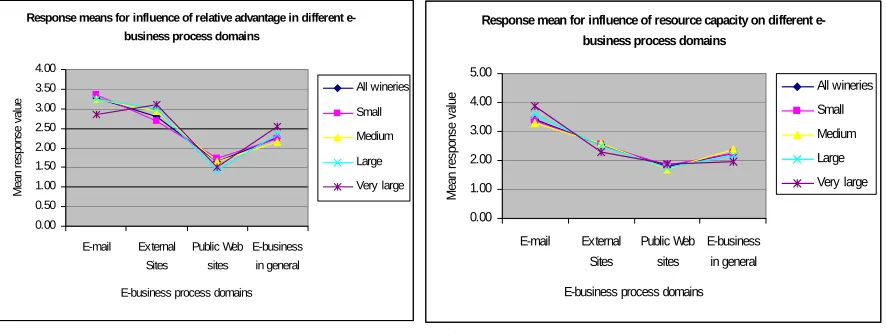
Charts based upon the Friedman test results effectively illustrate the different levels of impact that each factor plays in the different e-business process domains, and show the high level of consistency of response across all winery sizes. Figure 1 shows the marked difference in levels of influence that the perception of relative advantage plays in different areas of e-business: for example, relative advantage is associated with e-mail to a much higher degree than with the winery's public web sites. These differences are consistent across all winery sizes and highly significant. Figure 2 illustrates that the perception of resource capacity also operates differently in different e-business process domains, and has more influence on e-mail use than the use of web sites.
Response means for influence of relative advantage in different e-business process domains
0.00 0.50 1.00 1.50 2.00 2.50 3.00 3.50 4.00
E-mail Ex ternal Sites
Public Web sites
E-business in general
E-business process domains
M ean re sp on se v al ue
All w ineries Small Medium Large Very large
Response mean for influence of resource capacity on different e-business process domains
0.00 1.00 2.00 3.00 4.00 5.00
E-mail Ex ternal Sites
Public Web sites
E-business in general
E-business process domains
M ea n r esp on se va lu
e All w ineries
[image:5.595.78.521.256.423.2]Small Medium Large Very large
Figure 1 Relative advantage factor Figure 2 Resource capacity factor
Figure 3 shows the results for the supply chain factor while Figure 4 shows the responses for the government factor. The very large wineries provide the only exception to the otherwise consistent significant difference between responses to the supply chain statements for the different e-business process domains, but even so the trend here is similar.
Response means for influence of supply chain in different e-business process domains
0.00 0.50 1.00 1.50 2.00 2.50 3.00 3.50
E-mail Ex ternal Sites
Public Web sites
E-business in general
E-business process domains
M ean res pon se v al ue
All w ineries Small Medium Large Very large
Response mean for influence of gov ernment activ ity in different e-business process domains
0.0 0.5 1.0 1.5 2.0 2.5 3.0 3.5
E-mail Ex ternal Sites
Public Web sites
E-business in general
E-business process domains
M ean re spon se v al
ue All wineries
Small
M edium
Large
[image:5.595.77.520.523.690.2]Very large
Figure 3 Supply chain factor Figure 4 Government factor
public web site (Roberts et al. 2003). Variable customer power is likely to account for the greater spread in responses for the public web site domain, but the response mean differences for the supply chain factor are still significant and illustrate that the factor has different levels of impact between the different domains and that this occurs regardless of winery size. However the lack of adequate reliability for the supply chain statements limits interpretation of this result. Figure 4 shows high level of agreement between the responses for the government statements regardless of size, and it is interesting to note that government influence is perceived to have a stronger influence over e-business in general than the other factors investigated (Roberts et al. 2004).
Conclusions
The Friedman test results provide strong evidence that factors influencing e-business adoption behaviour do not impact in the same way for different e-business process domains, and thus the proposition that factors do not impact in the same way in different e-business process domains is supported. Relative advantage, for example, has significantly less influence in the use of winery B2C web sites than it does for e-mail or the use of external web sites. Resource capacity affects usage of e-mail more than web sites, while the activities of supply chain organisations have less impact on winery B2C web sites than on e-mail and external web sites. E-government influence has little impact for winery B2C web sites, but is much higher with regard to winery use of e-mail and external web sites. Overall, online government activity is considered a stronger influence on e-business activity in general than either relative advantage, internal resource capacity or the actions of other organisations in the winery supply chain. This work confirms the important role of government in enabling conditions supportive of e-business uptake and e-government services driving adoption (Gibbs et al. 2003; Palacios 2003; Wong 2003).
Theoretical implications of variable impact levels for factors in different e-business process domains exist in relation to complexity of models and frameworks. The conceptual models covering business adoption tend to collect all influential factors that are indicated in any e-business situation (Chau et al. 2001; Chong et al. 2000; Daniel et al. 2002; Gibbs et al. 2003; van Akkeren et al. 1999; Wu et al. 2003), and the models risk decreasing relevance as a result. One possible solution to this problem is to customise theoretical frameworks for specific e-business process domains, rather than to continue developing ever more complex models which include factors for all possible situations and outcomes. However further research in specific domains is needed before customised frameworks can be reliably developed, and similar research in different countries and in different industry settings is needed before these findings can be generalised. In conclusion, the forces that drive e-business adoption are complex and variable. Customising theoretical models of antecedent adoption factors for particular e-business process domains is likely to increase their relevance and improve the level of ‘fit’ between theory and practice, as one model does not fit all types of e-business.
References
ACIL "Pathways to profitability for small and medium wineries," ACIL Consulting, p. 176. Australian Customs Service "Information for integrated caro system (ics) users," 2004. Barua, A., Konana, P., Whinston, A., and Yin, F. "Making E-Business Pay: Eight Key
Drivers for Operational Success," IEEE IT Professional (2:6), November-December 2000 2000, pp 2-10.
Studies," Twelfth Australasian Conference on Information Systems, Coffs Harbour, NSW, Australia, 2001.
Chen, T.-J. "The Diffusion and Impacts of the Internet and E-Commerce in Taiwan.," I-Ways
(26:4), 2003/// 2003, pp 185-193.
Chong, S., and Bauer, C. "A model of factor influences on electronic commerce adoption and diffusion in small- & medium-sized enterprises," Fourth Pacific Asia Conference on Information Systems (PACIS), Curtin University of Technology, Australia, Hong Kong 1-3 June, 2000.
Christensen, C., and Bower, J. "Customer power, strategic investment, and the failure of the leading firms," Strategic Management Journal (17) 1996, pp 197-218.
Daniel, E.M., and Grimshaw, D.J. "An exploratory comparison of electronic commerce adoption in large and small enterprises.," Journal of Information Technology (17:3), 2002/09// 2002, pp 133-147.
Gibbs, J., Kraemer, K.L., and Dedrick, J. "Environment and Policy Factors Shaping Global E-Commerce Diffusion: A Cross-Country Comparison.," Information Society (19:1), 2003/01// 2003, pp 5-18.
Mathieson, K., Peacock, E., and Chin, W.W. "Extending the technology acceptance model: the influence of perceived user resources," The Database for Advances in Information
Systems (32:3), Summer 2001 2001, pp 86-112.
Palacios, J.J. "Globalization and E-Commerce: Diffusion and Impacts in Mexico.," I-Ways
(26:4), 2003/// 2003, pp 195-205.
Roberts, B., and Fitzgerald, E. "An investigation of e-business use by Australian wineries," 14th Australasian Conference on Information Systems (ACIS), Perth, Western Australia, 26-28 Nov, 2003.
Roberts, B., and Toleman, M. "E-business adoption in Australian wineries: DOI
perspectives," 5th International WE-B Conference, Perth, Western Australia, 2004. Rogers, E.M. Diffusion of Innovations, (4th ed.) The Free Press, New York, 1995.
Sellitto, C., and Martin, B. "Internet Web-Site Adoption: A study of 107 Victorian SME Wineries," The Ninth Australian World Wide Web Conference, AusWeb03, Sanctuary Cove, Gold Coast, Queensland, 2003.
van Akkeren, J., and Cavaye, A.L.M. "Factors affecting entry-level internet technology adoption by small business in Australia: An empirical study," 10th Australasian Conference on Information Systems, Victoria University of Wellington, New Zealand, 1999, pp. 1071-1083.
Venkatesh, V., Morris, M.G., Davis, G.B., and Davis, F.D. "User acceptance of information technology: toward a unified view," MIS Quarterly (27:3), September 2003 2003, pp 425-478.
Winetitles The Australian and New Zealand Wine Industry Directory, (21st ed.) Winetitles, Adelaide, 2003.
Wong, P.-K. "Global and National Factors Affecting E-Commerce Diffusion in Singapore.,"
Information Society (19:1), 2003/01// 2003, pp 19-32.
Wu, F., Mahajan, V., and Balasubramanian, S. "An analysis of e-business adoption and its impact on business performance," Journal of the Academy of Marketing Science