This is a repository copy of Subdomain-based test data generation. White Rose Research Online URL for this paper:
http://eprints.whiterose.ac.uk/113344/ Version: Accepted Version
Article:
Patrick, Matthew, Alexander, Rob orcid.org/0000-0003-3818-0310, Oriol, Manuel et al. (1 more author) (2015) Subdomain-based test data generation. Journal of Systems and Software. pp. 328-342. ISSN 0164-1212
https://doi.org/10.1016/j.jss.2014.11.033
[email protected] https://eprints.whiterose.ac.uk/ Reuse
This article is distributed under the terms of the Creative Commons Attribution-NonCommercial-NoDerivs (CC BY-NC-ND) licence. This licence only allows you to download this work and share it with others as long as you credit the authors, but you can’t change the article in any way or use it commercially. More
information and the full terms of the licence here: https://creativecommons.org/licenses/
Takedown
If you consider content in White Rose Research Online to be in breach of UK law, please notify us by
Subdomain-Based Test Data Generation
Matthew Patricka,b,∗, Rob Alexandera, Manuel Oriola,c, John A. Clarka
a
Department of Computer Science, University of York, Heslington, York, United Kingdom b
Department of Plant Sciences, Downing Street, University of Cambridge, United Kingdom c
ABB Corporate Research, Baden-D¨attwil, Switzerland
Abstract
Considerable effort is required to test software thoroughly. Even with automated test data generation tools, it is still necessary to evaluate the output of each test case and identify unexpected results. Manual effort can be reduced by restricting the range of inputs testers need to consider to regions that are more likely to reveal faults, thus reducing the number of test cases overall, and therefore reducing the effort needed to create oracles. This article describes and evaluates search-based techniques, using evolution strategies and subset selection, for identifying regions of the input domain (known as subdo-mains) such that test cases sampled at random from within these regions can be used efficiently to find faults. The fault finding capability of each subdomain is evaluated using mutation analysis, a technique that is based on faults programmers are likely to make. The resulting subdomains kill more mutants than random testing (up to six times as many in one case) with the same number or fewer test cases. Optimised subdomains can be used as a starting point for program analysis and regression testing. They can easily be comprehended by a human test engineer, so may be used to provide information about the software under test and design further highly efficient test suites.
Keywords: testing, search, input distribution, subdomains, evolution strategy
1. Introduction
Despite a recognition of the importance of soft-ware testing by the industry and a significant in-vestment in its practice, many faults are often still not found. For example, the Java Compatibility Kit [1] is an extensive test suite developed for the Java Development Kit (JDK), yet there are still thousands of additional JDK bug reports in Sun’s bug database [2]. The main problem is that soft-ware is complex; programs have too many paths to show that they are all correct [3]. As a re-sult, software testing is expensive and it is often performed incompletely.
∗Corresponding author
Email addresses: [email protected](Matthew Patrick), [email protected](Rob Alexander), [email protected] (Manuel Oriol), [email protected] (John A. Clark)
Automatic test data generation is seen as a so-lution to some of the challenges involved with soft-ware testing [4]. It saves time and money by pro-ducing a greater number of test cases more quickly and with less manual involvement. In theory, this should allow a higher standard of testing to be achieved with fewer resources, as it frees testers to focus on the overall strategy rather than indi-vidual test case design and implementation.
Existing techniques scatter test cases across the input domain. Many of the values are obscure and it can be difficult to understand their significance [8]. The human tester is not told which values are of particular importance, nor whether other values might also detect the same faults. Testers therefore become separated from the process of generating test cases; their role is reduced to run-ning the testing tool and evaluating its results. Myers [9] claims that testing is performed poorly because testers find it boring and repetitive.
Subdomains are more informative than test cases because their optimal size and placement suggest input regions that are particularly impor-tant for testing. Compared to a set of inputs cho-sen randomly from the whole input domain, less manual effort is required to evaluate test cases whose values are closer together and easier to un-derstand [8]. Subdomains reduce the cost of con-structing an oracle because they limit the range of inputs testers must consider and decrease the number of test cases they have to evaluate.
The choice of subdomains has a significant ef-fect on the efficiency of random testing. For ex-ample, theTriTyp(also known as Triangle) pro-gram has three integer inputs (a, b and c) and its branches contain conditions such as a=b=c. Michael et al. [10] selected over 8000 test cases from the entire input domain, but exercised less than half of the program’s branches. Duran [11] selected 25 test cases from the subdomains ([1,5], [1,5], [1,5]) and exercised all the branches. Ran-dom testing can therefore be made more efficient by carefully tuning the subdomains.
Since subdomains require a large number of test cases for their optimisation, other techniques may be computationally more efficient. Yet, we expect subdomain testing will be less labour-intensive be-cause there are ultimately fewer test cases to eval-uate. Compared with other testing techniques, subdomains have three main advantages:
1. They improve the effectiveness of ran-dom testing and provide a means to find faults more efficiently
Subdomains target regions of input mutation analysis predicts likely to reveal faults.
2. They can be used as a starting point for regression testing more readily than a set of individual test cases
Subdomains are more robust than test cases to small changes in a program’s values. 3. They provide information about the
ex-ecution behaviour of a program that is useful for constructing further tests Subdomains suggest important parameters and key thresholdss for branch conditions. This article introduces a new technique for op-timising subdomains that can be sampled from at random to produce highly efficient test suites. The new technique combines elements of both white-box and black-box testing. Subdomains are optimised through direct manipulation of the source code (mutation analysis), rather than iden-tified by inspection of its specification. Yet opti-misation is performed by evolving bounds for each subdomain in the input domain and once the sub-domains have been evolved, test cases can be sam-pled without further analysis of the source code.
It can be difficult to determine which subdo-mains to use and why. For example, Andrews et al. [12] report that the subdomain [0,31] gave the best results in testing a dictionary, but do not explain how they discovered this ‘magic number’. Rather than using trial and error to find the best subdomains to use with random testing, it is more productive to take a systematic approach. We op-timise subdomains using an evolution strategy so that they are efficient at killing mutants.
2. Subdomain Optimisation
We optimise subdomains initially using muta-tion score (propormuta-tion of non-equivalent mutants killed) as our fitness function. A mutant is killed by a test case if it produces a different output to the original program for the same input values. The higher the mutation score the subdomains achieve, the fitter they are considered to be.
A candidate solution consists of one subdomain for each input parameter to the software under test. At every generation, test input values are sampled numerically for each parameter. A can-didate solution consists therefore of a set of subdo-mains with intervals in the following three forms: Numerical subdomains
are represented with lower and upper bounds (rounded to whole numbers to keep the sub-domains simple). Values are sampled inclu-sively within these bounds as real numbers, such that subdomain [3,6] includes values 3 and 6, but also every value in-between. Boolean chance values
are described with an integer value between 0 and 100. Rather than defining a boundary within which test inputs are sampled, this value represents the percentage chance that a particular test input value is ‘true’.
Character array subdomains
are fixed in length (by default to five char-acters). Special characters (wildcard, clo-sure etc.) are identified from the program code and given their own chance of inclusion, whilst characters from the basic Latin alpha-bet are selected uniformly at random.
Evolution strategies differ from some genetic algorithms in that they optimise numerical val-ues rather than bit strings and focus on mutation over recombination [14]. Evolution strategies op-timise numerical values through Gaussian adap-tation. Gaussian adaptation is a suitable mech-anism for generating new candidate solutions be-cause it favours values close to the old ones, but still allows exploration of values further away.
Our initial experiments were conducted using a traditional (1 + 1) form of evolution strategy. The evolution strategy maintains one candidate solu-tion (set of subdomains) at a time. Each candi-date solution is represented using a numerical set of values (x1. . . xn), as determined by the coding of subdomain types described previously.
At every generation, a single new candidate so-lution (x′
1. . . x′n) is perturbed from the current one through Gaussian adaptation. It is generated such that x′
1 = x1 +ǫ1. . . x′n = xn +ǫn, where
ǫ1. . . ǫn ∈ N(0, σ2). The new candidate replaces the current solution if it evaluates as being su-perior (i.e. test cases sampled from it achieve a higher mutation score), otherwise it is discarded. Effort may be wasted in pursuit of locally op-timal regions unless the optimisation process bal-ances the development of strong candidates with the exploration of new regions [20]. Rechenberg’s one-fifth rule states the convergence rate is opti-mal when one out of five new candidates perform better than the previous solution [21]. Following advice from Schwefel [22], the standard deviation of the Gaussian distribution (σ) is adjusted by applying Equation 1 once every ten generations.
σ′ =
σ∗0.85, if r <2
σ/0.85, if r >2
σ, if r= 2
(1)
(where r is the number of adaptations in every 10 generations that increase the fitness evaluation)
Algorithm 1 describes the process used to opti-mise lower (l) and upper (u) boundary values for input parameters (α . . .Ω). The evolution strat-egy is set up so that it has the ability to ex-plore a wide range of potential candidate solutions quickly, then narrow its focus to exploit those sub-domain values found to be the most efficient.
Algorithm 1 Synthesising an optimal solution [αl, αu], [βl, βu], . . . , [Ωl,Ωu]
Input: s=number of test cases with which to evaluate each candidate solution (we later experiment with 10, 100 and 1000); n=number of input parameters to the program under test.
1: Select initial random values (x1. . . xn) for αl,αu,βl, βu, . . . , Ωl and Ωu.
2: Generate s test cases from [x1, x2], [x3, x4], . . . , [xn−1, xn].
3: Count the number of mutants m killed by the test cases
4: repeat
5: r= 0
6: for i= 1 →10 do
7: Sample new values from a normal distribution:
x′
1 =x1+ǫ1, x′2 =x2+ǫ2, x′3 =x3+ǫ3,x′4 =x4+ǫ4, . . . , x′
n−1 =xn−1+ǫn−1,xn′ =xn+ǫn where ǫ1. . . ǫn∈ N(0, σ2)
8: Generate s test cases randomly within the bounds [x′
1, x
′
2], [x
′
3, x
′
4], . . . , [x
′
n−1, x
′
n].
9: Count the number of mutants m′ killed by the test cases
10: if m′ > m then
11: x1 =x′1,x2 =x′3, x4 =x′4,xn−1 =x′n−1, xn =x′n,r =r+ 1.
12: end if 13: end for
14: if r <2 then σ2 =σ2∗0.85 (ensures optimal rate for convergence [22])
15: else if r >2 then σ2 =σ2/0.85
16: until generations>300 and mutation score no longer increases
3. Optimising Multiple Sets of Subdomains
As well as single sets of subdomains, we also optimise multiple sets, so as to kill specific mu-tants more precisely. Consider a program with two mutants (M1 andM2) and one input param-eter (x); M1 can only be killed if x= 1 and M2 can only be killed if x= 1000. The smallest sub-domain for x capable of killing bothM1 andM2 is the interval [1,1000]. Widening the subdomain to this interval reduces the efficiency of the sam-pled test suite so the probability of killing each mutant is 1/1000. It is therefore more efficient to evolve separate subdomains, one for each mutant. Multiple sets of subdomains are optimised one at a time, in a similar way to single sets, except with a more sophisticated fitness function (see Equation 2) and a new form of evolution strat-egy (Covariance Matrix Adaptation). Each can-didate set is evaluated by sampling test cases from within its bounds. The candidate is saved if it kills mutants a certain number of times out of a fixed number of trials and the search continues to optimise further sets for the remaining mutants.
Covariance Matrix Adaptation Evolution Strat-egy (CMA-ES) was chosen because it is a population-based technique, so does not get stuck in a local optimum as often as 1+1-ES. CMA-ES adapts the search distribution at the same time as the candidate solutions. It can solve difficult optimisation problems (including non-linear fit-ness landscapes) without the need for manual pa-rameter tuning. In a recent black-box compar-ison study with 25 benchmark functions, CMA-ES outperformed other optimisation algorithms in terms of the number of function evaluations before the global optimum value is reached [23].
CMA-ES represents the search neighbourhood using a multivariate Gaussian distribution [24]. Compared with the univariate approach, multiple dimensions of variance allow the search to adapt more precisely to the underlying fitness landscape. A covariance matrix is used to represent the shape of the distribution and a scaling factor to repre-sent its size. CMA-ES adjusts the size and shape of the distribution according to pairwise depen-dencies identified in the covariance matrix [24].
Figure 1 explains how CMA-ES is used to op-timise multiple sets of subdomains. In our ex-periments, candidate solutions are evaluated by sampling 100 test suites of 5 test cases, randomly from within the bounds of each subdomain. A mutant is considered covered if it is killed at least once in 95 out of 100 test suites sampled from the subdomains. Although we found these settings to be effective, alternatives may also be used.
The new fitness function (see Equation 2) favours subdomains that target a distinct group of mutants. It maximises variance in the number of times each mutant is killed and minimises vari-ance in the number of times the same mutant is killed. Each numerator represents the differences within the same mutant and each denominator represents the differences between mutants. By minimising this function, subdomains are selected that consistently kill the same group of mutants.
X
s∈S X
m∈M
(Ks,m−K¯m)2 ( ¯Km−K¯)2 ¯
Km = ( X
s∈S
Ks,m)/100
¯
K = (X
m∈M
Ks,m)/#M
(2)
(S is the set of test suites, M the set of mutants, Ks,m is the number of times skillsm, ¯Km is the
average number of times mis killed and ¯K is the average number of times any mutant is killed)
Once subdomains are found to cover a par-ticular group of mutants, the search continues to identify and target a new group from among the remaining mutants. If no new mutants have been covered after 50 generations, the program is transformed through a process known as ‘program stretching’ to make individual mutants easier to kill one at a time. The search is terminated if, after the stretching process is completed for each mutant, no new mutants have been covered.
Program stretching was originally suggested as a technique for improving branch coverage [25]. It transforms a program to make difficult search goals easier to achieve, then gradually transforms it back to the original code, retraining the test data at each stage. Program stretching adapts the fitness landscape dynamically so as to guide the search towards achieving a specific goal.
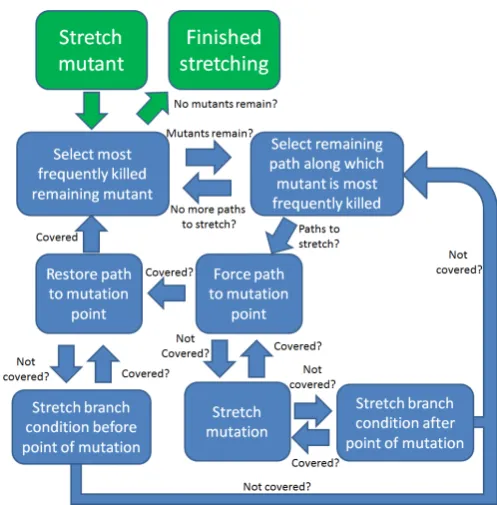
[image:6.595.121.468.535.742.2]Program stretching is used in this article as a means to kill more mutants. For this to happen, the mutant must be reached, infect a difference in the data state and propagate this difference to the output. The program transformations used in this research were designed to address these goals. Figure 2 summarises the process used to find ef-fective subdomains for difficult to kill mutants by stretching and un-stretching the program code.
The following code transformations are used: Path stretching forces branch conditions
lead-ing up to a mutant to be true or false, de-pending on whether the branch was taken the last time the mutant was killed.
Mutation stretching alters the mutation by an offset of 100, for example x >= y → x > y
becomesx > y+ 100 with the aim of increas-ing its impact on the program.
Branch condition stretching adds an offset of 100 to a difficult branch condition in order to make it easier to meet, for example x == y
becomes (x <=y+ 100)&&(y <=x+ 100). Program stretching is performed so that the mutant that has been killed the most number of times is targeted first, then the next most fre-quently killed and so on. Once stretching is com-pleted, the main fitness function is reapplied to take advantage of the stretching process on other mutants that are killed by similar input values.
4. Subdomain Set Selection
[image:7.595.309.558.76.329.2]We seek to identify small, but efficient, sets of subdomains from those that have been op-timised. Sequential Floating Forward Selection (SFFS) was chosen because it is computationally feasible, but still allows backtracking whenever it improves the selection. Unlike branch-and-bound techniques, SFFS is not guaranteed to find the global optimum, but it is typically much faster at making a selection [26]. SFFS is not restricted to a fixed number of backtracking steps, as with other sub-optimal (plus-l-takeaway-r) techniques. It can make as many sweeps through the feature set as are needed to identify an efficient selection.
Figure 2: Flowchart of the Program Stretching Process
Equation 3 describes the fitness criterion used to evaluate subdomain set selections. 100 test cases are sampled randomly from within the bounds of each set to establish its ability to kill each mutant. The current selection is evaluated according to the sum (for each mutant) of the maximum number of times a mutant is killed by any of the included sets. In this way, the criterion function seeks small selections of subdomain sets that kill all the mutants as frequently as possible.
X
m∈M
maxs∈S(killed(s, m)) (3)
(M is the set of mutants,S is the set of subdomains, killed(s, m) is the number of times out of 100
that subdomain skills mutantm)
adding another set of subdomains will not in-crease the mutation score any further. The tech-nique is therefore suitable for removing redundant sets of subdomains and finding the smallest selec-tion from which test cases can be sampled without having a detrimental effect on fault finding ability.
5. Research Questions
The overall hypothesis of this paper is that soft-ware testing can be made more efficient by sam-pling test cases from efficient sets of subdomains. We consider whether such test cases are more ef-fective at killing mutants and if the subdomains from which they are sampled reveal information that will help the tester to construct an oracle. Finally, we consider whether multiple sets of sub-domains and subset selection can be used to im-prove software testing efficiency even further. RQ1: Are test suites sampled from an
op-timised set of subdomains more effi-cient at killing mutants than unopti-mised random testing?
A test suite is considered more efficient if it kills more mutants with the same number of test cases. Mutation analysis is used to deter-mine whether optimised sets of subdomains are more efficient than unoptimised random testing for test suites of 10, 100 and 1000 test cases. If 10 test cases can be sampled such that they kill as many mutants as 100 or 1000 test cases, this can be considered as a ten or hundred-fold improvement in efficiency. RQ2: To what extent does the relative
ef-fectiveness of each set of subdomains (at killing mutants) reveal information about the program under test?
Upper/lower boundaries and chance values clearly have an affect on the effectiveness of sampled test suites. The challenge is to un-derstand how the relative characteristics of subdomains impact their effectiveness, so as to determine the causal relationships between specific subdomain values and the effective-ness of the resulting test suites. Once this is achieved, it should be possible to produce new more efficient subdomains in the future.
RQ3: Are test suites sampled from multiple sets of subdomains more efficient at killing mutants than single sets?
Multiple sets of subdomains can be targeted to kill specific groups of mutants more pre-cisely than a single set of subdomains. Mul-tiple sets are therefore expected to be sig-nificantly more efficient at killing mutants than single sets. To find out whether this is the case, mutation analysis is applied to test suites sampled from the subdomains pro-duced by each technique. Multiple sets of subdomains can be considered to be more ef-ficient if they kill more mutants than single sets with the same number of test cases. RQ4: Does it take longer to optimise
6. Test Subject Programs
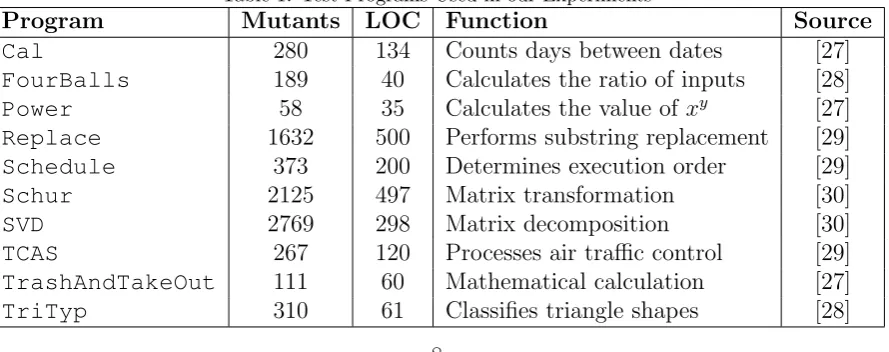
We conduct experiments on 10 Java programs (see Table 1) often used in testing research, since they are well known and understood. We chose programs that represent a variety of computation, so that our results are valid for a wide range of applications [31]. The programs are small (35 to 500 lines of code), which means we can repeat our experiments a large number of times.
Power,TrashAndTakeOutandCalperform numerical calculations. They were published in a textbook on software testing [27]. FourBalls
calculates the values of four integers (the weights of balls) relative to each other. It was first used to evaluate evolutionary test data generation [32].
TCAS is an air traffic collision avoidance sys-tem. It was first used by Siemens to investigate data flow and control flow coverage criteria [33].
TriTyp (also known as the triangle program) classifies triangles as equilateral, isosceles or sca-lene. It has been used extensively in research since being introduced by Ramamoorthy et al. [34].
ScheduleandReplaceprocess character
ar-rays. Schedule uses an array of instructions with specific command codes, whereas Replace applies a search and replacement string to the source file.
SVD (Singular Value Decomposition) and Schur(Schur Transformation) have a more com-plex (matrix) input data structure. We evolve numerical subdomains for each diagonal of a four-by-four matrix for SVDand each value of a three-by-three matrix for Schur.
7. Experimental Design
Subdomains are optimised for their ability to kill mutants generated by MuJava [35]. MuJava is based upon research into selective mutation [36][15], which suggests modifying arithmetic, re-lational, logical and conditional expressions to be the most effective way to mutate program code.
We optimise single sets of subdomains using a 1+1-ES (see Section 2). Subdomain values are ini-tialised randomly between 0 and 100. The adap-tation variance is set to 50, then updated using Rechenberg’s one-fifth rule every 10 generations. Although we found this to be effective, other op-tions may also work well. A more sophisticated algorithm could be used, but for illustrative rea-sons we made our technique as simple as possible. Multiple sets of subdomains are optimised us-ing a CMA-ES with 95% mutant coverage as its selection criterion (see Section 3). The means and covariances of the multivariate Gaussian distribu-tion are updated automatically by the algorithm. We only sample 5 test cases from each set of sub-domains, so as to keep their total number small.
[image:9.595.79.524.597.773.2]Optimised subdomains are compared to the ex-pected mutation scores for unoptimised random testing (see Equation 4). A test suite of 100 000 random test cases was used because it is impor-tant that N is much larger than s for accurate results. Numerical input values were generated between 0 and 100, Boolean values were given a 50% chance of being true and character arrays were generated from the basic Latin alphabet.
Table 1: Test Programs Used in our Experiments
Program Mutants LOC Function Source
Cal 280 134 Counts days between dates [27]
FourBalls 189 40 Calculates the ratio of inputs [28]
Power 58 35 Calculates the value ofxy [27]
Replace 1632 500 Performs substring replacement [29]
Schedule 373 200 Determines execution order [29]
Schur 2125 497 Matrix transformation [30]
SVD 2769 298 Matrix decomposition [30]
TCAS 267 120 Processes air traffic control [29]
TrashAndTakeOut 111 60 Mathematical calculation [27]
e(s) = X
m∈mutants
1−(1−K/N)s (4)
(s: expected number of test cases, N: actual number of test cases, K: number of test cases that killedm)
8. Results and Analyses
8.1. Results for RQ1: Are test suites sampled from an optimised set of subdomains more efficient than unoptimised random testing?
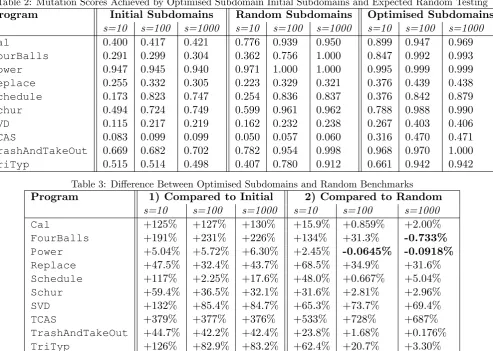
RQ1 is answered using a (1+1) evolution strat-egy to optimise subdomains for test suites of 10, 100 and 1000 test cases. The aim is to deter-mine whether optimised subdomains are more ef-ficient than unoptimised random sampling. Table 2 lists the mutation scores achieved for each size of test suite and Table 3 compares these results for optimised subdomains, the initial random sub-domains and unoptimised random testing.
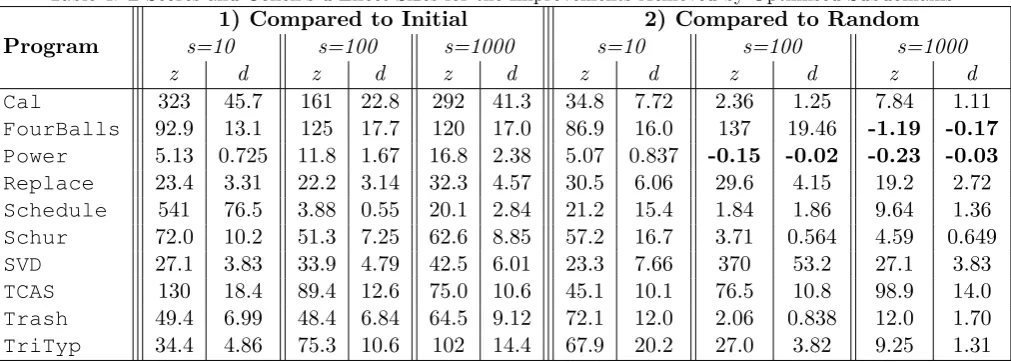
Optimised subdomains achieve a higher muta-tion score than the initial subdomains for every program and all sizes of test suite. They also ex-ceed the mutation scores for unoptimised random testing with three exceptions (shown inbold). In these cases, all the mutants are expected to be killed by random testing, but the evolution strat-egy sometimes becomes stuck in a local optimum. Table 4 shows (at a 95% confidence interval) these differences are not significant. By contrast all the other differences are statistically significant.
[image:10.595.55.549.383.734.2]There is a relationship between the size of a pro-gram and the mutation score achieved. Most of the mutants can be killed from the smallest pro-gram (Power) with 10 test cases and little opti-misation (see Figure 3c), whereas the largest pro-gram (Replace) has a low mutation score after 600 generations and 1000 test cases (Figure 3h).
Table 2: Mutation Scores Achieved by Optimised Subdomain Initial Subdomains and Expected Random Testing
Program Initial Subdomains Random Subdomains Optimised Subdomains
s=10 s=100 s=1000 s=10 s=100 s=1000 s=10 s=100 s=1000
Cal 0.400 0.417 0.421 0.776 0.939 0.950 0.899 0.947 0.969
FourBalls 0.291 0.299 0.304 0.362 0.756 1.000 0.847 0.992 0.993
Power 0.947 0.945 0.940 0.971 1.000 1.000 0.995 0.999 0.999
Replace 0.255 0.332 0.305 0.223 0.329 0.321 0.376 0.439 0.438
Schedule 0.173 0.823 0.747 0.254 0.836 0.837 0.376 0.842 0.879
Schur 0.494 0.724 0.749 0.599 0.961 0.962 0.788 0.988 0.990
SVD 0.115 0.217 0.219 0.162 0.232 0.238 0.267 0.403 0.406
TCAS 0.083 0.099 0.099 0.050 0.057 0.060 0.316 0.470 0.471
TrashAndTakeOut 0.669 0.682 0.702 0.782 0.954 0.998 0.968 0.970 1.000
TriTyp 0.515 0.514 0.498 0.407 0.780 0.912 0.661 0.942 0.942
Table 3: Difference Between Optimised Subdomains and Random Benchmarks
Program 1) Compared to Initial 2) Compared to Random
s=10 s=100 s=1000 s=10 s=100 s=1000
Cal +125% +127% +130% +15.9% +0.859% +2.00%
FourBalls +191% +231% +226% +134% +31.3% -0.733%
Power +5.04% +5.72% +6.30% +2.45% -0.0645% -0.0918%
Replace +47.5% +32.4% +43.7% +68.5% +34.9% +31.6%
Schedule +117% +2.25% +17.6% +48.0% +0.667% +5.04%
Schur +59.4% +36.5% +32.1% +31.6% +2.81% +2.96%
SVD +132% +85.4% +84.7% +65.3% +73.7% +69.4%
TCAS +379% +377% +376% +533% +728% +687%
TrashAndTakeOut +44.7% +42.2% +42.4% +23.8% +1.68% +0.176%
TriTyp +126% +82.9% +83.2% +62.4% +20.7% +3.30%
[image:10.595.36.559.386.571.2]A program’s size does not always determine how many mutants can be killed. Cal has twice the number of mutants as Fourballs, but 89% were killed by 10 test cases, compared to 83% with
FourBalls (see Figures 3a and 3b). TriTyp
has one more line than TrashAndTakeOut, but only 64% of its mutants are killed (see Figures 3h and 3g). Using 10 test cases, the mutation score is correlated to the number of mutants and lines of code with -0.690 and -0.667 Spearman’s rank coefficients. The z-scores for these statistics are -23.3 and -22.1, which means we can reject the null hypothesis that there is no correlation.
None of the initial trials withTCASproduced a
mutation score above 0.05, the prediction for ran-dom testing. Inspection of the code reveals TCAS
uses large constants in its branch conditions. For example, unlessCur V ertical Sepis greater than 600, most lines will not be executed. As this value lies far outside the range of the initial sub-domains, the probability of this condition being met is low. Widening the initial subdomains im-proved the mutation score, but only slightly.
A significantly greater improvement in muta-tion score was made by scaling the program con-stants so that they lie within the initial subdo-mains. The program was transformed by divid-ing eight of its constants by 10, thus brdivid-ingdivid-ing them within the 0-100 range used for the ini-tial bounds of each subdomain. When the
sub-domains were optimised for the transformed pro-gram, they achieved an average mutation score of 0.316 with 10 test cases, 0.470 with 100 test cases and 0.471 with 1000 test cases (see Figure 3d, NB: the s=100 line is covered by s=1000 line).
Subdomains discovered on the transformed pro-gram can be scaled up for use on the original program by multiplying the relevant values by 10. The subdomains identified by scaling and de-scalingTCAS achieved an average mutation score
of 0.401 for 1000 test cases, with one of the trials achieving 0.625. This is comparable to the 0.643 mutation score achieved by Papadakis et al. [29] with dynamic symbolic execution test generation. The approach could easily be applied to other programs by manually identifying the relationship between the input parameters and the internal program constants to determine which parame-ters should be scaled. This could however be time consuming for a human tester who needs to test more complex programs. Our approach for opti-mising multiple sets of subdomains addresses this problem with automated program stretching.
[image:11.595.47.553.556.737.2]Summary for RQ1: Optimised subdomains achieve a higher mutation score than random test-ing whenever the mutation score is not already 100%. The size of a program is correlated to how difficult its mutants are to kill. The mutation score forTCAS is increased from 0.05 to 0.401 by scaling (and descaling) its internal constants.
Table 4: Z-Scores and Cohen’s d Effect Sizes for the Improvements Achieved by Optimised Subdomains
1) Compared to Initial 2) Compared to Random
Program s=10 s=100 s=1000 s=10 s=100 s=1000
z d z d z d z d z d z d
Cal 323 45.7 161 22.8 292 41.3 34.8 7.72 2.36 1.25 7.84 1.11
FourBalls 92.9 13.1 125 17.7 120 17.0 86.9 16.0 137 19.46 -1.19 -0.17
Power 5.13 0.725 11.8 1.67 16.8 2.38 5.07 0.837 -0.15 -0.02 -0.23 -0.03
Replace 23.4 3.31 22.2 3.14 32.3 4.57 30.5 6.06 29.6 4.15 19.2 2.72
Schedule 541 76.5 3.88 0.55 20.1 2.84 21.2 15.4 1.84 1.86 9.64 1.36
Schur 72.0 10.2 51.3 7.25 62.6 8.85 57.2 16.7 3.71 0.564 4.59 0.649
SVD 27.1 3.83 33.9 4.79 42.5 6.01 23.3 7.66 370 53.2 27.1 3.83
TCAS 130 18.4 89.4 12.6 75.0 10.6 45.1 10.1 76.5 10.8 98.9 14.0
Trash 49.4 6.99 48.4 6.84 64.5 9.12 72.1 12.0 2.06 0.838 12.0 1.70
TriTyp 34.4 4.86 75.3 10.6 102 14.4 67.9 20.2 27.0 3.82 9.25 1.31
(a) Cal (b) FourBalls
(c) Power (d) Replace
(e) Schedule (f) TCAS
[image:12.595.39.541.66.749.2](g) TrashAndTakeOut (h) TriTyp
8.2. Results for RQ2: To what extent does the rel-ative effectiveness of each set of subdomains (at killing mutants) reveal information about the program under test?
RQ2 is answered by recording information on the mutation scores achieved by test suites sam-pled from various sets of subdomains. This infor-mation is used by the evolution strategy to dis-cover more efficient subdomains, but it can also be used to reveal useful information about the characteristics of the program under test.
Power inputs two integers (x and y), then re-turns the value of xy by applying y−1 multipli-cations of x. If the value ofyis less than or equal to zero, Power does not enter its multiplication loop, instead returning the value ofx. As the ma-jority of mutable statements occur in or around this loop, most of the mutants will not be exer-cised unless positive values for y are generated.
[image:13.595.313.554.137.282.2]Setting the lower boundary of y to a positive value prevents negative numbers being generated and produces a mutation score around 95% (see Figure 4). Yet, to exercise all the mutants, it is necessary to include at least one negative and one zero value. 100% mutation score is only achieved if the lower boundary of y is negative.
Figure 4: Lower Boundaries for ‘y’
TCAS has a large number of input parameters, each of which have a different effect on the pro-gram. For example, to achieve a high mutation score, the upper boundary of ‘Cur Vertical Sep’ must be greater than 60. This corresponds to a (global constant) threshold condition of 600 in the untransformed program code. It is also important
to have a high chance for ‘High Confidence’ to be true, as much of the code is not executed if it is false (see Figure 5).
Figure 5: Chance values for ‘High Confidence’
It is tempting to think TriTyp requires small
[image:13.595.314.554.447.592.2]subdomains close to zero to increase the likelihood of isoceles, equilateral and invalid triangles. In reality, there is little pressure towards the use of smaller subdomains (see Figure 6). It is only nec-essary for the upper boundary to be large enough to support each type of triangle. This contradicts the findings of Michael et al. [10] and Duran [11].
Figure 6: Upper Boundaries for ‘side1’
Subdomain optimisation can be used to pre-dict branch structure. The results ofFourBalls
[image:13.595.47.284.477.621.2]Figure 7: Size of Subdomains for ‘cual’
Subdomain optimisation is capable of revealing information about the programs under test, but it has at least one significant limitation. If values in the input domain necessary for killing mutants are spaced far apart, the highest mutation score will be achieved when the subdomain includes all these values. Yet, widening the subdomain has a negative effect because the likelihood of sampling these values is reduced. Subdomain optimisation is torn between widening the subdomains to make it possible to kill more mutants, or focussing on an efficient area of the input domain. This issue is discussed further (with regards to optimising multiple sets of subdomains) in the next section.
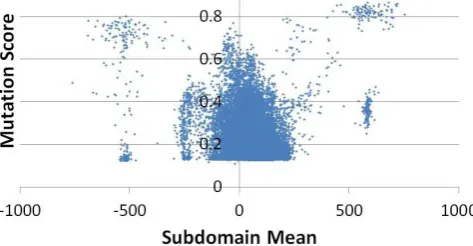
[image:14.595.45.285.84.227.2]An illustration of this limitation can be found in the results for Schedule. There are useful ar-eas within the input domain for ‘prio 1’ at around 500 or -500 (see Figure 8). Yet, due to the like-lihood of sampling these values from such a large subdomain, many of the evaluations produce low mutation scores. More mutants can be killed with a smaller test suite by evolving multiple sets of subdomains, one for each group of mutants.
Figure 8: Centre Points for ‘prio 1’
Figure 9 provides 3D representations of the per-centage of trials that achieve a particular muta-tion score as the evolumuta-tion strategy progresses. For each generation on the x-axis, the y-axis plots the mutation scores (binned into 0.1 intervals) achieved by each trial of the evolution strategy and the z-axis plots the number of trials (out of 100) that achieve this mutation score. These graphs provide insight into the process involved in optimising subdomains for each program.
It is immediately apparent from the graphs that there is a distinction between programs for which all the mutants are killed straight away (e.g.
Power) and programs for which many of the
mu-tants are difficult to kill (e.g. TCAS). Since high mutation scores are achieved quickly for Power
and many of the TCAS mutants are not killed, there are large flat areas in their graphs where there is little or no selection pressure. By con-trast, programs reveal the most useful information for testing if their mutants are difficult but still possible to kill, as their subdomains are highly specialised by the end of the optimisation process. For some programs (e.g. TriTyp) optimisation progresses smoothly from start to finish, whereas for others (e.g. FourBalls) there are peaks or ‘ripples’ in mutation score where optimisation has become stuck in a local optimum. This distinc-tion can also be seen in the scatter plots to a lesser extent. Ripples correspond to branch conditions that are difficult to meet. One way to address this problem is to restart a trial once it has become stuck. Another (less disruptive) way is to mod-ify the fitness landscape so the trial is no longer stuck. Multiple set optimisation transforms the branch conditions to make them easier to meet.
[image:14.595.45.282.615.738.2](a) Cal (b)FourBalls
(c) Power (d)Replace
(e) Schedule (f) TCAS
[image:15.595.39.564.78.538.2](g) TrashAndTakeOut (h) TriTyp
Figure 9: Subdomain Optimisation Process for Single Sets
8.3. Results for RQ3: Are test suites sampled from multiple sets of subdomains more effi-cient at killing mutants than single sets?
RQ3 is answered by comparing the effectiveness of multiple optimised sets of subdomains (with program stretching) against single optimised sets of subdomains (without program stretching). The results are presented graphically in Figure 10 and numerically in Table 5. Subdomains use the ini-tial interval [0,100] (50% chance of being true for Booleans). In the interest of fairness, both tech-niques were evaluated with the same number of
multiple sets achieved a higher mutation score than single sets. For a 95% confidence interval, all of these differences are considered significant. In the case ofSchur, single sets and random testing
already achieved a high mutation score, so there is little improvement that could be made.
Multiple sets of subdomains were particularly effective at meeting difficult branch conditions. Take for example the TCAS program, which for single sets required manual parameter scaling. The multiple set optimisation technique renders this unnecessary by automatically stretching the program code to make mutants easier to kill.
Multiple sets of subdomains achieved a 71% in-crease in mutation score on the TCAS program compared to single sets. Multiple set optimisation is particularly effective for difficult branch condi-tions, because it can assign a set of subdomains for the purposes of meeting each condition.
Summary for RQ3: Test suites sampled from multiple sets of subdomains achieved 33% higher mutation scores than single sets on average. Mul-tiple set optimisation stretches programs auto-matically, without the need for manual parameter scaling. For theTCASprogram, this increased the mutation score by an average of 71%.
8.4. Results for RQ4: Does it take longer to op-timise multiple sets than single sets?
RQ4 is answered by comparing the mutation scores achieved by single and multiple set subdo-mains throughout their optimisation process. Fig-ure 10 plots the mutation scores as an averaged
continuous curve (across 100 trials) against the time it took to evolve them. Least squares log-arithmic curve fitting is applied to compare the averaged results at each minute of computation time (between 0 and 2000 minutes). We correct the curve with a cut-off at the average point after which no further mutants were covered.
For half of the programs, it took longer to evolve multiple sets than single sets, whereas for the other half it took less time to evolve multiple sets. The difference in time is typically large, for example it took more than seven times longer to evolve single sets forTCASthan multiple sets. All of the differences can be considered significant at the 95% confidence interval. Yet, on average it took only 11.6% longer to evolve multiple sets of subdomains than single sets (see Table 5).
The variability in time taken to identify sub-domains (and reach a point at which there is no more improvement in mutation score) is a result of differences in the rate at which mutants are killed and the time required to execute the program. Typically, most mutants are killed quickly, but it takes a long time to kill the remaining mutants. A long value for time may indicate the program takes a long time to run, the subdomains are diffi-cult to evolve (and as a result a low mutation score is achieved) or a large number of subdomains are evolved (and a high mutation score is achieved).
[image:16.595.36.564.598.721.2]Multiple sets of subdomains quickly achieve a higher mutation score than single sets on half of the programs (TriTyp, TCAS and SVD). Yet, it still takes longer for SVD to reach its maximum
Table 5: Optimisation Time and Mutation Score for Single and Multiple Sets of Optimised Subdomains
Program Mutation Score Time
∗ (mins)
Tests†
Single‡ Multi‡ Z-score Cohen d Single‡ Multi‡ Z-score Cohen d
Replace 0.520 0.566 13.6 1.92 746 1410 260 36.8 455
Schedule 0.850 0.930 19.6 2.77 1053 1310 66.9 9.46 40
Schur 0.986 0.920 -11.2 -1.58 958 885 -17.1 -2.42 45
SVD 0.397 0.632 45.5 6.42 524 546 5.86 0.828 125
TCAS 0.457 0.780 57.6 8.14 364 50.6 -305 -32.1 205
TriTyp 0.951 0.998 8.22 1.16 78 8 -96.5 -13.6 135
∗ Time taken to reach point at which optimisation stops i.e. no new sets of subdomains are identified.
† In the multiple set approach, 5 test cases are sampled from each set of subdomains.
mutation score with multiple sets compared to single sets (the final value is much higher).
With Schedule and Replace, multiple sets of subdomains perform similarly to single sets at first, but then eventually overtake it. The muta-tion score for Schedule is lower with multiple sets for the first 13 hours and the first 9 hours for
Replace. Multiple sets never achieve as high an
average mutation score for Schur, but it takes on average 73 minutes less time.
Summary for RQ4: Overall, multiple sets of subdomains do not take much longer to evolve than single sets. On some programs, multiple sets take less time and for others they take more time. For the programs on which multiple sets of sub-domains takes longer, the higher mutation scores outweigh the added computational expense.
8.5. Results for RQ5: Is it possible to reduce the number of sets of subdomains without signif-icantly impacting their effectiveness?
We also evaluated the effect selecting smaller sets of subdomains (from the optimised sets) has on the mutation score for each program. The the-ory is that, since multiple sets of subdomains may kill the same mutants, removing some of the sets can improve the fault finding efficiency of the re-sulting test suites without affecting their effective-ness. Figure 11 and Table 6 present the results of selecting every possible number of sets of subdo-mains, from a single set all the way up to include every set identified by the optimisation process.
Reducing the number of sets of subdomains im-proves fault finding efficiency as long as it only has a small effect on the mutation score. The Spearman’s correlation coefficient between selec-tion size and mutaselec-tion score is significant for all programs at the 95% confidence interval (see Ta-ble 6). Yet, it is possiTa-ble to remove some sets of subdomains with a minimal reduction in mutation score. Removing a quarter of the optimised sets of subdomains only reduced the mutation score by 0.0252 on average. Selecting a quarter of the sets of subdomains of TCASonly reduces the mu-tation score by 3.6% of that achieved using all the sets.
For both SVD and Schedule, removing sets
of subdomains almost immediately decreases the mutation score. These programs only had 8 and 24 sets optimised for them (see Table 5). This limits the opportunity for redundant sets of sub-domains and makes it more likely for reducing the number of subdomain sets to have an effect on the mutation score.
Even though there were on average only 9 sets of subdomains (i.e. 45 test cases) evolved for
Schur, at least half of these sets can be removed without significantly affecting the mutation score. All the mutants generated for Schurare easy to
kill (even by random testing). As a result, the subdomains produced are typically not mutant-specific and can be removed with little impact on mutation score.
It is also of interest that the mutation scores for Schedule decrease and then increase again
as sets of subdomains are removed. This is con-fusing, since removing a set of subdomains cannot increase the criterion evaluation. The reason for this is that the results are averaged over 100 trials and in each trial a different number of subdomains was initially evolved. Similarly, other graphs are not completely smooth because each optimisation run identified a different number of subdomains.
Along with the average mutation score, Fig-ure 11 includes minimum and maximum tion scores (dotted lines). The minimum muta-tion score is low forSchurwhen selecting the first
few sets of subdomains, but this changes quickly after the fifth set is added. It is caused by an op-timisation run in which no one set of subdomains has a high mutation score by itself. In general, the minimum, maximum and average values are consistently close to each other, suggesting the re-sults of RQ6 can be relied upon.
(a) Replace (b) Schedule
(c) Schur (d)SVD
[image:18.595.40.560.141.668.2](e) TCAS (f) TriTyp
Table 6: Mutation Scores for Different Selection Sizes (Averaged over 100 Trials)
Program 25% 50% 75% 100% Spearman’s ρ Z-score
Replace 0.523 0.542 0.547 0.566 0.979 9.37
Schedule 0.686 0.862 0.828 0.930 0.876 8.38
Schur 0.883 0.920 0.921 0.920 0.774 7.40
SVD 0.460 0.531 0.579 0.603 0.977 9.35
TCAS 0.752 0.778 0.779 0.780 0.811 7.76
TriTyp 0.946 0.988 0.994 0.998 0.871 8.33
(a) Replace (b) Schedule
(c) Schur (d)SVD
(e) TCAS (f) TriTyp
Figure 11: Percentage of Mutants Covered by Evolved Subdomains during Subset Selection (Averaged over 100 Trials)
9. Threats to Validity
Although optimised subdomains are efficient at killing mutants, subdomain optimisation is com-putationally expensive. Further experiments are required to determine whether the total number of evaluations is less than with random testing. The goal of this research is not just to kill mutants, but to identify subdomains that can be understood by the tester. Yet, work is still needed to make our techniques more efficient for use in industry.
The experiments in this paper were performed on 10 relatively small programs, ranging from 40 up to 500 lines of code. Further research is re-quired to determine whether the techniques we describe are effective for larger programs. It might not be as clear why subdomains evolved for more complex programs are effective at killing mutants, so it may be difficult to achieve results similar to those presented in Section 8.2. It is necessary to consider how subdomains can be optimised for non-procedural (object-oriented) programs.
If test cases are only sampled from within the optimised subdomains, it is possible to miss mu-tants that for which subdomains have not been evolved because they are difficult to kill. We have addressed this by evolving multiple sets of sub-domains for different groups of mutants. Yet, it may be helpful to include some test cases sampled from outside the subdomains. One solution is to optimise input distributions that cover the entire input domain rather than subdomains which just cover certain key areas. Yet it is likely this would require more computational resources and there is a question as to whether these distributions would be as straightforward for testers to understand.
Program stretching makes difficult to kill mu-tants easier to kill by widening branch conditions for paths along which that mutant was previously killed. The problem with this technique is that it requires the mutant to have been killed at least once before it can be used. Difficult to kill mu-tants are (by their nature) less likely to be killed during optimisation. It may be helpful to stretch paths along which a mutant has been reached (or partially reached) and use static analysis to pre-dict paths for which a mutant is likely to be killed.
10. Related Work
There are three main types of technique that improve fault finding and reduce human effort: Improved random testing reduces the
num-ber of test cases needed to find faults by sam-pling them from a non-standard distribution. Structural test data generation uses the un-derlying program structure as an aid to effi-ciently target test cases at specific goals. Test case selection removes some of the test
cases once they have been produced, accord-ing to some evaluation of their usefulness. The efficiency of random testing can be im-proved by distributing test cases evenly, so that they cover the input domain more quickly. For example, Adaptive Random Testing (ART) has been shown to halve the number of test cases needed to find the first failure for some programs [37]. As ART does not take the specific behaviour of a program into account, there is a limit to the improvements it can make [38]. The added ex-pense can sometimes outweigh the benefits [39].
Hamlet [40] recommends partitioning the input domain into contiguous regions for which the pro-gram behaves the same. If the partitions are ho-mogeneous, we only need to sample one test case from each one. This is typically approximated us-ing structural or functional coverage criteria and sampling a few values from each partition. Ham-let [40] claims emphasis should be placed on fail-ures that are likely to occur more often. This can be achieved by sampling more test cases from cer-tain partitions according to a usage profile.
Structural test data generation techniques typ-ically involve dynamic symbolic execution and/or automated search. Dynamic symbolic execution solves branch conditions leading to a goal as a se-ries of constraints [29][43]. Search based software testing optimises branch conditions as a series of fitness criteria [44]. In this paper, we have chosen to take a search-based approach because this al-lows us to target mutants without having to spec-ify in advance which particular path to follow.
A wide variety of search-based optimisation techniques have been used to target structural components for test data generation. These in-clude (amongst others): genetic algorithms [42], genetic programming [45], simulated annealing [46], tabu search [47], scatter search [48], bac-teriological algorithms [49] and artificial immune systems [50]. We use evolution strategies (1+1-ES and CMA-(1+1-ES) because they are conceptually straightforward and have been shown to be highly effective at fine tuning numerical values.
One way to target structural goals is with the approximation level criterion [51], which indicates the distance from the current path to a path that contains the goal. The first statement in the pro-gram has zero approximation level. Every time a critical branch is encountered that if taken, would prevent the goal from being reached, the approx-imation level is incremented. This means state-ments with the highest approximation level are closest to the goal. In addition to targeting the ex-ecution of goals, mutation analysis requires each mutation to have an effect on the output.
In some cases it is possible to represent infec-tivity as an additional branch condition [29]. Yet, to propagate the effect of the mutant to the out-put, heuristics are applied. Some researchers at-tempt to predict which paths are more likely to reveal a difference [29][43]. Another option is to search for input values that maximise mutation impact [44]. Our approach does not consider this issue directly (additional criteria could be added later). Our aim is to find subdomains that consis-tently achieve a high mutation score. Therefore, we search for efficient subdomain values by caus-ing the execution to follow a path along which a mutant has already been killed at least once.
Selection techniques are used to improve test ef-ficiency by removing all but the most useful test cases [52]. Test cases can be selected that cover infrequently met test criteria [53], meet the most number of unmet criteria [54] or consistently con-tribute to the overall evaluation [55]. Test selec-tion criteria are typically deterministic, since test cases produce the same result each time they are executed. In contrast, our approach to subdomain set selection uses non-deterministic criteria. This is because test cases are sampled probabilistically from within the bounds of each subdomain.
Test selection methods are often based on the greedy algorithm [52]. They add test cases one at a time, selecting at each step the test case that most improves the criteria evaluation. The prob-lem is that criteria met by earlier test cases are also often met by a combination of test cases se-lected later in the process, thus making some of the earlier test cases redundant. Our selection technique applies backtracking as often as it helps the evaluation. We also select test cases on the basis of multiple evaluations to avoid over-fitting. In contrast with the related work by other researchers, we optimise continuous subdomains rather than individual test cases, as evaluated by mutation rather than structural coverage. Our subdomains can be sampled again and again to produce small but efficient test suites that achieve a high mutation score.
11. Conclusions
Our single set optimisation technique increased the mutation score of each test suite compared to the expected result for random testing by an av-erage of 80.1% for test suites of 1000 test cases. Even greater improvements were made when us-ing 10 or 100 test cases. The average increase in mutation score for test suites of 10 test cases was 98.5%. This shows that subdomain selection is able to make testing more effective, whilst still reducing the number of test cases that are used.
On the other hand, single sets of subdomains required the input parameters ofTCASto be man-ually scaled before optimisation can be effective. This is not trivial, since an understanding of the program code is necessary to determine which pa-rameters to scale. Our technique for optimising multiple sets of subdomains stretches the program code automatically, without the need to inspect its constants. In addition, each set of subdomains is targeted at a different group of mutants, allow-ing mutants to be killed more efficiently.
Sampling test cases from multiple sets of op-timised subdomains achieved on average 33% higher mutation score than single sets and 230% higher than unoptimised random testing. Mul-tiple sets of subdomains were on average only slightly more computationally expensive to evolve than single sets. They took less time for some pro-grams and more time for others. Multiple sets of subdomains were particularly effective at evolving subdomains for TCAS. On average they achieved
71% higher mutation score than single sets and took 1/7th of the time to evolve.
The subdomains identified by our optimisation techniques can serve as a starting point for regres-sion testing. They highlight specific regions in the input domain that are effective at indicating when the behaviour of the program has changed. This is particularly helpful when those changes are un-intended, but when the difference is intentional, the evolution strategy should be able to adapt the current set of subdomains more quickly than if it had started from an earlier state. The speciali-sations achieved by multiple sets of subdomains allow the tester to track the effect that changes have on the behaviour of the program with regard to its requirements for testing.
The subdomains identified by our technique re-veal information about the program under test. For example, to achieve a high mutation score with TCAS, test input values must be used for
‘Cur Vertical Sep’ that are greater than 600. This information can be used to produce new more ef-ficient test suites in the future. In this way, sub-domains can be seen as an effective tool to sup-port testing. Subdomain optimisation is compu-tationally expensive compared to random testing at first. Yet once efficient subdomains have been identified, the cost of sampling new test cases is insignificant and the ability of the new test cases to find faults is substantially increased.
Subdomain selection can be performed, once optimisation is complete, to significantly improve the efficiency of the resulting test suites. Sub-domain selection reduced the number of subdo-mains for four out of six programs with little ef-fect on mutation score. Subdomain selection is successful as long as there is some overlap in the mutants each subdomain kills. This was not the case for SVD because its mutants were too easy to kill orSchedulebecause too few subdomains were evolved for it. Subdomain selection is com-putationally inexpensive compared to subdomain optimisation and acts as a useful tool, providing significant improvement for certain programs.
12. Future Work
Three main continuations are envisaged: 1. Applying the experiments in this paper
to larger more complex software
2. Deriving efficient subdomains from the results of previous test results
3. Optimising test input distributions to cover the entire input domain
The largest program used in our experiments (Replace) only has 500 lines of code. There is no
reason in principle why our techniques could not be applied to larger programs. The biggest chal-lenge we face in demonstrating this is the time it takes to run each experiment. It took an average of 23.5 hours to optimise multiple sets of subdo-mains forReplace. We need to reduce this time
Subdomain optimisation is computationally ex-pensive and much effort is spent generating test cases that are immediately discarded in favour of the resulting subdomains. However, there is no reason why subdomains could not be optimised at the same time as the software is being tested.
Rather than generating test cases explicitly for the purposes of subdomain optimisation, subdo-mains may be derived from the results of other test data generation tools. An advantage of this is that it is no longer necessary for our subdomain optimisation tool to generate effective test data. A disadvantage is that the test data available from other tools may not provide the most useful infor-mation for characterising the input domain.
Another limitation of subdomain optimisation is that it is necessary to sample outside the evolved subdomains to test software thoroughly. Our approach provides little information about when to do this or which values are most likely to be useful. One solution is to optimise input distri-butions that cover the entire input domain rather than subdomains which just cover certain key ar-eas. Techniques to achieve this may be borrowed from the field of structural statistical testing [41]. This extension of our technique would allow each test case evaluation to have a more direct im-pact on the shape of the input distribution than is possible by using a CMA-ES to evolve sets of subdomains. Statistical testing is more expres-sive than subdomain testing and can take into ac-count more of the information gained by test case evaluation. One downside is that more compu-tational resources may be required to optimise a distribution for the entire input domain. Another important question is whether a (potentially non-smooth) input distribution is as straightforward for test engineers to conceptualise and apply.
References
[1] Sun, Java compatability kit 6b user’s guide (2008). URL http://openjdk.java.net/groups/conformance/-docs/JCK6bUsersGuide/JCK6b Users Guide.pdf
[2] Oracle, Java bug database. URLhttp://bugs.sun.com
[3] E. W. Dijkstra, Notes on structured programming, Academic Press Ltd., 1972.
[4] S. Mahmood, A systematic review of automated test data generation techniques, Master’s thesis (2007). [5] B. Bezier, Software testing techniques (2nd ed.), The
Coriolis Group, 1990.
[6] E. Dustin, J. Rashka, J. Paul, Automated soft-ware testing: introduction, management, and perfor-mance, Addison-Wesley Professional, 1999.
[7] E. Weyuker, On testing non-testable programs, Tech. rep., New York University (1980).
[8] P. McMinn, M. Stevenson, M. Harman, Reducing qualitative human oracle costs associated with au-tomatically generated test data, in: Proc. 1st Int. Works. Softw. Test Output Validation, 2010, pp. 1–4. [9] G. J. Myers, T. Badgett, T. M. Thomas, C. Sandler,
The art of software testing, Wiley, 2004.
[10] C. C. Michael, G. McGraw, M. A. Schatz, Generating software test data by evolution, IEEE Trans. Softw. Eng. 27 (12) (2001) 1085–1110.
[11] J. W. Duran, S. C. Ntafos, Evaluation of random test-ing., IEEE Trans, Softw. Eng. 10 (4) (1984) 438–444. [12] J. H. Andrews, S. Haldar, Y. Lei, F. C. H. Li, Tool support for randomized unit testing, in: Proc. 1st Int. Works. Random Testing, 2006, pp. 36–45.
[13] T. B¨ack, Evolutionary algorithms in theory and prac-tice, England: Oxford Univ. Press, 1996.
[14] T. Weise, Global optimization algorithms - theory and application (2009).
URLhttp://www.itweise.de/projects/book.pdf [15] A. J. Offutt, A. Lee, G. Rothermel, R. H. Untch,
C. Zapf, An experimental determination of sufficient mutant operators, ACM Trans. Softw. Eng. Method-ology (TOSEM) 5 (2) (1996) 99–118.
[16] N. Li, U. Praphamontripong, J. Offutt, An exper-imental comparison of four unit test criteria: Mu-tation, edge-pair, all-uses and prime path coverage, in: 4th Int. Works. Mutation Analysis, Denver, CO, 2009, pp. 220–229.
[17] P. G. Frankl, E. J. Weyuker, Provable improvements on branch testing, IEEE Trans. Softw. Eng. 19 (10) (1993) 962–975.
[18] R. Baker, I. Habli, An empirical evaluation of muta-tion testing for improving the test quality of safety-critical software, IEEE Trans. Softw. Eng. 39 (6) (2013) 787–805.
[19] J. H. Andrews, L. C. Briand, Y. Labiche, Is muta-tion an appropriate tool for testing experiments?, in: Proc. 27th Int. Conf. Softw. Eng., St. Louis, MO, 2005, pp. 402–411.
[20] X. S. Yang, Nature-inspired metaheuristic algo-rithms, Luniver, Frome, 2011.
[21] H.-G. Beyer, H.-P. Schwefel, Evolution strategies: a comprehensive introduction, Natural Computing 1 (1) (2002) 3–52.
[22] H.-P. Schwefel, Evolution and optimum seeking, Wi-ley, New York, NY, 1995.
Comparing results of 31 algorithms from the black-box optimization benchmarking BBOB-2009, in: 12th Genetic Evolutionary Computation Conf., 2010, pp. 1689–1696.
[24] N. Hansen, The CMA evolution strategy: a compar-ing review, in: J. A. Lozano, P. L. naga, I. Inza, E. Bengoetxea (Eds.), Towards a new evolutionary computation (studies in fuzziness and soft comput-ing), Berlin, Germany: Springer, 2006, pp. 75–102. [25] K. Ghani, J. Clark, Widening the goal posts:
pro-gram stretching to aid search based software testing, in: Proc. 1st Int. Symp. Search Based Softw. Eng., 2009.
[26] P. Pudil, F. J. Ferri, J. Novovicova, J. Kittler, Float-ing search methods for feature selection with non-monotonic criterion functions, in: Proc. 12th Int. Conf. Pattern Recognition, 1994, pp. 279–283. [27] P. Ammann, J. Offutt, Introduction to software
test-ing, New York, NY: Cambridge Univ. Press, 2008. [28] M. P. Usaola, P. R. Matteo, B. P. Lamancha,
Reduc-tion of test suites using mutaReduc-tion, in: Proc. 15th Int. Conf. Fundamental Approaches Softw. Eng., 2012, pp. 425–438.
[29] M. Papadakis, N. Malevris, Automatic mutation test case generation via dynamic symbolic execution, in: Proc. 19th Int. Symp. Softw. Testing Analysis, 2010, pp. 121–130.
[30] Apache, Commons math - linear algebra (2013). URL http://commons.apache.org/proper/-commons-math/userguide/linear.html
[31] A. Arcuri, L. Briand, A hitchhiker’s guide to statisti-cal tests for assessing randomized algorithms in soft-ware engineering, Softw. Testing, Verification Relia-bility 24 (3) (2012) 219–250.
[32] R. P. Pargas, M. J. Harrold, R. R. Peck, Test-data generation using genetic algorithms, Softw. Testing Verification Reliability 9 (4) (1999) 263–282.
[33] M. Hutchins, H. Foster, T. Goradia, T. Ostrand, Experiments on the effectiveness of dataflow- and controlflow-based test adequacy criteria, in: Proc. 16th Int. Conf. Softw. Eng., 1994, pp. 191–200. [34] C. V. Ramamoorthy, S. F. Ho, W. T. Chen, On the
automated generation of program test data, in: Pro. 2nd Int. Conf. Softw. Eng., IEEE Computer Society Press, San Francisco, California, United States, 1976, p. 636.
[35] Y.-S. Ma, J. Offutt, Y. R. Kwon, Mujava: an auto-mated class mutation system, J. Softw. Test. Verif. Rel. 15 (2) (2005) 97–133.
[36] W. E. Wong, A. P. Mathur, Reducing the cost of mutation testing: an empirical study, Jornal Syst. Softw. 31 (3) (1995) 185–196.
[37] T. Y. Chen, H. Leung, I. K. Mak, Adaptive random testing, in: Advances in Computer Science, 2005, pp. 320–329.
[38] T. Y. Chen, R. G. Merkel, An upper bound on
soft-ware testing effectiveness, ACM Trans. Softw. Eng. Methodology 17 (3) (2008) article no. 16.
[39] A. Arcuri, L. Briand, Adaptive random testing: an illusion of effectiveness?, in: Proc. 20th IEEE Int. Symp. Softw. Testing Analysis, 2011, pp. 265–275. [40] D. Hamlet, Composing Software Components,
Springer, New York, NY, 2010.
[41] S. Poulding, J. A. Clark, Efficient software verifica-tion: statistical testing using automated search, IEEE Trans. Softw. Eng. 36 (6) (2010) 763–777.
[42] J. H. Andrews, T. Menzies, F. C. H. Li, Genetic al-gorithms for randomized unit testing, IEEE Trans. Softw. Eng. 37 (1) (2011) 80–94.
[43] M. Harman, Y. Jia, W. B. Langdon, Strong higher order mutation-based test data generation, in: Proc. 19th ACM SIGSOFT Symp. 13th Conf. Foundations Softw. Eng., 2011, pp. 212–222.
[44] G. Fraser, A. Zeller, Mutation driven generation of unit tests and oracles, in: Proc. 19th Int. Symp. Softw. Testing Analysis, 2010, pp. 147–158.
[45] J. C. B. Ribeiro, Search-based test case generation for object-oriented java software using strongly-typed genetic programming, in: 10th Genetic Evolutionary Computation Conf., 2008, pp. 1819–1822.
[46] N. Tracey, J. Clark, K. Mander, Automated program flaw finding using simulated annealing, in: Proc. 7th Int. Symp. Softw. Testing Analysis, 1998, pp. 73–81. [47] E. D´ıaz, J. Tuya, R. Blanco, Automated software testing using a metaheuristic technique based on tabu search, in: Proc. 18th Int. Conf. Automated Softw. Eng., 2003, pp. 310–313.
[48] R. Blanco, J. Tuya, B. Adenso-D´ıaz, Automated test data generation using a scatter search approach, In-formation Softw. Technology 51 (4) (2008) 708–720. [49] B. Baudry, F. Fleurey, J.-M. J´ez´equel, Y. Le Traon,
Automatic test cases optimization using a bacterio-logical adaptation model: Application to .NET com-ponents, in: Proc. Int. Conf. Automated Softw. Eng., 2002, pp. 253–256.
[50] P. S. May, Test data generation: two evolutionary approaches to mutation testing, Ph.D. thesis (2007). [51] J. Wegener, A. Baresel, H. Sthamer, Evolutionary test environment for automatic structural testing, In-form. Softw. Technology 43 (14) (2001) 841–854. [52] S. Yoo, M. Harman, Regression testing minimisation,
selection and prioritisation: a survey, Softw. Testing, Verification Reliability 22 (2) (2012) 67–120.
[53] M. J. Harrold, R. Gupta, M. L. Soffa, A methodology for controlling the size of a test suite, Softw. Testing, Verification Reliability 2 (3) (1993) 270–285.
[54] T. Y. Chen, M. F. Lau, Dividing strategies for the optimization of a test suite, Information Processing Letters 60 (3) (1996) 135–141.