Int. J. Electrochem. Sci., 6 (2011) 256 - 269
International Journal of
ELECTROCHEMICAL
SCIENCE
www.electrochemsci.orgEffects on the PEMFC Performance by Combination of Gas
Distribution Plates and Gas Diffusion Medias
C. M. Bautista-Rodríguez1,*, M. G. A. Rosas-Paleta2, J. A. Rivera-Marquez2, N. Tepale-Ochoa2
1
Alter-Energías Grupo. Tepetitlán No. 63, Col. Lomas del Sur. CP 72470 Puebla, Puebla.
2
BUAP. Facultad de Ingeniería Química. Av. San Claudio y 18 Sur - CU. CP. 72590 Puebla, Puebla.
*
E-mail: [email protected]
Received: 12 October 2010 / Accepted: 30 October 2010 / Published: 1 February 2011
PEMFC performance is limited by different mass transport phenomena during operation as: mass transport (conduction and diffusion) of reactive gases, ionic species and products, electron conductivity and ionic conductivity. The reagents are distributed by conduction on the diffusion layer surface of electrodes through manufactured distribution channels in the polar plates. Subsequently, the reactive gases diffuse to the active layer, where the electro-chemical semi-reactions take place. However, geometry, size, diameter, porosity and other physical characteristics in the structural basic elements for fuel cells generate particularly effects on the Proton Exchange Membrane Fuel Cell (PEMFC) performance. This paper includes an experimental comparison between different structural PEMFC designs; These designs combining different distribution plates and Gas Distribution Medias (GDM) in the PEMFC, by application of a 23 experimental design with 3 different membrane-electrodes assemblies and 3 cathodic pressure levels. The results show significant effects on the functionality and generated electrical power by the PEMFC directly related to mass transport conditions (including electron transport), depending on the combination, material nature, electrical and structural characteristics of applied materials.
Keywords: PEMFC performance, mass transport, electrical conductivity, porous diameter, Membrane-electrode Assembly, PEMFC structural design
1. INTRODUCTION
technology is found in the proton exchange membrane fuel cells (PEMFC), which transforms the chemical energy of the reactants into electrical energy with high efficiency, using the zero rate of contamination when using hydrogen and oxygen as reactants, being water its only waste. This technology operates at temperatures up 120°C and pressures between 1-5 atmospheres [1-8].
Nowadays, a PEMFC application is focused on the transport industry, for example; in April 2009, Honda Co. had presented the hydrogen fuel cell car (FCX Clarity), which was awarded as The Green Car (World Green Car) with 430 km of autonomy and hydrogen consumption about 3.3 litres/100 km. In same year, Mercedes-Benz launches a limited edition of Mercedes Benz B Class, which contain the more compact and efficient PEMFC in the market. The same fuel cell equipment was used in F- Cell Zero Blue Concept, its electric motor gave 136 hp and 320 Nm as maximal torque, these values were considered as a good base in comparison with a diesel motors with 2.0 liter engine capacity. Mercedes-Benz has reported that the hydrogen consumption is equivalent to 2.9 liters of diesel per 100 kilometers. In May 2008 was established the first aircraft powered by an hydrogen fuel cell, the objective was to take off and climb to 1,000 m above sea level and maintain the aircraft at that altitude for 20 minutes at cruising speed of 100 km / h [8-11].
A PEMFC structural design at conventional type was reported in December 2007 [12]. A scheme of this design is presented in Figure 1. The centerpiece of this design involves a component assembly under pressure and temperature conditions in the order electrode-membrane-electrode (named MEA) using Etek electrodes and electrolyte membrane was Nafion 115 ®. This assembly is clamped between two graphite plates with a serpentine channel manufactured through which reactive gases flow to be distributed over the area of the electrodes as well as distributing and supporting the MEA, this element collects the electric current generated. Finally, these elements are supported mechanically on copper plates as shown in Figure 2.
Figure 1. Scheme of a conventional PEMFC Figure 2. Conventional PEMFC design.
Etek electrodes porous type were used and the main components of this electrode are: i) a carbon-PTFE fabric shown in Figure 3 (Optical microscopy was obtained with a microscope Nikon Eclipse MA 100 Sighy digital camera Ds-Fi-1), which provides mechanical strength and reagents
Membrane
Joint
Etek Electrodes
Copper
O2 or Air
H2O H2
H2O
Graphite plate with Serpentine channel Membrane
Joint Support in
O2
H2O H2
H2O
Membrane
Joint
Etek Electrodes
Copper
O2 or Air
H2O H2
H2O
Graphite plate with Serpentine channel Membrane
Joint Support in
O2
H2O H2
[image:2.596.53.530.486.648.2][image:3.596.186.412.147.321.2]
diffusion medium, its thickness is about 0.26 mm and density 0.49 g/cm3, ii) The active layer (Figure 4) contains carbon type Vulcan XC-72 and a catalyst charge of 0.4 mg/cm2 for this case platinum (Pt) and a load of Nafion ® film equivalent to 0.7 mg/cm 13.
Figure 3. Structural support for the active layer in Etek electrodes at 20 x 0.45 increases.
Figure 4. Active layer in Etek electrodes at 50 x 0.8 increases.
The efficiency on conventional PEMFC (as shown in Figure 1) is limited according to the literature by mass transport and kinetic phenomena, these are: i) electrochemical kinetics, clearly the oxygen reduction reaction, ii) mass transport phenomena as: transport (conduction) and diffusion of chemical species (H2, O2 and N2 when air is used), species dissolution and conductivity of ionic
[image:3.596.185.411.376.548.2]
dilution (concentration gradients) along the distribution channels by consumption, vi) channel’s inundation by water (the main cause of falls in the functionality of the PEMFC at high current densities due to transport barriers, which causes the liquid water trapped in the pores of electrodes, these barriers come to cause dead spots on the active area of the electrodes by reducing the effective reaction area), vii) direction changes of mass flow within the distribution channels, viii) variability in the concentration and density of gases by pressure changes (the reagent consumption and product generation), ix) non-uniform distribution of reagents on the active layer surface in the electrodes due to the mechanical conditions between the distribution channels and the structural characteristics in the diffusion layer (which generate an uneven distribution of current and potential on the electrode area, being particularly significant in function of the increases in area). The operative conditions imposed on the PEMFC and the channels geometry in the distribution plates are the determinants factors for the last mentioned variables, where; an inefficient design for flow fields can cause a decrease in the reactive gases consumption and an inefficient drainage system for the products (reducing the active area of the electrode by the generation of concentration gradients in the flow of reactants), x) on the other hand, the use of oxygen in air as fuel represents a dilution in the concentration of oxygen (developing a low partial pressure of oxygen, which slows down the oxygen reduction reaction efficiency and reducing power generated by the PEMFC) [8-24]. Particularly for the serpentine design, some studies [22-24] suggest the presence of concentration gradients of reagents on the active layer of electrodes, including the presence of dead zones (no reaction) for heterogeneous distribution of reagents due to the angle flow around the channels width, diffusion layer and active layer surface. Dutta and colleagues confirmed the presence of these concentration gradients along the channels; their mathematical models also suggest the presence of different flow profiles depending on the distance between the bottom of the channel and the electrode surface, including vortices. The address in the transport of water in the channels alters the density in the local streams, mainly in the cathode where water is generated reaction product. The distribution of reactive gas flow is affected by consumption patterns in areas closest to the electrode surface. An interesting result is the determination of pressure drops in channels of distribution, lower than expected for both gases (H2 and O2) [23, 24- 26].
iii) the active layer in the electrodes. It also describes concentration gradients of reactive gas through the diffusive half and running on the active layer of the electrodes. Another important factor is the length of the diffusion layer which depends on the thickness in the diffuser, the channel and its width, which represents 19% of the total resistance; this means that the diffuser provides only part of the resistance of mass transport. In the diffusion layer, the mass transport resistances are generated by: the pore size, which is defined on the basis of particularly data for each study. Kong and col. [15] have reported a paper, citating the three types of pores; macropores having a diameter of about 5 to 20 μm, the micropores having a diameter of about 0.03 to 0.06 μm and mesopores with a diameter approximately between 0.06 to 5 μm [18]. The authors propose an interval between 5 and 10 mm as optimum diameter, which was obtained after acid treatment, using mixtures of Li2CO3 to generate
porosity after heat treatment. On the other hand, Knudsen proposes that the water diffusion in the pores, blocks the active sites to all mass transport, implying an adverse effect on the PEMFC performance[25].
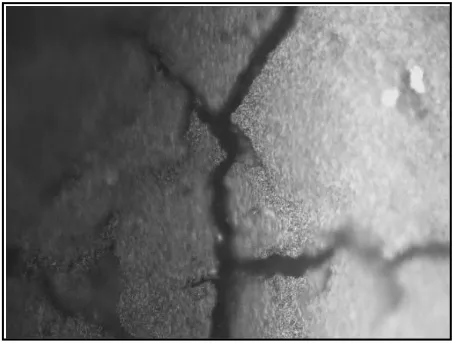
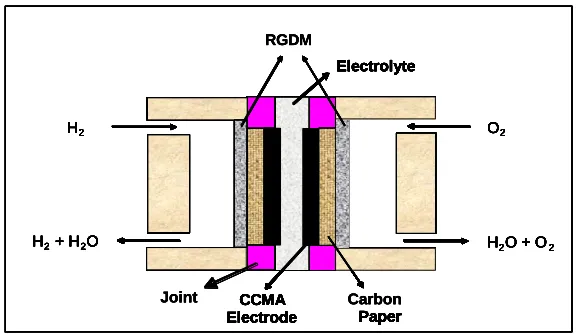
[image:5.596.147.435.559.726.2]In recently papers [27, 29], we have reported the result of a PEMFC with an innovative structural design; its scheme is presented in Figure 6. This design use a Rigid Gas Diffusion Media (RGDM, Figure 7) as a gas distributor (polar plate) for reactive gases and applies carbon paper (Toray paper TGPH-090, Figure 8) as diffusion layer, applying a catalytic coating membrane assembly (CCMA, Figure 9) as MEA. Figure 7 shows the RGDM used, this material show a structural matrix with remarkable porosity, this feature is appropriate as a means of distribution of reactive gases to the Toray paper an later to the catalytic layer of the CCMA applied in the design. The porosity in the material allows a reduction in resistance to reactive transport, hoping a positively impact on the PEMFC performance. The RGDM also functions as an electrical current collector in which electrons migrate in the structural matrix of the material itself. The material for RGDM is graphite Helwin GH Carbon Co., used in electric furnaces and reused for this application, its constitution is a mixture of carbon powder, graphite and electro-conductive resins as a binder. Particularly, this material is composed for carbon and graphite powders; moreover the content of carbon powder is higher to that of graphite where graphite conductivity is higher.
Figure 6. Scheme of a PEMFC experimental.
H2
H2+ H2O
O2
H2O + O2
Electrolyte
CCMA
Electrode Paper
H2
H2+ H2O
O2
H2O + O2
RGDM
Electrolyte
CCMA
Electrode Paper
H2
H2+ H2O
O2
H2O + O2
Joint Electrolyte CCMA Electrode Carbon Paper H2
H2+ H2O
O2
H2O + O2
Electrolyte
CCMA
Electrode Paper
H2
H2+ H2O
O2
H2O + O2
RGDM
Electrolyte
CCMA
Electrode Paper
H2
H2+ H2O
O2
H2O + O2
Joint Electrolyte CCMA Electrode Carbon Paper H2
H2+ H2O
O2
H2O + O2
Electrolyte
CCMA
Electrode Paper
H2
H2+ H2O
O2
H2O + O2
RGDM
Electrolyte
CCMA
Electrode Paper
H2
H2+ H2O
O2
H2O + O2
Joint Electrolyte CCMA Electrode Carbon Paper H2
H2+ H2O
O2
H2O + O2
Electrolyte
CCMA
Electrode Paper
H2
H2+ H2O
O2
H2O + O2
RGDM
Electrolyte
CCMA
Electrode Paper
H2
H2+ H2O
O2
H2O + O2
[image:6.596.164.432.265.460.2]
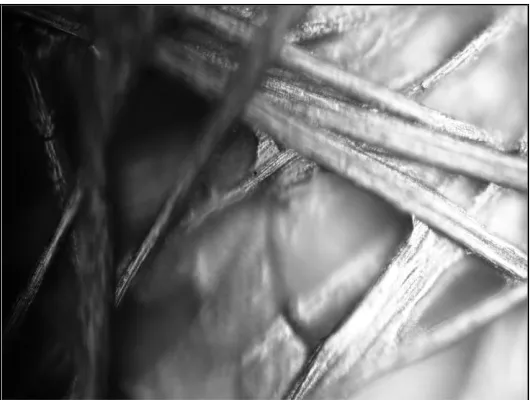
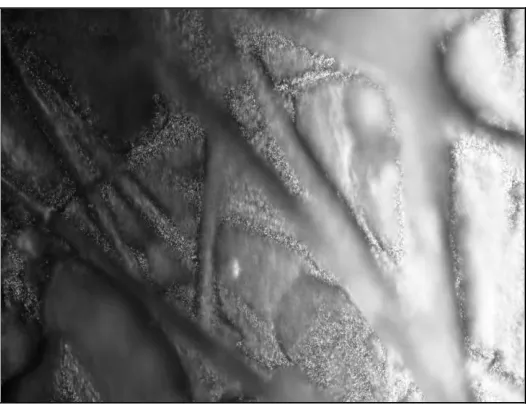
Figure 8 shows the Toray paper structure, consisting of layers of carbon fibers and binder, there is an irregular and open structure. Under these conditions, the transport phenomena of reactive gases are favored while the electron transport can increase its limitations. The CCMA used in this work has been developed by the Department of Chemistry, CINVESTAV [28], the main features of preparation are: using an ink prepared with 2.5 mg of platinum (ETek), mixed with 1 mg of carbon powder (Vulcan XC-72, Cabot) with a 5% film Nafion in ethanol solution. This ink is applied on the reactive area defined by spraying with air compressed on the Nafion membrane. This procedure is used at both sides of Nafion membrane as electrodes (anode and cathode); later the CCMA and the graphitized paper submit to thermo pressure according to the literature, a topographical image of this material after use is shown in Figure 9.
[image:6.596.166.431.520.720.2]Figure 7. Optical Microscopy on RGDM surface at 50 x 0.8 increases.
Figure 9. Optical Microscopy on CCMA surface by flow gas side at 50 x 0.8 increases.
Early results [27] of the PEMFC with innovative structural design were: i) anode energy contribution by the application of equivalent pressures in both compartments of reactive power, ii) polarization curve shows a linear behavior in the area of ohmic losses, while iii) a shift of the polarization curve at higher current densities is observed in the area of diffusion losses, iv) electrical power developed by the PEMFC shows also a shift to higher current densities in the values after the maximum power reached, this displacement increases as a function of the applied pressure. Finally, v) values of maximum power developed by the PEMFC shows changes in comparison to that of a conventional design with serpentine distributor channels. This paper presents a comparative study of different materials, electrodes and structures combinations in the structural PEMFC design at the same operating conditions in order to determine the best features of mass transport for obtaining maximum efficiency PEMFC.
2. EXPERIMENTAL CONDITIONS
Table 1. Experimental design for cases in study.
PEMFC Elements
Assembly 1 (E1)
Assembly 2 (E2)
Assembly 3 (E3)
Gas Distributor
Serpentín Channels
Serpentín Channels
Rigid Gas Diffusion Media
Electrodes ETEK CCMA CCMA
[image:7.596.120.480.623.755.2]
The PEMFC structural designs used in this work were described above, where the electrolyte membranes used were Nafion ® 115 and Nafion ® 112 with thicknesses of approximately 100 µm and 51 μm respectively [3, 9, 10]. Electrodes were Etek and CCMA and the others details for this experimental design has been detailed in last section. The fuel gas feed to the PEMFC were: H2, 99%
Infra and O2, 99% Infra. The PEMFC functionality characterization was conducted in a test bench type
"Fuel Cell Test System Globe Tech Compu-Cell GT-890-B”. On other hand, Table 1 presents the MEA cases for this work and operative conditions are indicated in Table 2.
Table 2. Operative conditions imposed on PEMFC test bench.
Variables (unities) Anode Cathode
Gas Flow (cc/min) 50 50
Pressure (psi) 4, 5 4-5,10, 15
Humidification Temperature (°C) 31, 35 31, 35
Cell Temperature (°C) 22 22
3.RESULTS AND DISCUSSION
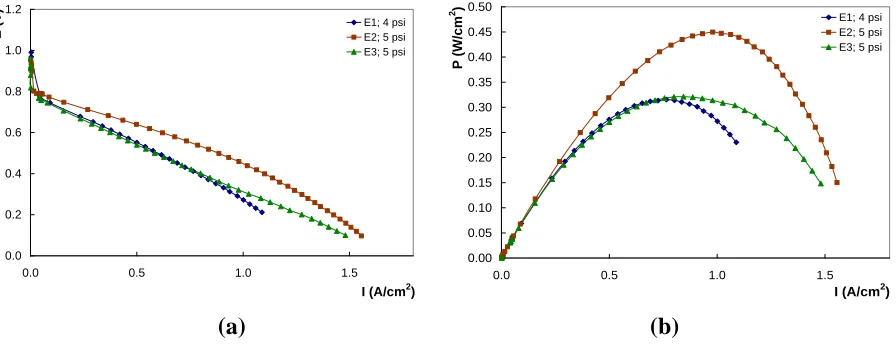
The polarization curves in Figure 10.a correspond to PEMFC operation with structural designs listed in Table 1 at pressure conditions surrounding a 5 psi in both compartments (anode and cathode).
0.0 0.2 0.4 0.6 0.8 1.0 1.2
0.0 0.5 1.0 1.5
I (A/cm2)
E (V)
E1; 4 psi E2; 5 psi E3; 5 psi
0.00 0.05 0.10 0.15 0.20 0.25 0.30 0.35 0.40 0.45 0.50
0.0 0.5 1.0 1.5
I (A/cm2)
P (W/
cm
2)
E1; 4 psi E2; 5 psi E3; 5 psi
(a) (b)
Figure 10. I-E curves (a) and Electrical Power (b) developed by the PEMFC structures in study at around 5 psi in both compartments.
[image:8.596.74.522.476.648.2]
Table 3. Losses zones for each polarization curve in Figure 10.a.
Current Density Intervals (A/cm2)
Zones E-I E 1 E 2 E3
Activation 0.0 – 0.1 0.0 – 0.1 0.0 – 0.06 Ohmic 0.1 - 0.7 0.1 - 1.0 0.06 – 0.9 (*) Diffusion 0.7 – 1.1 1.0 - 1.6 0.9 – 1.5
(*) It’s observed a change on the slope between 0.9 and 1.3 A/cm2 attributable
to improved hydratation conditions in the electrolyte, increasing the functionality of the fuel cell until the transport resistances dominate on global process and increases the tension fall.
A significant voltage drop at the beginning of activation zone (0 - 0.1 A / cm2) is observed on each polarization curve in Figure 10.a. In general, this fall is attributable to poor electrical contact between the different interfaces of materials surfaces, in others words; a low electrical conductivity between the CCMA-Carbon Paper- Current Collectors. The E3 assembly uses Active Layer-Carbon Fabric-Carbon paper-Current Collector interfaces. Here, the Carbon Fabric in Etek electrode is the difference with the previous cases, where CCMA (experimental electrode) uses a carbon paper as a diffusion layer in E1 and E2 assemblies versus E1 using carbon fabric of Etek electrode and carbon paper as a diffusion layer combined. However, E2 shows the best condition for activation process on the active layer of the electrode, this behavior may be attributable at highest electrical conductivity (Mean Conductivity = 1.27 S/cm ) in the gas distributors where its material is a solid graphite plate with serpentine channel versus graphite porous plate (Mean Conductivity = 0.61 S/cm) as gas distributor in E3 case. Furthermore, the E-I curves for E1 and E3 show similar behavior on the ohmic zone where both curves are very close but slightly larger for E1 (ohmic losses are composed by ionic and electrical conductivities). However this zone shows a linear behavior for E3 assembly on the interval 0.06 – 9 A/cm2. This result supposes that electrical conductivity is the dominant step in the PEMFC performance using E3 assembly and it could be attributed at an open matrix and insufficient for the global electron transport generated in the anode of the PEMFC through diffusive environment moreover the linear behavior in E3 suggest a Ohm's Law function (I = V / R), this phenomena may be due to the low conductivity in the RGDM as gas distributor used in E3, this limitation may increase the electrical energy transformation in heat causing low performance in PEMFC. Figure 11 shows a scheme about electronic transport limitation for this case.
tension fall attributable to dead zones between the channels of distribution of polar plates interacting with the structure of Toray paper and the water management is also implicated. Figure 10.b shows the power curves developed by the PEMFC in the study, which confirmed the observations in I-E curves corresponding. ē ē ē ē ē ē ē ē ē ē ē ē ē ē ē Q Q Q (a) (b) SYMBOLOGY Electronic Migration Conductive Site
e- Electron
Electronic Collisions
Q Energy Loss as Heat
ē ē ē ē ē ē ē ē ē ē ē ē ē ē ē ē ē ē ē ē ē ē ē ē ē ē ē ē ē ē ē ē ē ē ē ē ē ē ē ē ē ē ē Q Q Q (a) (b) SYMBOLOGY Electronic Migration Conductive Site
e- Electron
Electronic Collisions
Q Energy Loss as Heat
Figure11. Scheme for electronic transport limitations in closed (a) and opened (b) conductive matrix.
Two observations are noteworthy: 1) the power generates by E2 assembly is the greatest; and 2) the E3 performance curve shows a shift at higher current densities (between 0.7 – 1.5 A/cm2), this is particularly important in spite of developing a lowest power compared to E2 curve, this behavior is attributable to improvement in mass transport due to the mean diameter size in pores of RGDM.
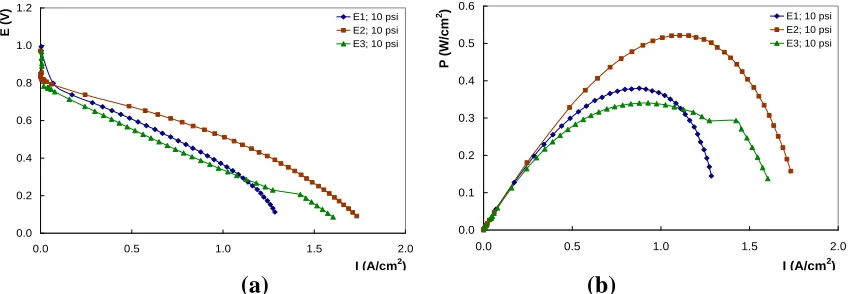
Figure 11.a shows the behavior of PEMFC performance based on the different assemblies at 10 psi in the cathode and 5 psi in the anode. Table 4 shows the intervals in electrical current density that manifests the dominant voltage losses on the PEMFC functionality for structural combinations studied at this pressure conditions.
0.0 0.2 0.4 0.6 0.8 1.0 1.2
0.0 0.5 1.0 1.5 2.0
I (A/cm2)
E (V)
E1; 10 psi E2; 10 psi E3; 10 psi
0.0 0.1 0.2 0.3 0.4 0.5 0.6
0.0 0.5 1.0 1.5 2.0
I (A/cm2)
P (W/cm
2) E1; 10 psi
E2; 10 psi E3; 10 psi
[image:10.596.84.510.550.697.2](a) (b)
The polarization curves for E1 and E2 assemblages (Figure 11.a) show a typical behavior due to pressure increase compared to the previous case, i.e., ohmic resistances are reduced at medium current densities and the mass transport constraints increase at high current densities. The overall difference in the functionality of the PEMFC and the power developed in each case is attributable to the limitations of mass transport toward the reaction zone in the electrodes; this is due at the structural characteristics in the materials applied, particularly in the interphases Toray Paper-Diffusion layer of Etek electrodes for E1 and Toray Paper-CCMA for E2. The results in Figure 11.a suggest that E2 assembly compose the lesser resistance to mass transport in comparison with the other cases. On other hand, the E3 assembly shows similar tendencies on activation and ohmic zones in comparison with same case at 5 psi. Particularly, ohmic zone maintains the same linear behavior between 0.05-1.35 A/cm2, this suggest a high electronic transport limitation in E3 at these pressure levels (5, 10 psi). However, a notable shift is notable at high current density where it is achieved 1.6 A/cm2 at these pressure conditions and confirms a better mass transport by diffusion in RGDM. This shift is also observed on its power curve (Figure 11.b) after 1.15 A/cm2 where curve cross the power curve for E1.
Table 4. Losses zones for each polarization curve in Figure 11.a.
Current Density Intervals (A/cm2)
Zones E-I E 1 E 2 E3
Activation 0.0 - 0.1 0.0 – 0.1 0.0 – 0.08 Ohmic 0.1 – 1.1 0.1 - 1.18 0.08 - 1.28 Diffusion 1.1 - 1.3 1.18 – 1.8 1.28 – 1.6
A second observation is presented at the beginning of the diffusion zone (1.3 A/cm2), where the sudden change of slope could be attributed to an instantaneous increase of oxygen concentration and reaction. This mechanism can be attributed to a remosion of particles, occurring an release of the surface inside the pores into the rigid diffuser, effect due to increase of shear force at flow of gas to the cathode pressure level. The shear force removes the adsorbed particles into the pore surface suddenly and release the reagent inlet, increasing the oxygen concentration on the catalytic surface instantaneously, affecting the performance and power output by the PEMFC (Figure 12.b) 29 and second, the diameter of the pores in the graphite paper allows a high drainage rate of water and residual gas at the fuel cell outside by the gas distributor, favoring the PEMFC functionality at high current densities.
0.0 0.2 0.4 0.6 0.8 1.0 1.2
0.0 0.5 1.0 1.5 2.0
I (A/cm2)
E
(V) E1; 14 psi
E2; 15 psi E3; 15 psi
0.0 0.1 0.2 0.3 0.4 0.5 0.6
0.0 0.5 1.0 1.5 2.0
I (A/cm2)
P
(W
/c
m
2)
E1; 14 psi E2; 15 psi E3; 15 psi
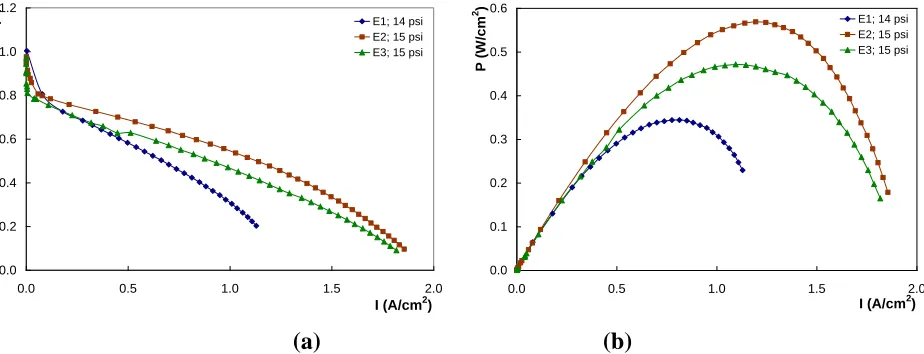
[image:12.596.67.529.76.253.2] [image:12.596.135.464.351.429.2](a) (b)
Figure 12. E-I curves (a) and Electrical Power (b) developed by the PEMFC structures in study at 15 psi of cathodic pressure and 5 psi of anodic pressure.
Table 5. Losses zones for each polarization curve in Figure 12.a.
Current Density Intervals (A/cm2)
Zones E-I E 1 E 2 E3
Activation 0.0 – 0.08 0.0 – 0.08 0.0 - 0.1
Ohmic 0.08 – 0.8 0.08 - 1.2 0.1 – 1.4
Diffusion 0.8 – 1.1 1.2 - 1.88 1.4 – 1.82
For E3 assembly, the activation zone has a sharp voltage drop, as mentioned above is attributable to poor electrical contact. While in the area of ohmic losses can be seen a double energetic jump: the first one occurs between the interval 0.38 to 0.42 A/cm2, which can be attributed to greater hydration of the membrane with an increase of ionic conductivity due to sudden increase to reaction rate by a higher oxygen concentration caused by the improvement in mass transport phenomena into the pores of RGDM. The second jump lies between 0.42 and 0.5 which is attributable to the release of channels inside the diffuser and hence the sudden increase in the concentration of O2 as a result of
increased pressure. For E2 assembly, the curve reaches higher levels of current density compared with E3 and the activation area has a remarkable shift, where the catalytic activation in CCMA increases probably by the improved electrical contact between Toray paper - Electrode, due to the pressure level and the higher O2 concentration, then the performance in the fuel cell increase according with the
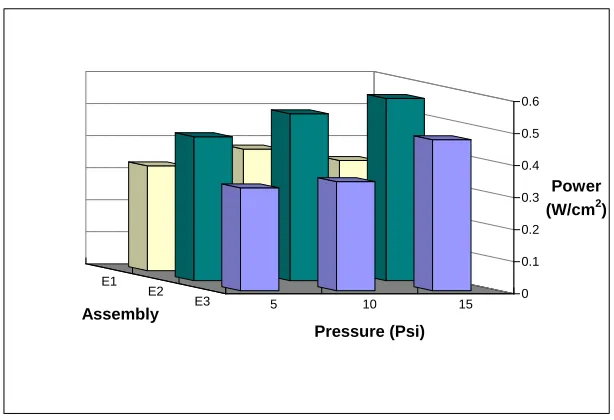
Figure 13 shows the maximum electrical power reached by the assemblies used in this study by each one of pressure level applied. In general, it is observed a power increase as a pressure function; however, this increasing is not proportionate in all cases. For E1, the highest power is observed at around 10 psi but at major pressure, the power presents a significant decrease, this behavior is attributable to kinetics limitations on the catalytic layer of Etek electrodes, may be the diameter pore size is smaller in comparison with those in E2 and E3. On the other hand, for E2, the increases in maximum power generated tend to be proportionate in terms of pressure, which reflects the best conditions for mass transport, including electronic migration.
0 0.1 0.2 0.3 0.4 0.5 0.6
Power (W/cm2)
5 10 15
E3 E2 E1
[image:13.596.145.452.235.445.2]Pressure (Psi) Assembly
Figure 13. Maximal power generated by PEMFC assembly type as pressure function.
4. CONCLUSIONS
The PEMFC performance is clearly affected by the structural nature and physical characteristics (as pore diameter, geometry channels, electrical conductivity, etc) of materials used as main elements during operation. These effects can be combined with the ordinary effects as operative conditions (Pressure, Flow, Temperature, etc), showing significant double and triple effects on the tension and electrical power delivered by the PEMFC. An optimal selection on the main materials to be apply in fuel cell, could impact the functionality of the fuel cell to allow higher current densities, however, the identification of optimum materials and condition for maximum performance in the PEMFC is undoubtedly a complex task.
ACKNOWLEDGEMENTS
References
1. Kordesch K., G. Simader, Fuels Cells and Their Applications, Ed. VCH (1996). 2. Costamagna P., Srinivasan S., J. of Power Sources 102 (2001)242.
3. Lawton R Bash JF Barnett SM, Marine applications of fuel cells, Oceans/´02 MTS/ IEEET 3(2002)1784.
4. Tae-Young Oh and Seok-Lyong Song, 1rst International Forum on Strategic Technology (2006)209.
5. Jarvis L. P; Cygan P. J; Roberts M. P, IEEE Aerospace Electronic Systems Magazine, 18(2003)13. 6. Ebesui A. M; Boccuzzi C. V; Ett. G; Janolio, G; Saiki G. Y.; Jardini J.A; Ellem M; Ett V.,
Transmission and Distribution Conferences and Exposition Latin America IEEE /PES (2004) 605. 7. Fuell Cell Hanbook. EG&G Services, Parsons Inc. 5th Edition, USA, 2000
8. S. Bagotzky, N. V. Osetrova and A. M. Skundin. Russian Journal of Electrochemistry, V.39, No. 9 (2003) 919
9. www.energias-renovables.com (Site Consulted in March 2010)
10.www.diariomotor.com (Site Consulted in April 2010)
11.
www.ecoticias.com/.../medio-ambiente-definicion-noticias-contaminacion-cambio-climatico-calentamiento-global-ecologia-ecosistema... (Site Consulted in September 2009)
12.C. Moisés Bautista-Rodríguez, Araceli Rosas-Paleta, Andrés Rodríguez-Castellanos, J. Antonio Rivera-Márquez, Omar Solorza-Feria, J. Antonio Guevara-Garcia, J. Ignacio Castillo-Velázquez. Int. J. of Electrochemical Science, 2 (2007) 820
13.www.etek-inc.com. E-TEK Div. of De Nora N.A., Fuel Cell Markets. (Site consulted in 2009-2010)
14.P. Costamagna, S. Srinivasan. Journal of Power Sources, 102 (2001) 253
15.Ch. S. Kong, D-Y Kim, H-K Lee, Y-G Shul, T-H Lee. Journal of Power Sources, 4725 (2002) 1 16.C. Boyer, S. Gamburzev and A. J. Appleby. Journal of Applied Electrochemistry, 29 (1999) 1095 17.K-H Choi, D-H Peck, Ch. S. Kim, D-R Shin, T-H Lee. Journal of Power Sources, 86 (2000) 197 18.J. J. Baschuk, Xianguo Li. Journal of Power Sources, 86 (2000) 181
19.V. A. Paganin, E. A. Ticianelli, E. R. Gonzalez. Journal of Power Sources, 70 (1998) 55
20.D. R. Sena, E.A. Ticianelli, V.A. Paganin, E. R. Gonzalez. Journal of Electroanalytical Chemistry, 477 (1999) 164
21.S. A. Grigor’ev. Rusian Journal of Elecrochemistry, V 40, 11 (2004) 1188 22.Zhigang Qi. Journal of Power Sources, 109 (2002) 469
23.S. Dutta, S. Shimpale and J. W. Van Zee. Journal of Applied Electrochemistry, 30 (2000) 135 24.Sandip Dutta, Srivatch Shimpale, J. W. Van Zee. International Journal of Heat and Mass Transfer,
44 (2001) 2029
25.Bultel Y., Ozil P. and Durand R. Journal of Applied Electrochemistry 29 (1999) 1025 26.Uwe Beuscher. Journal of the Electrochemical Society, 153, 9 (2006) A1788
27.C. Moisés Bautista-Rodríguez, Araceli Rosas-Paleta, J. Antonio Rivera-Márquez, J. Roberto García de la Vega. International Journal of Electrochemical Science 4 (2009) 1754.
28.K. Suárez Alcántara, O. Solorza Feria. Journal of Power Sources 192 (2009) 165
29.C. Moisés Bautista-Rodríguez, Araceli Rosas-Paleta, J. Antonio Rivera-Márquez, J. Roberto García de la Vega. International Journal of Electrochemical Science 5 (2010) 414.