This is a repository copy of Membrane defouling using microbubbles generated by fluidic oscillation.
White Rose Research Online URL for this paper: http://eprints.whiterose.ac.uk/134464/
Version: Accepted Version
Article:
Harun, M.H.C. and Zimmerman, W.B. (2018) Membrane defouling using microbubbles generated by fluidic oscillation. Water Science and Technology: Water Supply. ws2018056. ISSN 1606-9749
https://doi.org/10.2166/ws.2018.056
[email protected] https://eprints.whiterose.ac.uk/
Reuse
Items deposited in White Rose Research Online are protected by copyright, with all rights reserved unless indicated otherwise. They may be downloaded and/or printed for private study, or other acts as permitted by national copyright laws. The publisher or other rights holders may allow further reproduction and re-use of the full text version. This is indicated by the licence information on the White Rose Research Online record for the item.
Takedown
If you consider content in White Rose Research Online to be in breach of UK law, please notify us by
Membrane Defouling Using Microbubble Generated by
Fluidic Oscillation
M. H. C. Haruna, William B. Zimmermanb
a,bDepartment of Chemical and Biological Engineering, University of Sheffield, S1 3JD, United
Kingdom.
aSchool of Ocean Engineering, Universiti Malaysia Terengganu, 21030 Kuala Terengganu, Terengganu
Malaysia.
(Email: [email protected], [email protected]b)
Abstract
Impurities and colloidal substances are two of many fouling conditions that reduce the membrane filtration performance used in wastewater treatment. This study investigates the potential of fluidic oscillation generated microbubbles (MBs) to defoul the filtration membrane. Cartridge filters of microfiltration (MF) of 1µm pore size were fouled using surface seawater collected from the Hull coastal area. The seawater was circulated at 5.8L/min to actuate colloidal substance deposition on the membrane surface. The recorded feed channel pressure drop ( P) across the membrane filters shown rapid fouling occurred in the first 8 hrs of the circulation. Fluctuations of P during the next 8hrs were observed showing the colloids filling the pores of the membrane, remaining steady for two hours showing membrane was completely fouled. The filtration membrane was cleaned and defouled using fluidic oscillator generated MBs. The fouled membranes were sparged with 1L/min of air scouring for ~1 to ~2hrs to remove the deposited colloids and impurities on the surface of the membrane. The membrane, analysed under Scanning Electron Microscopy (SEM), UV254 and EC meter, shows the extent of MBs
mediated removal of the deposited colloidal particle from the membrane surfaces. This study found that the highest defouling rate occurs with MBs generated by fluidic oscillator (closed vent), followed by MBs generated by fluidic oscillator (opened vent) and MBs generated without fluidic oscillator are0.00953, 0.00622, and 0.00341 bar/min, respectively.
Keywords: Microbubble, Defouling, Membrane
INTRODUCTION
generated to assist and compare with the conventional bubble cleaning method to restore membrane performance. MF membrane used as pre-treatment for desalination usually have shorter filter lifetimes due to fouling (Baker, 2004). This research mainly to exploit the advantage of using a cheaper way of producing smaller microbubbles in cleaning MF membrane (Zimmerman et al., 2011). Using MB cleaning, the performance of filtration membrane has been developed positively by prolong the membrane life and alleviating energy consumption (Wibisono et al., 2015; Fazel et al., 2013). Environmentally, this research will significantly bring the food and chemical industries towards green waste management by reducing the waste production and replacement of chemical cleaning agents (Stephen P Chesters et al., 2013; Mercier-Bonin et al., 2004).
Membrane fouling and defouling
Fouling usually caused by the deposition of small colloidal particles on the inner walls of membrane pores. The blockages are a build-up of particles in the form of a cake layer on the membrane surface and membrane pore opening. The effect of permeation flux reduction due to fouling is twofold. First, pore blocking and cake formation lead to the increase in flow resistance. After that, the presence of colloidal particles deposited on the membrane surface hampers liquid mixing. Thus, a relatively high concentration of solutes persists near the membrane surface which causes the reduction of the solvent flux crossing the membrane (Henry et al., 2012).
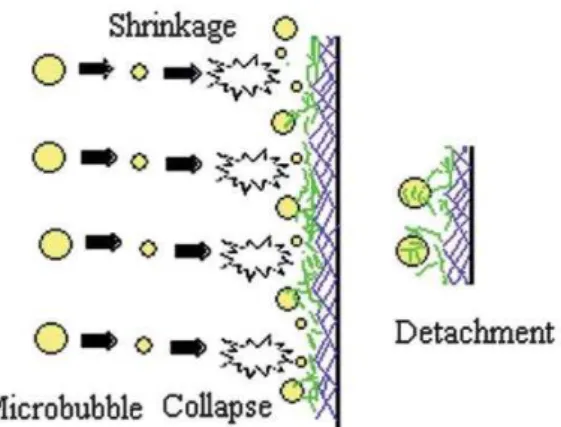
Figure 1: Schematic illustration of biofilm detachment by collapsing MBs (Agarwal et al., 2012)
The potential of microbubbles for removing the biofilm depends on the internal pressure of the bubble. As governed by the Young-Laplace equation for spherical microbubbles (Eq.1), the internal pressure of the bubble depends on the diameter of the bubble. The smaller the diameter of the bubble lead to the higher internal pressure and subsequently bubble collapse resulted in higher energy. High energy generated allows more detachment of the biofilm and the cleaning efficiency. Fig. 1 above illustrates the pressure waves are distributed over the domain of the self-collapsing bubbles eventually dispel the fixed biomass from the membrane surface. The detachment of the biofilm is further simplified in Fig.2 below.
(Eq. 1)
P: Gas Pressure PL: Liquid Pressure
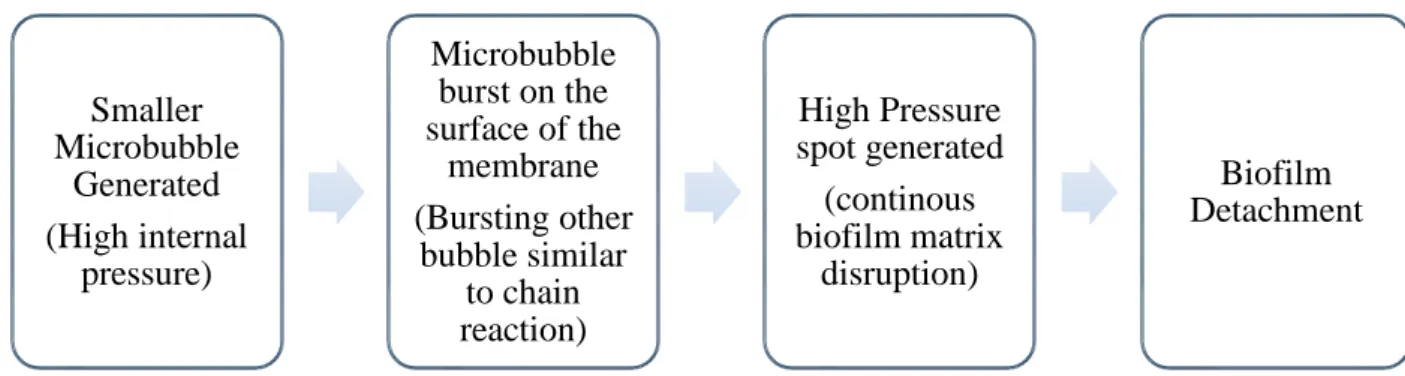
Figure 2: Simplified biofilm detachment using microbubble
Fluidic Oscillator Microbubble Defouling
The mechanisms of using MBs to defoul filtration membrane exemplified in Fig.1 and 2 show great potential in utilizing MBs to controlling and preventing membrane fouling. Lu et al., (2008) concluded that higher gas flowrate and smaller bubble sparging limit fouling better on hollow fibre MF membranes. MBs applied to MF membrane successfully enhance membrane performance by reducing TMP more effectively, enhance the critical flux, and induce lighter cake formation (Hwang & Wu, 2009; Lu et al., 2008; Yu et al., 2003). Lee et al., (2014) found that MBs are able to adhere to particulates and colloidal matters, thus causing them to float, disrupt the gel layer, and provide pyrolytic decomposition of protein.
Zimmerman & Tesar, (2010) patented a method of producing smaller microbubble using fluidic oscillator. This device acts as amplifier by oscillating the gas passing through. Zimmerman, (2014), listed several application of using smaller bubble generated by fluidic oscillator to strip components of liquid such as gas transfer in bioreactors, anaerobic digesters, and particle separation. Various applications of fluidic oscillator generated microbubble have been studied-- better oil emulsion separation (Hanotu et al., 2013), higher separation efficiency via microbubble distillation (Al-yaqoobi et al., 2016), better algal growth (Kamaroddin et al., 2016), and efficient yeast recovery (Hanotu et al., 2014).
In this paper, the study of defouling will be conducted using MBs generated by fluidic oscillation. A fluidic oscillator connected to the diffuser as shown in Fig. 3 is able to produce smaller bubble size (Hanotu et al., 2013). Instead of relying on the structure of porous material for the nozzles to generate smaller bubble, fluidic oscillations divert the jet overcoming the coanda effect to enable the pinch off of the hemispherical cap of bubble formation, resulting in nearly mono-dispersed, uniformly released microbubbles (Zimmerman et al., 2008). This device has no moving parts and is able to produce smaller microbubble at higher energy efficiency (Tesar, 2014).
Smaller Microbubble
Generated (High internal
pressure)
Microbubble burst on the surface of the
membrane (Bursting other
bubble similar to chain reaction)
High Pressure spot generated
(continous biofilm matrix
disruption)
MATERIALS AND METHODS
Experimental design and setup
In this study, two main phase of experiment were conducted.
I. Membrane fouling by circulating the seawater – mainly increase in pressure drop II. Microbubble sparging for membrane defouling – optimised membrane performance
Microfiltration membrane defouling
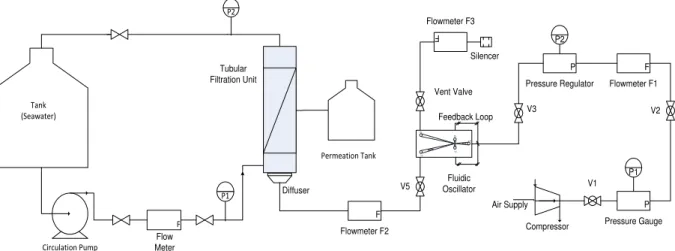
F Flowmeter F1 V2 V1 V5 Vent Valve ST X1 X2 Y1 Y2 F Flowmeter F2 F Flowmeter F3 P Pressure Gauge P Pressure Regulator Compressor V3 P1 P2 Air Supply Diffuser Fluidic Oscillator Silencer Feedback Loop Circulation Pump Tank (Seawater) F P1 P2 Tubular Filtration Unit Flow Meter Permeation Tank
Figure 3: Schematic configuration of the membrane defouling system
The filtration system was developed to remove colloidal substances from surface seawater and circulated at 5.4-5.8L/min. Filtration housing is fitted to a 10inch tubular MF membrane as shown in Table 1. Pressure drop of the filtration system recorded every 1 minutes. A flowmeter and pressure transducers (P1 and P2) are connected and recorded using an Arduino Data Logger. For the experimental start-up, the tubular unit was circulated with tap water for 24hr to allow soaking process and pressure to balance before being fed with seawater. 5ml of the effluent sample is collected at one minute intervals from the beginning and with every imposed pressure drop level. One tubular unit runs for 3 days. Once the pressure drop is constantly above 1.4bar, the system was sparged with microbubbles from air scouring unit. The air scouring unit consist of a control box (pressure regulator, valve, pressure gauge) were connected to the fluidic oscillator and diffuser. Air flow rate injected approximately 1L/min using alumina diffuser produces 100-1000µm size of microbubble to defoul the filtration membrane. The fluidic oscillator was operated with feedback loop length of 50mm. MBs sparged the membrane and membrane sample are analysed by SEM.
Main membrane characteristics, pore sizes, and composition
Table 1 presents the information of the main membrane characteristics. Microfiltration membrane (MF) of 1micron pore size operated using crossflow configuration at room temperature during summer time. Seawater fed to the membrane are filtered specifically for the impurities and colloidal contained.
Seawater and membrane sources
Seawater was collected from the East Riding of Yorkshire, England at Spurn and stored at room temperature (21±4oC) prior to all test. UV254, and pH of the seawater were at 0.034cm-1,
Table 1. Main membrane characteristics and operating conditions
Properties
Type Sediment cartridge filter
Material propylene
Micron rating 1micron
Cartridge dimension ID:30mm; OD:65mm; L: 255mm
Flow type Inside-out
Membrane configuration Tubular
Membrane System Setup Cross-Flow
Temperature Room ~22.7-25.1(oC)
Pressure initiation 2bar
Fluidic Oscillator
ST X1
X2
Y1
Y2
B A
Air Supply
Feedback Loop
Exit Nozzles
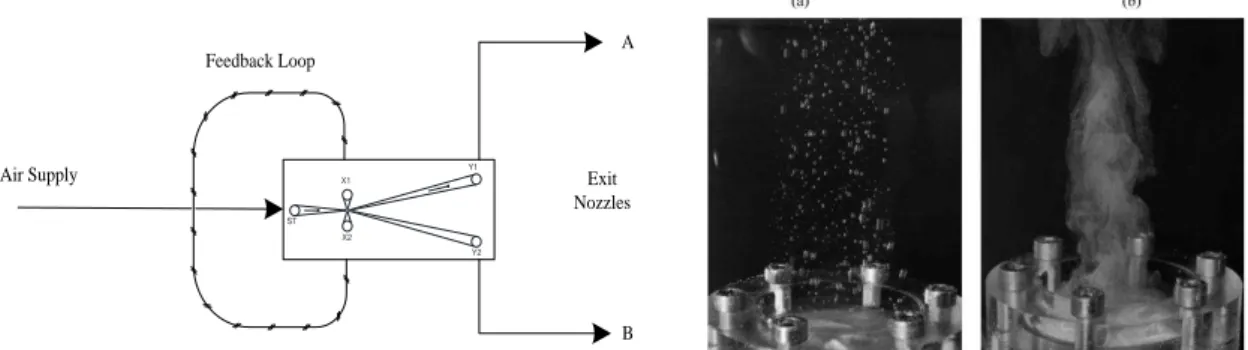
Figure 4: Fluidic oscillator schematic with images of bubbles (a) coalescent and non-uniform bubble without fluidic oscillator (b) Uniform size and non-coalescent bubbles with fluidic
oscillator (Hanotu, 2013)
MBs operating conditions
MBs were generated using the scouring unit which is connected through the alumina diffuser at the bottom of the filtration housing. The air was injected through the diffuser at flow rate and pressure of 1 l/min and 2.2bar respectively. The bubble size generated are in the range of 100-1000micron. The following MBs conditions were generated:
I. 1L/min of flow with slightly open vent valve II. 1L/min of flow with fully closed vent valve III. Non-fluidic oscillator generated microbubbles
Data Collection and Measurement
Arduino Pressure Transducer and flowmeter
Two pressure transducers were installed at the inlet, P1 and outlet, P2 to measure the pressure drop while the flowmeter connected after the circulation pump. The analogue reading for both of this instruments are connected to Arduino Uno data logger. The data were collected at 1minute intervals using the PLX-DAQ excel sheet.
Nutrition Controller
Continuous monitoring of the pH value, Total Dissolve Solids, TDS (EC) and temperature of the feed were inferred using the Continuous Monitor Hydroponics trimeter. The sensors were placed in the feed tank. The nutrition controller collected the pH value, TDS and temperature of the system. The sample was collected and analysed using spectrophotometer.
UV/Vis and SEM
The UV absorbance of the water was measured at 254nm using UV/Vis spectrophotometer (Jenway 6705). At the beginning of the experiment, during microbubble sparging, and if there were fluctuations of P2, UV absorbance were tested at the intervals of 1 minute for twenty minutes. With steady pressure drop, the absorbance measured in the interval of 30mins to 1hr. The surface of the membranes after the experiment was dried at 50oC for one night and coated using gold. The gold coated membrane surface was examined for the colloidal deposition and removal under the Scanning Electron Microscope (SEM).
RESULTS AND DISCUSSIONS
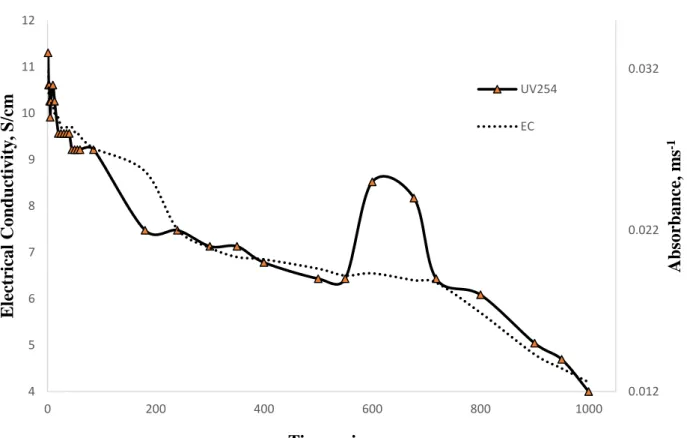
Effect of microbubble on fluid properties
Figure 5: UV254 and EC value
Overall fluidic oscillator generated microbubble cleaning
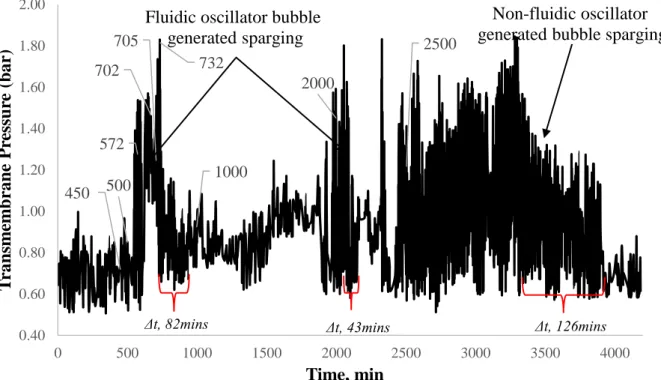
Pressure is the main probe for examining the properties and results of this study. Increasing in transmembrane pressure drop (TMP) means that the filter is continuing filtering the impurities from the seawater and particles were deposited on the surface of the membrane. In this study, the microbubbles were introduced at the 600th minute to remove the deposited particles from the surface of the membrane.
Fluctuations in Fig. 6 shows the following experimental configuration in order.
I. Slightly open vent valve: Better TMP reduction II. Fully closed vent valve: Best TMP reduction
III.Non-fluidic oscillator generated MBs: Slowest TMP reduction
0 200 400 600 800 1000
4 5 6 7 8 9 10 11 12
0.012 0.022 0.032
E
lec
tr
ical
Cond
u
ctivity
,
S
/cm
Time, min
Abso
rb
an
ce
, m
s
-1
UV254
Figure 6: Membrane fouling and defouling with and without fluidic oscillator generated microbubble
Fluidic oscillator defouling with vent valve
Fig. 6 shows the pressure drop recorded for each 1minute interval for the whole filtration cycle of 72hrs (3days). The difference between the inlet and outlet pressure gives the transmembrane pressure (TMP) across the membranes. At the 450th minute, the pressure transducer recorded small fluctuations of pressure which heralds that impurities started to deposit and filling the membrane surfaces and pores. Rapid fouling was observed from 500min to 572min and starts to record a constant pressure drop until minute 702. The TMP fluctuates at minute 732 showing the pressure fluctuations due to pressure release from diffuser once microbubbles were introduced at 705min. This preliminary data showing the positive relationship between the bubbles and cleaning due to shear forces, drag forces, and strong velocity fluctuations induced by the bubble flow (Nagaoka et al., 2006).
After the sparging processes were stopped, the TMP started to increase. At 2000 minutes, a similar trend of the fouling was observed for which the TMP remains constant showing the fouling reaching saturation. Fluidic oscillator generated MBs once again are introduced with zero vent flow to the system. This resulted in higher defouling rate; where the bubbles possess sufficient or higher shear and drag force to detach the deposited particles. Higher TMP is also recorded after 1000 and 2500 minutes showing the MBs defouling were not able to restore the performance of the membrane to its initial conditions. The slowest defouling rate was recorded as non-fluidic oscillator generated MBs were sparged to the system as shown in Fig.6. It requires approximately 125minutes to reduce the pressure drop before it was fouled. The data shows that MBs generated by fluidic oscillator without vent valve flow has the highest efficiency of the defouling followed by the MBs generated by fluidic oscillator with vent valve and MBs generated without fluidic oscillator. The defouling assumption was in line with the dissolve particles as shown in Fig. 5 where the fluid quality was improved over the time. This
450 500
572 702
705
732
1000
2000
2500
0.40 0.60 0.80 1.00 1.20 1.40 1.60 1.80 2.00
0 500 1000 1500 2000 2500 3000 3500 4000
T
ransm
em
brane
P
re
ssu
re
(
bar)
Time, min
Fluidic oscillator bubble generated sparging
Non-fluidic oscillator generated bubble sparging
means that most of the particles were filling the pores and MBs sparging creates additional forces for better defouling.
Fluidic oscillator and defouling rate
The highest TMP for each defouling were recorded at the time elapsed. Three defouling methods were applied, where the highest recorded defouling rate achieved by using fluidic oscillator (closed vent valve) at 0.00953bar/min followed by fluidic oscillator (open vent valve) at 0.00622bar/min and lowest defouling rate without fluidic oscillator at 0.00341bar/min. Assumed to have more flows with more shear and drag force, the MBs generated with fully closed vent valve by the fluidic oscillator has the highest defouling rate of 0.00953bar/min. MBs generated with flow in the vent valve by fluidic oscillator showing half of the defouling rate followed by the non-fluidic oscillator generated MBs and it is agreed by Lee et al., (2014). Wu, He, & Zhang, (2012) explained the limitation of larger size bubble on fouling control for the deposition of small particles.
Generally, the most efficient MF defouling is achieved by scouring the MF under fluidic oscillator generated MBs. This finding shows that fluidic oscillator generates smaller MBs. This results in higher efficiency of cleaning effect to scrub the colloids and impurities deposited on the surface of the MF (Lee et al., 2014; Wibisono, 2014). Zimmerman, (2014) explains the MBs generated by fluidic oscillations would inhibit repulsion between bubbles and particles for better particle separations which is also in agreement with the study conducted by Hiroyuki et al., (2015) and Agarwal, Ng, & Liu, (2011). This, however, leads to a different finding of using the fluidic oscillator towards the cleaning effect. The highest defouling observed while using oscillator without flow of air in vent valve. The basic inference from this is because more flow of air to the diffuser results in more bubbles generated compared to the oscillator with open vent valve. Manipulation of oscillator frequency by changing feedback loop length and bleeding flowrate is crucial to ensure smaller bubble generation (Brittle et al., 2015; Zimmerman et al., 2008) Fig. 4 illustrates the characteristics and function of the fluidic oscillator which need to be further investigated.
Colloids deposition and its removal - Scanning Electron Microscopy (SEM)
Figure 7(a) SEM images for the fouled and 7(b) defouled membrane
Fig. 7(a) shows SEM images of the colloids deposited on the surface of the MF membrane. Because of MF has large pores, the filtration process will basically remove large size molecules
Colloids deposited on the surface of the fouled membrane
Remaining colloids after microbubble defouling/sparging Colloids resulted from
such as colloids. However, some salt particles might be also present due to the process of drying prior to SEM analysis. Fig. 7(b) shows the defouled membrane filter membrane after MB scouring. It can be clearly seen that MBs generated by fluid oscillation scrubbed all of the impurities from the surface of the membrane. Nevertheless, not all of the impurities were removed. The result obtained is similar to the ones conducted by Gwenaelle et al., (2017) where not 100% impurities will be removed by MBs. It has also been suggested that combining MBs with other chemicals such as coagulant may help in improving the rate of impurities eliminated by MBs. The image however only showing the removal of the impurities by final sparging process (after 72hrs).
CONCLUSIONS
The MBs are able to increase the effectiveness of membrane cleaning and defouling. The fluidic oscillator generated MBs resulted in higher defouling efficiency of filtration membrane. The TMPs recorded able to distinguish the relationship of fluidic oscillator and defouling rate. This, however, does not reflect the relationship of the fluidic oscillator and MBs properties towards defouling mechanisms without figurative data. Thus the following future works are very important to test all the hypotheses inferred from this study.
Future works
General assumptions and preliminary relationship between fluidic oscillator and defouling were made as the membranes were defouled more rapidly with fluidic oscillations. This, however, requires further data measurement and analysis to distinguish a figurative relationship below.
I. Installation of the bleeding valve to the fluidic oscillator outlet (system inlet). II. Bleeding valve flow rate to determine relationship between the flow rate of air and
defouling.
III. The oscillation frequency of the fluidic oscillator towards a better fouling and defouling.
IV. Microbubble size distribution at different oscillation frequency.
ACKNOWLEDGEMENT
C. Harun would like to thanks the Ministry of Higher Education (MOHE) Malaysia for financial support. We wish to thanks, Dr. Pratik D Desai and Dr Michael Hines for discussions and technical support. Many thanks to Mr Elliott Gunard and Mr Andrew G Patrick for helping me to design and fabricate the defouling rig. This research was supported by Engineering and Physical Sciences Research Council (EPSRC) by a grant number EP/I019790/1.
REFERENCES
62(504), 1192–1199.
Agarwal, A., Ng, W. J. & Liu, Y. (2011). Principle and Applications of Microbubble and Nanobubble Technology for Water Treatment. Chemosphere, 84(9), 1175–1180. Retrieved from http://dx.doi.org/10.1016/j.chemosphere.2011.05.054
Agarwal, A., Xu, H., Ng, W. J. & Liu, Y. (2012). Biofilm Detachment by Self-Collapsing Air Microbubbles: A Potential Chemical-Free Cleaning Technology for Membrane
Biofouling. Journal of Materials Chemistry, 22(5), 2203–2207. Retrieved from
http://apps.webofknowledge.com/full_record.do?product=UA&search_mode=GeneralSe arch&qid=1&SID=3Ea3L18I4b73DKAn9GO&page=2&doc=16
Al-yaqoobi, A., Hogg, D. & Zimmerman, W. B. (2016). Microbubble Distillation for Ethanol-Water Separation. International Journal of Chemical Engineering, 2016.
Baker, R. (2004). Membrane Technology and Applications.
Bhattacharya, P., Roy, A., Sarkar, S., Ghosh, S., Majumdar, S., Chakraborty, S., et al. (2013). Combination Technology of Ceramic Microfiltration and Reverse Osmosis for Tannery Wastewater Recovery. Water Resources and Industry, 3, 48–62.
Brittle, S., Desai, P., Choon, W., Dunbar, A., Howell, R., Tesar, V., et al. (2015). Chemical Engineering Research and Design Minimising Microbubble Size through Oscillation Frequency Control. Chemical Engineering Research and Design, 4, 357–366.
Chesters, S. P., Armstrong, M. W. & Fazel, M. (2013). Cleaning Biofouled Membranes Early Improves Plant Operation. Comparison of Autopsy and Cleaning Results on a Small BWRO and Large SWRO. AMTA/AWWA Membrane Technology Conference and Exposition 2013, 717–727. Retrieved from
http://www.scopus.com/inward/record.url?eid=2-s2.0-84890377388&partnerID=tZOtx3y1
Chesters, S. P., Armstrong, M. W., Fazel, M., Wilson, R. & Golding, D. A. (2013). RO Membrane Cleaning, Past, Present, Future – Innovations for Improving Ro Plant Operating Efficiency. The International Desalination Association World Congress on Desalination and Water Reuse.
Fazel, M., Wilson, R., Darton, T., Eckersley, J. & Chesters, S. (2013). Safe Use of Microbubbles for Removal of Ro Membrane, in: The International Desalination Association World Congress on Desalination and Water Reuse 2013, (p. 18). Tianjin: The International Desalination Association.
Galanakis, C. M., Markouli, E. & Gekas, V. (2013). Recovery and Fractionation of Different Phenolic Classes from Winery Sludge Using Ultrafiltration. Separation and Purification Technology, 107, 245–251.
Giacobbo, A., Do Prado, J. M., Meneguzzi, A., Bernardes, A. M. & De Pinho, M. N. (2015). Microfiltration for the Recovery of Polyphenols from Winery Effluents. Separation and Purification Technology, 143, 12–18.
153–160. Retrieved from http://dx.doi.org/10.1016/j.desal.2016.06.012
Hanotu, J., Bandulasena, H. C. H., Chiu, T. Y. & Zimmerman, W. B. (2013). Oil Emulsion Separation with Fluidic Oscillator Generated Microbubbles. International Journal of Multiphase Flow, 56, 119–125. Retrieved from
http://dx.doi.org/10.1016/j.ijmultiphaseflow.2013.05.012
Hanotu, J., Karunakaran, E., Bandulasena, H., Biggs, C. & Zimmerman, W. B. (2014). Harvesting and Dewatering Yeast by Microflotation. Biochemical Engineering Journal, 82, 174–182. Retrieved from http://dx.doi.org/10.1016/j.bej.2013.10.019
Hanotu, J. O. (2013). Development of a Fluidic Oscillator-Driven Flotation System. , (January).
Henry, C., Minier, J. P. & Lefevre, G. (2012). Towards a Description of Particulate Fouling: From Single Particle Deposition to Clogging. Advances in Colloid and Interface Science, 185–186, 34–76. Retrieved from http://dx.doi.org/10.1016/j.cis.2012.10.001
Hiroyuki, A., Kenji, A., Masato, F., Matsuura, K., Ogawa, S., Kasaki, S., et al. (2015). Cleaning Polymer Ink from a Glass Substrate Using Microbubbles Generated by a Hydrogen Bubble Method. Separation and Purification Technology, 142, 242–250. Retrieved from http://dx.doi.org/10.1016/j.seppur.2015.01.009
Hwang, K.-J. & Wu, S.-F. (2009). Effects of Air-Sparging on the Filtration Flux and Cake Properties in Cross-Flow Microfiltration of Size-Distributed Fine Particles. Separation Science and Technology, 44(15), 3485–3505. Retrieved from
http://www.tandfonline.com/doi/abs/10.1080/01496390903183345
Kamaroddin, M. F., Hanotu, J., Gilmour, D. J. & Zimmerman, W. B. (2016). In-Situ
Disinfection and a New Downstream Processing Scheme from Algal Harvesting to Lipid Extraction Using Ozone-Rich Microbubbles for Biofuel Production. Algal Research, 17, 217–226. Retrieved from
http://linkinghub.elsevier.com/retrieve/pii/S221192641630162X
Lee, E.-J., Kim, Y.-H., Kim, H.-S. & Jang, A. (2014). Influence of Microbubble in Physical Cleaning of MF Membrane Process for Wastewater Reuse. Environmental Science and Pollution Research, 22(11), 8451–8459. Retrieved from
http://link.springer.com/10.1007/s11356-014-3928-y
Lee, J.-E. & Lee, J.-K. (2002). Effect of Microbubbles and Particle Size on the Particle Collection in the Column Flotation. Korean Journal of Chemical Engineering, 19(4), 703–710. Retrieved from http://link.springer.com/10.1007/BF02699321
Lu, Y., Ding, Z., Liu, L., Wang, Z. & Ma, R. (2008). The Influence of Bubble Characteristics on the Performance of Submerged Hollow Fiber Membrane Module Used in
Microfiltration. Separation and Purification Technology, 61(1), 89–95.
Mercier-Bonin, M., Fonade, C. & Gésan-Guiziou, G. (2004). Application of Gas/liquid Two-Phase Flows during Crossflow Microfiltration of Skimmed Milk under Constant Flux Conditions. Chemical Engineering Science, 59(11), 2333–2341.
Velocity on Drag-Force and Shear Stress Working on Submerged Hollow Fibre Membrane. Water Science and Technology, 54(10), 185–192.
Tesar, V. (2014). Mechanisms of Fluidic Microbubble Generation Part II: Suppressing the Conjunctions. Chemical Engineering Science, 116, 849–856.
Tesa , V. (2014). Microbubble Generator Excited by Fluidic Oscillator’s Third Harmonic Frequency. Chemical Engineering Research and Design, 92(9), 1603–1615.
Wibisono, Y. (2014). Two-Phase Flow for Fouling Control in Membranes. Igarss 2014, (1).
Wibisono, Y., El Obied, K. E., Cornelissen, E. R., Kemperman, A. J. B. & Nijmeijer, K. (2015). Biofouling Removal in Spiral-Wound Nanofiltration Elements Using Two-Phase Flow Cleaning. Journal of Membrane Science, 475, 131–146.
Wilson, R., Fazel, M., Jarrige, S., Chesters, S. & Wilson, R. (2013). Air Bubbles Enhance Membrane Cleaning: A Future Perspective. The International Desalination Association World Congress on Desalination and Water Reuse 2013, 13, 18.
Wu, J., He, C. & Zhang, Y. (2012). Modeling Membrane Fouling in a Submerged Membrane Bioreactor by Considering the Role of Solid, Colloidal and Soluble Components.
Journal of Membrane Science, 397–398, 102–111. Retrieved from http://dx.doi.org/10.1016/j.memsci.2012.01.026
Yu, K., Wen, X., Bu, Q. & Xia, H. (2003). Critical Flux Enhancements with Air Sparging in Axial Hollow Fibers Cross-Flow Microfiltration of Biologically Treated Wastewater. Journal of Membrane Science, 224(1–2), 69–79.
Zhao, D. & Yu, S. (2014). A Review of Recent Advance in Fouling Mitigation of NF/RO Membranes in Water Treatment: Pretreatment, Membrane Modification, and Chemical Cleaning. Desalination and Water Treatment, (July), 1–22. Retrieved from
http://www.tandfonline.com/doi/abs/10.1080/19443994.2014.928804
Zimmerman, W. B., Hewakandamby, B. N., Tesar, V., Bandulasena, H. C. H. & Omotowa, O. A. (2009). On the Design and Simulation of an Airlift Loop Bioreactor with
Microbubble Generation by Fluidic Oscillation. Food and Bioproducts Processing, 87(3), 215–227.
Zimmerman, W. B. J. (2014). Bubble Generation to Strip Components of a Liquid.
Zimmerman, W. B. J. & Tesar, V. (2010). Bubble Generation for Aeration and Other Purposes. , 1(19).
Zimmerman, W. B., Tesar, V. & Bandulasena, H. C. H. (2011). Towards Energy Efficient Nanobubble Generation with Fluidic Oscillation. Current Opinion in Colloid and Interface Science, 16(4), 350–356.
Zimmerman, W. B., Tesar, V., Butler, S. & Bandulasena, H. H. (2008). Microbubble Generation. Recent Patents on Engineering, 2(1), 1–8. Retrieved from