
The Significance of Bromide in the Brust-Schiffrin
Synthesis of Thiol Protected Gold Nanoparticles
Samuel G. Booth,a Akihiro Uehara,b,* Sin Yuen Chang,c Camille La Fontaine,d Toshiyuki Fujii,e Yoshihiro Okamoto,f Takahito Imai,g Sven L. M. Schroeder,c, h and Robert A. W. Dryfea,*
a School of Chemistry, University of Manchester, Manchester, M13 9PL, UK
b Division of Nuclear Engineering Science, Research Reactor Institute, Kyoto University, Kumatori, Sennan, Osaka, 590-0494, Japan
c Diamond Light Source Ltd., Didcot, Oxfordshire OX11 0DE, UK
d Synchrotron Soleil, L'Orme des Merisiers, Saint-Aubin, BP48, 91192, Gif-sur-Yvette, France
e Division of Sustainable Energy and Environmental Engineering, Graduate School of Engineering, Osaka University, Suita, Osaka, 565-0871,
Japan
f Materials Sciences Research Center, Japan Atomic Energy Agency, 2-4, Shirakata, Tokai, Naka, Ibaraki, 319-1195, Japan
g Department of Materials Chemistry, Faculty of Science and Technology, Ryukoku University, Otsu, Shiga 520-2194, Japan
h School of Chemical and Process Engineering, University of Leeds, Leeds LS2 9JT, UK
Supporting Information
Halide ion exchange between the phase transfer catalyst TOABr and the gold species
[AuCl
4]ˉ
The addition of TOABr in either a single organic phase or in a 2 phase system shows the exchange of Clˉ for Brˉ resulting in the formation of a mixed halide gold species. The full fitting for the EXAFS parameters used to describe the data in Figure 2 is included in Table S1.
[AuBr4]ˉ [AuCl4]ˉ R-factor k3
weighted data
1 eq TOABr 0.41 +/- 0.022 0.59 +/- 0.022 0.0083 2 eq TOABr 0.54 +/- 0.023 0.46 +/- 0.023 0.0052 3 eq TOABr 0.66 +/- 0.039 0.34 +/- 0.039 0.0045 4 eq TOABr 0.75 +/- 0.019 0.25 +/- 0.019 0.0040 5 eq TOABr 0.77 +/- 0.054 0.23 +/- 0.054 0.0157 Pure [AuBr4]ˉ 1.00 +/- 0.000 0.00 +/- 0.000 0.0124
Table S1. Fitting parameters for each path in the EXAFS analysis of the addition of TOABr to [AuCl4]ˉ in a single phase (Figure 2).
To examine the electrochemical response, the voltammetry and half wave potentials for the heterogeneous reaction are shown in Figure S1. The measurements indicate a shift in the ion transfer potential upon interaction with a high concentration of TOABr. The response is the same for both the heterogeneous interaction as well as for the homogeneous interactions in an organic phase.
(a) (b)
Figure S1. Voltammetry at a micro-liquid/liquid interface following the interaction of (a) H+[AuCl4]ˉ with TOABr. The green curve corresponds to pure [AuBr4]ˉ and the black curve to
pure [AuCl4]ˉ. (b) Shift in half wave potential in the liquid/liquid voltammetry on increasing
[image:2.595.152.448.165.314.2] [image:2.595.75.495.465.651.2]The experimental conditions used to generate the above data and that in Figure 3 are included in Table S2. After shaking and phase separation, the DCE phase was used in the voltammetric measurements.
(a)
Aqueous Phase Organic Phase
0.2 mM HAuCl4 10mM HCl
0, 0.2, 0.4, 0.6, 0.8 or 1 mM TOABr 1 mM TOATFPB
(b)
Aqueous Phase Organic Phase
10mM HCl
0.2 mM TOA AuCl4
[image:3.595.55.459.105.252.2]0, 0.2, 0.4, 0.6, 0.8 or 1 mM TOABr 1 mM TOATFPB
Table S2. Experimental conditions used in the liquid/liquid electrochemical measurements following the interaction of [AuCl4]ˉ (a) at the liquid/liquid interface and (b) in a single organic phase.
Reduction of [AuBr
4]
ˉ
by 1-dodecanethiol
The addition of thiol to [AuBr4]ˉ was monitored by XAFS as described in the main paper. The EXAFS data
was fit using a combination of scattering paths to describe either the contribution from [AuBr4]ˉ or
[AuBr2]ˉ. The parameters determined through EXAFS fitting that contributed to the plots in Figure 5 a
and b are included below in Table S3.
[AuBr4]ˉ [AuBr2]ˉ R-factor k3
weighted data
Pure [AuBr4]ˉ 1.00 +/- 0.000 0.00 +/- 0.000 0.0304 0.4 eq Thiol 0.79 +/- 0.082 0.21 +/- 0.082 0.0238 1.0 eq Thiol 0.44 +/- 0.114 0.56 +/- 0.114 0.0156 2.0 eq Thiol 0.02 +/- 0.090 0.98 +/- 0.090 0.0049 10.0 eq Thiol 0.03 +/- 0.124 0.97 +/- 0.124 0.0231
[image:3.595.150.448.451.580.2]This interaction was also verified by electrochemistry, whereby the variation in Gibbs energy of transfer on reduction of [AuBr4]ˉ can be followed by voltammetry at the mirco-liquid/liquid interface. As there is
no increase in halide ion transfer, which would indicate the formation of Au(I)thiolate species, it is clear that the only reduction process is that of [AuBr4]ˉ forming [AuBr2]ˉ. In order to quantify the extent of
[image:4.595.196.404.155.305.2]exchange the [AuBr4]ˉ response is subtracted from the signals to show the contribution of [AuBr2]ˉ.
Figure S2 indicates the response due to [AuBr2]ˉ. The resultant extent of reduction is shown in Figure 6.
Figure S2. Peak current corresponding to [AuBr2]ˉ following subtraction of [AuBr4]ˉ species in
the cyclic voltammogram. The thiol and gold species were mixed for 30 minutes prior to measurement.
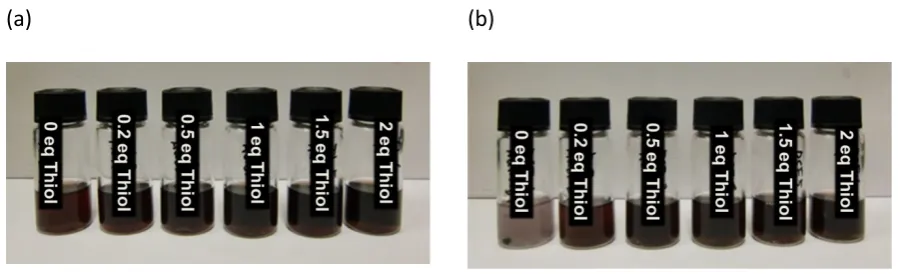
The progression of the reaction with different thiol concentrations can be seen by the clear loss of color in the organic phase on addition of excess thiol. [AuBr4]ˉ forms a dark orange solution whilst [AuBr2]ˉ is
colorless therefore the extent of the reduction can be seen in the solution formed in the intermediate step in the reduction protocol (Figure S3).
[image:4.595.72.525.438.571.2](a) (b)
Figure S3. Variation in solution appearance after 24 hours of reaction between [AuBr4]ˉ and
Reduction by BH
4ˉ
to form Au nanoparticles: influence of solvent
[image:5.595.190.404.234.381.2]Following the reduction process the formation of nanoparticles can be confirmed by UV-Vis spectroscopy. This is shown in the main paper for the reduction in toluene. The same reaction was repeated in DCE to compare the efficiency in the different solvents. The UV-Vis response clearly indicates that there is a lower yield of nanoparticles in DCE than toluene (Figure S4). In the absence of thiol there is almost no signal as the majority of the gold nanoparticles rapidly aggregate and sediment out of solution due to the absence of surface protecting groups.
Figure S4. UV-Vis absorbance of gold nanoparticles synthesized in DCE.
Significantly, the sample in the absence of thiol results in the formation of aggregated particles in DCE as would be expected. This is different to the observation in toluene where the nanoparticles are stabilized even in the absence of thiol (Figure S5). Even at high thiol:Au ratios (>3) nanoparticles are still synthesized in a good yield and form a stable suspension.
(a) (b)
[image:5.595.69.520.514.651.2]Reduction by BH
4ˉ to form Au nanoparticles influence of Au precursor species
The variation in deposition products formed using either [AuCl4]ˉ or [AuBr4]ˉ as the reaction precursor
was examined by TEM and UV-Vis spectroscopy. The reaction was performed using 1:1 and 3:1 thiol:Au ratios (1.5 mM to 0.5 mM) and NaBH4(aq) or TBABH4(DCE) as reported in the main paper. Figure S6 shows
the TEM micrographs of the particles formed at different thiol/Au ratios using [AuBr4]ˉ or [AuCl4]ˉ in the
reaction. As has been reported previously [15], [AuBr4]ˉ species tend to form slightly larger
nanoparticles than [AuCl4]ˉ. In both cases, a higher thiol to gold ratio produces smaller nanoparticles as
Figure S6. TEM micrographs of the gold nanoparticle products formed under conditions of (a) [AuBr4]ˉ with 0 eq thiol, (b) [AuBr4]ˉ and 1 eq thiol, (c) [AuCl4]ˉ and
1 eq thiol, (d) [AuBr4]ˉ and 3 eq thiol and (e) [AuCl4]ˉ and 3 eq thiol.
In the absence of thiol, the [AuBr4]ˉ produces a very low yield of large particles (5-6 nm). However, as
[image:7.595.127.469.49.561.2]Figure S7 indicates the variation in UV-Vis response for nanoparticles formed by the reduction of [AuCl4]ˉ and [AuBr4]ˉ (0.5 mM) by thiol (1.5 mM) and NaBH4(Aq) or TBABH4(DCE) (10 mM). The UV-Vis data
suggests that the particles are formed at a slightly higher concentration when using [AuBr4]ˉ as opposed
to [AuCl4]ˉ.
Figure S7. UV-Vis of the gold nanoparticles synthesized at different thiol/Au ratios using either (a) [AuCl4]ˉ or (b) [AuBr4]ˉ as the precursor species
The nanoparticles formed using organic phase BH4ˉ in a water free synthesis reaction (Figure 8) clearly
form a more uniform product at a higher yield (Figure S7) than those formed using NaBH4 in an aqueous
[image:8.595.137.470.126.316.2]The reactant conditions used in the original Brust-Schiffrin synthesis are included for reference (Table S4).
(a)
Aqueous Phase (30 mL)
Toluene (80 mL)
30 mM HAuCl4 50 mM TOABr
After Au phase transfer, the phases are separated and thiol is added to the toluene phase. The aqueous NaBH4 solution is then added.
(b)
Aqueous Phase (25 mL) Toluene (80 mL)
400 mM NaBH4 11.25 mM TOAAuCl4
39 mM TOABr (will react with [AuCl4]ˉ and BH4ˉ) 10 mM RSH
The side reactions that may occurs in the Brust-Schiffrin process at low TOABr concentration are provided schematically in Figure S8. This reaction occurs as a minor product even at low thiol concentration but then becomes the main reaction pathway at high thiol concentrations.
![Table S1. Fitting parameters for each path in the EXAFS analysis of the addition of TOABr to [AuCl4]ˉ in a single phase (Figure 2).](https://thumb-us.123doks.com/thumbv2/123dok_us/7732623.163136/2.595.75.495.465.651/table-fitting-parameters-exafs-analysis-addition-toabr-figure.webp)
![Table S2. Experimental conditions used in the liquid/liquid electrochemical measurements following the interaction of [AuCl4]ˉ (a) at the liquid/liquid interface and (b) in a single organic phase.](https://thumb-us.123doks.com/thumbv2/123dok_us/7732623.163136/3.595.150.448.451.580/experimental-conditions-electrochemical-measurements-following-interaction-interface-organic.webp)
![Figure S2 indicates the response due to [AuBr2]ˉ. The resultant extent of reduction is shown in Figure 6](https://thumb-us.123doks.com/thumbv2/123dok_us/7732623.163136/4.595.196.404.155.305/figure-indicates-response-aubr-resultant-extent-reduction-figure.webp)
![Figure S6. TEM micrographs of the gold nanoparticle products formed under conditions of (a) [AuBr4]ˉ with 0 eq thiol, (b) [AuBr4]ˉ and 1 eq thiol, (c) [AuCl4]ˉ and 1 eq thiol, (d) [AuBr4]ˉ and 3 eq thiol and (e) [AuCl4]ˉ and 3 eq thiol.](https://thumb-us.123doks.com/thumbv2/123dok_us/7732623.163136/7.595.127.469.49.561/figure-micrographs-nanoparticle-products-formed-conditions-aubr-thiol.webp)
![Figure S7 indicates the variation in UV-Vis response for nanoparticles formed by the reduction of [AuCl4]ˉ and [AuBr4]ˉ (0.5 mM) by thiol (1.5 mM) and NaBH4(Aq) or TBABH4(DCE) (10 mM)](https://thumb-us.123doks.com/thumbv2/123dok_us/7732623.163136/8.595.137.470.126.316/figure-indicates-variation-response-nanoparticles-formed-reduction-tbabh.webp)
![Figure S8. Schematic showing the side reaction that occurs on addition of thiol when [AuCl4]ˉ is the precursor gold species.](https://thumb-us.123doks.com/thumbv2/123dok_us/7732623.163136/10.595.191.419.134.351/figure-schematic-showing-reaction-occurs-addition-precursor-species.webp)
