MAPPING MILLENNIALS’ LIVING
STANDARDS
Maja Gustafsson
August 2019
resolutionfoundation.org/intergencentre @resfoundation
ACKNOWLEDGEMENTS
The author would like to thank the Nuffield Foundation for funding this work, and especially Alex Beer for her comments on an earlier draft. All errors, of course, remain the author’s own.
The Nuffield Foundation is an independent charitable trust with a mission to advance social well-being. It funds research that informs social policy, primarily in Education, Welfare, and Justice. It also funds student programmes that provide opportunities for young people to develop skills in quantitative and scientific methods. The Nuffield Foundation is the founder and co-funder of the Nuffield Council on Bioethics and the Ada Lovelace Institute. The Foundation has funded this project, but the views expressed are those of the authors and not necessarily the Foundation. Visit www.nuffieldfoundation.org
Download
This document is available to download as a free PDF at:
https://www.resolutionfoundation.org/publications/mapping-millennials-living-standards
Citation
If you are using this document in your own writing, our preferred citation is: M. Gustafsson, Mapping millennials' living standards , Resolution Foundation, August 2019
Permission to share
This document is published under the Creative Commons Attribution Non Commercial No Derivatives 3.0 England and Wales Licence. This allows anyone to download, reuse, reprint, distribute, and/or copy Resolution Foundation publications without written permission subject to the conditions set out in the Creative Commons Licence. For commercial use, please contact:
MAPPING MILLENNIALS’ LIVING
STANDARDS
summary
Intergenerational progress – the idea that each successive cohort should have higher living standards than predecessors at the same age – has slowed down markedly for today’s young adults. This puts their experience in stark contrast to the rapid cohort-on-cohort improvements in standards of living up until those born in the 1970s.
Because many people spend their whole lives in the same part of the country and inter-regional mobility rates have been falling, it is important to assess these intergenerational comparisons through the lens of place. The concerns that young people have about their living standards prospects reflect how they compare themselves both to peers across the country, and to the experiences of older generations in the communities in which they live.
This briefing note examines how young adults across the nations and regions of the United Kingdom are faring in terms of their pay, employment, educational attainment, home ownership and housing costs, compared to previous generations at the same age. In particular, we focus on how those born between 1986 and 1990 compare with those born between 1971 and 1975.
• The West Midlands and Yorkshire and the Humber are regions where young adults might feel most pessimistic about their prospects in the labour market. The 1986-90 cohort of millennials in the West Midlands and Yorkshire not only experience worse labour market outcomes in their late 20s compared to their peers in other regions today, but also find themselves with little or no generational progress on the 1971-75 cohort.
• Millennials everywhere face housing cost pressures and struggle to get on the housing ladder. London has the lowest home ownership rates for those born 1986-90 when in their late 20s, and the biggest home ownership decline since the 1971-75 cohort were that age. But the decline in the West Midlands was almost as big. As a result, young adults’ home ownership rates in the West Midlands are now below the national average.
• Millennials in the North East have experienced the largest cohort-on-cohort labour market improvements. The 1986-90 cohort in the North East still has earnings, employment rates and degree attainment rates below the national average. But the North East has experienced the fastest intergenerational improvements since the 1971-75 cohort was in their late 20s on all three measures. This progress reflects the fact that while there is further room for
improvement in its labour market, the gap between the North East and leading regions like the South East has narrowed.
Looking at the interaction between current living standards and intergenerational progress from a regional perspective furthers our understanding of how people may think about their situation, and what expectations they form. The big differences across the country in how young people have fared compared to their predecessors point to the need for policy makers to recognise and address different regional challenges for young adults.
Introduction – why place matters when thinking about
generational living standards differences
Large majorities across age groups believe that social progress is about younger generations experiencing better living standards than those that came before them.[1] These beliefs are held across every region and nation of the UK. At least
four times as many adults agree as disagree that every generation should have a higher standard of living than the one before it.[2] The strongest support for such
generational progress is found in areas right across the country: the North West, the East Midlands and London.[3]
However, people in Britain now have little confidence that younger generations will be better off than those that came before. Pessimists about the prospects of today’s young adults outnumber the optimists two-to-one.[4]
This anxiety for younger generations’ living standards goes beyond economists’ numbers; it is experienced first-hand by individuals who work hard, build a family and take care of their loved ones. To understand how young adults feel about their lives today, we need to think about how they compare themselves to people around them.
When people look to their parents’ generation for a point of reference, place is a crucial factor. While the proportion of people moving homes varies greatly for different groups, mobility rates for young people in particular have been falling in recent years.[5] When people do move, they tend to stay in the local area.[6] And
a recent study shows that nearly 45 per cent of people in the UK will only ever work in the place where they were born.[7] This makes the intersection between
place and intergenerational progress especially important for how people feel about their standard of living.
In this briefing note we consider five key indicators of standards of living. Weekly pay, the employment rate and the proportion of the population with a degree give us an idea of how young adults are getting on in the labour market. To broaden our perspective to housing security and wealth accumulation, we also look at the cost of housing and home ownership rates.
These indicators are examples of factors young adults think about when they consider their own standard of living, comparing it both to the prior experience of older cohorts in their own communities, and to peers of similar ages across the country. They are all central to young adults’ ability to build a career, save and invest in ways that are important to them.
We use these indicators to compare young adults born 1986-90 (a subset of the millennial generation born 1981-2000) to their peers in other regions, and to the 1971-75 cohort (a subset of 1966-80-born generation X) born 15 years before them. Through this comparison, we can form a rounded picture of how it feels to be young in different parts of the country today.
3 Ipsos MORI polling of adults aged 16-75 in Great Britain, conducted in May 2017 for the Resolution Foundation. 4 H Shrimpton, G Skinner & S Hall, The millennial bug: Public attitudes on the living standards of different generations,
Resolution Foundation, September 2017
5 L Judge, Moving matters: Housing costs and labour market mobility, Resolution Foundation, June 2019
6 M Langella & A Manning, Residential Mobility and Unemployment in the UK, CEP discussion paper No 1639, London School of Economics, July 2019
Jobs, pay and education
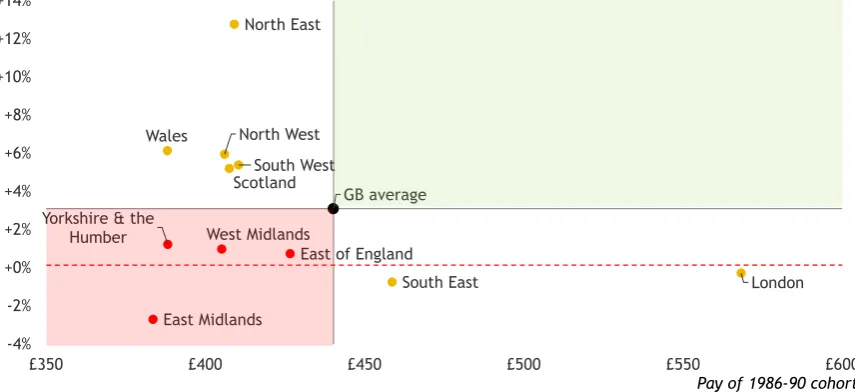
Figure 1: Millennials’ pay performance has been weak across all regions and nations. Figure 1 shows median weekly pay for employees. In no region has the 1986-90 cohort experienced both above-average weekly pay compared to other parts of the country, and an above-average increase in real pay compared to the generation before. Indeed, in the two regions in which millennials have the highest earnings today – London and the South East – the 1986-90 cohort has lower real pay than the cohort 15 years before them did at the same age.
Figure 1: Millennials’ pay performance has been weak across all regions and nations
Median real weekly employee pay (CPIH-adjusted to 2018 prices) at ages 26-28, by cohort and region: 1997-2003 and 2012-2018
Source: RF analysis of ONS, Annual Survey of Hours and Earnings
The ‘worst-of-both-worlds’ quadrant in Figure 1: Millennials’ pay performance has been weak across all regions and nations – places with below-average intergenerational progress and below-average weekly pay today – contains the East Midlands, Yorkshire and the Humber, the West Midlands and the East of England. The East Midlands fares worst overall, because it is the region with the biggest fall in the pay of those in their late 20s over the past 15 years, and the lowest current weekly pay for those born in the late 1980s.
However, as can be seen in Figure 2: Employment rates for young adults have increased in most regions and nations the 1986-90 cohorts of millennials in both the East Midlands and the East of England have employment rates above the national average. This may to some extent counteract the negative effects of low cohort-on-cohort growth in weekly pay. Conversely, below-average weekly
GB average North East
North West
Yorkshire & the Humber
East Midlands West Midlands
South West
East of England
London South East
Wales
Scotland
-4% -2% +0% +2% +4% +6% +8% +10% +12% +14%
£350 £400 £450 £500 £550 £600
Difference in pay between 1986-90 and 1971-75 cohorts within the same region
pay in Yorkshire and the Humber and the West Midlands is coupled with the lowest employment rates. We can see that Yorkshire and the Humber and the West Midlands are also the only regions where the late-20s employment rate has decreased since the 1971-75 cohort of generation X were in their 20s. This suggests that millennials in these two regions are likely to have the bleakest outlooks on their labour market experiences.
Figure 2: Employment rates for young adults have increased in most regions and nations
Employment rate at ages 26-28, by cohort and region: 1997-2003 and 2012-2018
Notes: Labels show the proportional change between the 1971-75 and 1986-90 cohorts. Shading indicates the two areas with the best (green) and worst (red) changes between these two cohorts.
Source: RF analysis of ONS, Labour Force Survey
Turning to educational attainment, the current degree attainment rate in regions largely follows the labour market patterns for millennials seen in their weekly pay performance and employment rates. London is the exception, where an extremely high proportion of people in their 20s have a degree-level qualification. As Figure 3: Regional degree attainment rates for young adults tends to follow trends in pay and employment shows, Yorkshire and the Humber and the West Midlands again experience the weakest progress on predecessors at the same age in the same region.
This chartFigure 3: Regional degree attainment rates for young adults tends to follow trends in pay and employment also shows that the proportion of young adults who are graduates in the North East has doubled since the late 1970s, with
73% 75% 77% 79% 81% 83% 85%
-1% -1%
South East
East of England South West
UK average
East Midlands
Scotland London North West
Yorkshire & the Humber West Midlands Northern Ireland
Wales North East
Born 1971-75 Born 1986-90
Two regions where millennials have improved most compared to gen X
Two regions where millennials have fallen behind compared to gen X +4%
+3%
+2%
+3% +2%
+2% +1%
+3%
-0% +2%
almost one out of every three millennials from the 1986-90 cohort having gained a degree-level qualification.
Figure 3: Regional degree attainment rates for young adults tends to follow trends in pay and employment
Proportion of 26-28 year olds with degree-level qualifications, by cohort and region: 1997-2003 and 2012-2018
Notes: Labels show the proportional change between the 1971-75 and 1986-90 cohorts. Shading indicates the two areas with the best (green) and worst (red) changes between these two cohorts.
Source: RF analysis of ONS, Labour Force Survey
The positive outlook for the North East is a recurring theme throughout these labour market indicators. When those in the 1971-75 cohort in North East were 26-28 years old, they experienced the lowest employment rate in the country, as seen back in Figure 2: Employment rates for young adults have increased in most regions and nations. Since then the region has had the largest intergenerational increase in employment, although millennials born 1986-90 still lag behind the national average. The North East also stands out given that this intergenerational increase in the employment rate is coupled with by far the strongest improvement in weekly pay, as seen back in Figure 1: Millennials’ pay performance has been weak across all regions and nations, and in degree attainment, as seen in Figure 3: Regional degree attainment rates for young adults tends to follow trends in pay and employment.
It is possible that graduate retention is a big driver of these outcomes. Figures from the Centre for Cities show that Middlesbrough and Newcastle are good at keeping their graduates locally, both universities ranking in the top 10 in graduate retention rates among UK cities.[8]
8 R McDonald, The great British brain drain: Newcastle, Centre for Cities, May 2017
0% 10% 20% 30% 40% 50% 60% 70%
South East
East of England South West
UK average
East Midlands
Scotland
London
North West
Yorkshire & the Humber West Midlands Northern Ireland
Wales North East
Born 1971-75 Born 1986-90 +99%
+81% +40%
+53% +62%
+64%
+73%
+72% +66% +80%
One conclusion from this analysis of jobs market outcomes for young adults is that certain regional gaps have shrunk. The North East has experienced the fastest intergenerational improvements for people in their late 20s,
whereas young adults in the South East have experienced lower-than-average intergenerational progress.
This rebalancing is likely to have been driven by the fact that rising employment in recent years has helped to reduce variation in employment rates across the UK, while a higher minimum wage has helped to reduce geographic pay gaps, particularly for younger people.[9] The North East specifically has benefited from
among the highest growth rates in both earnings and employment for all age groups since the early 2000s.[10] These general economic improvements in the
region have timed well with the 1986-90 cohort entering and progressing in the labour market, so millennials have been able to ride the wave of region-wide improvements.[11]
This makes the differences in the experiences of the North East on the one hand, and the West Midlands and Yorkshire and the Humber on the other, all the more poignant. Rather than catching up with leading regions like South East and London, the West Midlands and Yorkshire and the Humber are falling further behind.
This analysis of the labour market shows that no place is performing
consistently well across both young adults’ living standards today and rates of improvement since the late 1990s. There are, however, some significant regional differences:
• Wales, the West Midlands and Yorkshire perform consistently poorly in terms of young adults’ outcomes compared to their counterparts in other regions today.
• The West Midlands and Yorkshire stand out particularly as they also perform poorly in terms of rates of change compared to those born 15 years before when they were the same age.
• The North East has lower-than-average performance today, but tops the generational progress rankings on all three indicators.
• London and the South East often rank well in terms of levels today, but have generally had lower-than-average generational progress.
9 S Clarke, Mapping gaps: Geographic inequality in productivity and living standards, Resolution Foundation, July 2019 10 RF analysis of ONS, Annual Survey of Hours and Earnings; ONS, Labour Force Survey
Housing costs, security and wealth
Housing security and quality are also an important part of how people feel about their standard of living. Owning one’s own home is a widespread aspiration and can create a sense of belonging to a local area. While the late 20s may now be considered relatively early for home ownership, two-in-five baby boomers from the 1961-65 cohort owned their home when they were in their late 20s.[12]
For millennials born 1986-90, home ownership has collapsed in all parts of the country over the past couple of decades. As Figure 4: London and the West
[image:10.612.93.515.415.652.2]Midlands have experienced the biggest falls in home ownership for those in their late 20s shows, 26-28 year olds’ home ownership rates have halved since the 1971-75 cohort of generation X were in their late 20s. Millennials in London are behind their peers in other regions, with both the lowest proportion of home owners and the largest decrease in home ownership compared to generation X.
Figure 4: London and the West Midlands have experienced the biggest falls in home ownership for those in their late 20s
Home ownership rates for 26-28 year olds, by cohort and region: 1997-2003 and 2012-2018
Notes: Labels show the proportional change between the 1971-75 and 1986-90 cohorts. Shading indicates the two areas with the best (green) and worst (red) changes between these two cohorts. Analysis covers families, which are assigned to cohorts based on the age of the head of the family unit. A family unit is a single adult or couple, and any dependent children. Figures for each cohort are derived from a weighted average of estimates by single year of age; cohorts are included if at least five birth years are present in the data.
Source: RF analysis of ONS, Labour Force Survey
We have already shown that the West Midlands and Yorkshire and the Humber are regions where millennials face the least favourable labour market outcomes
12 RF analysis of ONS, Labour Force Survey
5% 10% 15% 20% 25% 30% 35% 40% 45% South East
East of England
South West
UK average
East Midlands Scotland
London
North West Yorkshire & the Humber
West Midlands Northern Ireland
Wales North East
Born 1971-1975 Born 1986-1990 -58%
-56% -49%
-49% -50% -43%
-38%
-51% -49% -48% -45%
compared to peers in other regions, and their predecessors where they live. For the West Midlands, these challenges are compounded by the housing market. Indeed, the West Midlands follows London closely in terms of home ownership, with the second-largest intergenerational decrease in ownership rates for millennials compared to generation X.
However, Yorkshire and the Humber, which did badly on our jobs market indicators, has a more positive outlook when it comes to home ownership. As Figure 4: London and the West Midlands have experienced the biggest falls in home ownership for those in their late 20s shows, young millennials in Yorkshire and the Humber have among the highest home ownership rates in the country, despite having experienced a large decrease in ownership compared to people born in the early 1970s in that region.
Related to the reduction in home ownership is the increasing proportion of income taken up by housing costs.[13] Figure 5: Young adults are spending more
income on housing than previous cohorts at the same age everywhere except Wales shows the proportion of income spent on housing. As might be expected, young Londoners (this time those born 1981-90) are again worst off, with both high current costs and a large increase in how much of their income they spend on housing compared to those in generation X born 1961-70. Whereas the West Midlands and Yorkshire and the Humber did badly on the labour market and home ownership, they are mid-table when it comes to the share of young adults’ income that is spent on housing.
Figure 5: Young adults are spending more income on housing than previous cohorts at the same age everywhere except Wales
Proportion of net income spent on housing costs by 24-26 year olds, by cohort and region: 1985-1996 and 2007-2016
Notes: Labels show the proportional change between the 1961-70 and 1981-90 cohorts. Shading indicates the two areas with the best (green) and worst (red) changes between these two cohorts. Average net income spent on housing is shown for Great Britain only since Northern Ireland was excluded from the dataset that this analysis is based on for earlier periods than shown on this chart. Analysis covers families, which are assigned to cohorts based on the age of the head of the family unit. A family unit is a single adult or couple, and any dependent children. Analysis excludes principal repayment and including housing benefit (in both incomes and housing costs). Incomes and housing costs are assumed to be shared equally within households. Figures for each cohort are derived from a weighted average of estimates by single year of age; cohorts are included if at least five birth years are present in the data.
Source: RF analysis of IFS, Households Below Average Income (1985-91); DWP, Family Resources Survey (1994-2018)
The two regions where the pressure of housing costs on incomes has not nudged up at all over this period – Wales and North East – are also the two regions with the highest intergenerational increases in employment rates and weekly pay. In contrast to other regions where pay has been stagnant, it looks as if earnings increases for young people in Wales and the North East may have offset some increases to housing costs.
Our analysis has confirmed that that housing is a major challenge for today’s young adults across the country. However, there are important regional differences:
• While the pressure that housing costs put on incomes, and home ownership, present challenges to young adults across the country, these are most acute in London.
• The West Midlands stands out as having both low home ownership rates and a substantial intergenerational decline.
5% 10% 15% 20% 25% 30% 35%
South East East of England
South West
GB average
East Midlands Scotland
London
North West Yorkshire & the Humber
West Midlands
Northern Ireland
Wales North East
Born 1961-70 Born 1981-90 -4%
+2%
+27%
+17% +26%
+16% +35%
+30% +20%
+5% +15%
+29%
• The North East and Wales are performing well in terms of generational
progress on housing costs, which to some extent reinforces our conclusions in relation to the labour market.
Conclusion
This is the first analysis we are aware of that considers the intersection between the living standards of young people across the regions and nations of the UK today, and intergenerational progress compared to a previous cohort.
The West Midlands and Yorkshire and the Humber have consistently emerged as regions where young adults might feel most pessimistic about their prospects. In these places the 1986-90 cohort of millennials not only experiences poorer labour market outcomes and (in the case of the West Midlands) low home ownership rates compared to their peers in other regions today, but has also experienced less progress (or a more marked decline) on predecessors than millennials in other regions have.
The North East stands out in terms of intergenerational progress. The 1986-90 cohort remains behind national averages for labour market outcomes and in terms of housing security, but the region has experienced major
intergenerational improvements since the 1971-75 cohort was young. Although our indicators show that this is not the best place in the country for millennials to live and work today, there might still be a more positive outlook there than in regions such as the West Midlands.