Abstract: This paper presents an efficient event detection and classification technique for multiple power quality (PQ) disturbances. Initially synthetic power quality disturbances are simulated and then are directly processed to proposed algorithms to generate the target feature sets which comprises of energy, entropy, root mean square (RMS), mean, standard deviation, kurtosis, variance and maximum peak respectively. After the overall data analysis, it was found that thirteen power quality events out of the overall generated PQ disturbances were distinctively classified. Eventually these target features are passed through simple decision tree based event classifier for PQ events classification. The proposed algorithms are change detection filter (CDFT) with noise, without noise and synchrosqueeze wavelet transform (SST) has been scrutinized for number of disturbances presented in the PQ events. The proposed technique SST is applied for PV based microgrid to enhance the real time performance of the proposed technique where it has been verified as a superior technique as compared with the some of the existing event classification techniques such as wavelet transform (WT), stock well transform (SR),etc. The entire process has been verified in the in the MATLAB /Editor. The proposed technique evades the need of further signal processing techniques for detection and classification PQ events, thus ensconced less computational complexity and faster execution. Hence it is an efficient algorithm for real time applications.
Index Terms: Decision tree, Change detection filter, Power Quality disturbances, Synchrosqueeze wavelet transform and confusion matrix.
I. INTRODUCTION
Power quality (PQ) monitoring has become an important part of power distribution networks to avoid the equipment damage and it is necessary to determine the cause of the disturbances [1].The PQ disturbances causes due to increasing distributed loads, solid state switching devices, non-linear loads and power electronic devices usage. The power quality disturbances can be categorized as stationary and non-stationary signal, and most of the power quality disturbances in the nature are noisy and non-stationary. An Advanced signal processing techniques are required to accurately detect and classify the power quality events [9]. The power quality events classification is based on the three segments namely processing technique, optimal feature
Revised Manuscript Received on July 05, 2019.
Kanche Anjaiah, EEE department, GMRIT, Rajaam,SrikakulamIndia.
Rajesh Kumar Patnaik, EEE department, GMRIT, Rajaam,Srikakulam India.
.
selection and automatic event classifier. The main objective of the any processing technique is to transform the available data into a domain from here features can be extracted.
Several approaches are reported to analyze the PQ disturbances in this literature. Amongst them Stock welltransform (ST)[2], wavelet transform (WT)[5], Discrete Fourier transform (DFT)[11], short time Fourier transform (STFT) [12], continuous wavelet transform (CWT)[7], discrete wavelet transform (DWT), fast Fourier transform (FFT)[4], Hilbert H transform (HHT)[6], Variational mode decomposition (VMD)[3], empirical mode decomposition (EMD)[10] and empirical wavelet transform (EWT)[8]. According to the literature survey the analysis of signal with the wavelet transforms (i.e. WT, CWT and DWT) requires proper selection of a mother wavelet, decomposition levels and sampling frequency. Selection of these parameters from the signal with respect to the mother wavelet had very high computational complexity and also noise is not considered in the signal. Fast Fourier transform can classify large volumes of PQ problems, the FFT has lack of time frequency localization capability and it is unable to analyze the non-stationary signal. The STFT is mainly used in spectral analysis, the analysis of PQ signals with STFT in two ways, first one consists using several FFT modules in parallel and the second approach is iterative fashion for obtain the frequency values. The drawback of STFT is high cost in terms of hardware, it needs more FFT modules and the iterative fashion of STFT generates more errors. The Stockwell transform (ST) method exhibits deterioration in localization of event detection. Fourier transforms (FT) are inefficient in capturing short-time transients in the power signal. For the HT, HHT and EMD have no supporting mathematical theory and these are also noise sensitive.
In this paper a few methods is are proposed to detect and classify the PQ events i.e. sag, swell, interruption, transients/spike, oscillatory transients, harmonics, flicker, flicker with swell, sag with harmonics, notch, Flicker with sag, Swell with harmonics, Sag with harmonics with oscillatory transients and harmonics with sag with flicker with oscillatory transients [14]. With the help of proposed methods i.e. change detection filter (CDFT), CDFT with noise and synchrosqueeze wavelet transform (SST)) total thirteen PQ disturbances are extracted (with CDFT -7 events, CDFT with noise- 7 events and SST – 7 events due to repeating the events 13 only considered).With a simple
decision tree based
algorithms and confusion matrixes the above all PQ events are classified. The
An advanced signal processing based multiclass
power quality disturbance detection and
classification technique for grid connected solar
PV farm
major advantage of the proposed techniques are detection i.e. the proposed methods will gives the easy identification of PQ disturbances in the system, for any number of cycles in the signal and it gives the system with certain advantages like less computational complexity, less economical cost, and faster execution timings.
Initially the PQ disturbances are extracted with the help of proposed techniques and directly computed to generate the initial feature sets such as energy, entropy, mean, standard deviation, root mean square, kurtosis, maximum peak and variance etc. After generating these feature sets for all the cases (as discussed in section IV), they have been separated with the distinct values of each feature from afore mentioned feature sets. After analyzing the PQ disturbances the target feature set has been formed which contains C1 (energy), C2 (entropy), C3 (root mean square), C4 (mean), C5 (standard deviation), C6 (kurtosis), C7 (maximum peak) and C8 (variance). These feature sets passed through a simple decision tree based event classifiers, which classifies the events as discussed in section V.
II. WORKINGPRINCIPLEOFCDFT
Change detection filter is used to detect the minor and major changes in any signal. It is working with the help of first cycle or reference cycle of the signal. CDFT always compares the signal having any number of cycles in the signal with the reference of that first cycle of the signal. If the reference cycle or first cycle of the signal and second cycle of that signal is same then the change detection filter (CDFT) shows zero, otherwise it will shows error values. This process done for every sample of the signal with the help of reference cycle as shown below
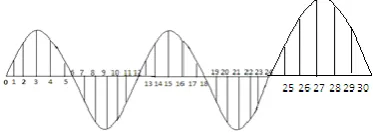
Figure.1: sine wave with 12 samples
Figure shows 12 samples per cycle, comparison (here amplitudes are comparing) of the cycles with the reference signal is shown below
Z (1) – Z (13) = 0 Z (2) – Z (14) = 0
Z (11) – Z (23) = 0 Z (12) – Z (24) = 0 Z (13) – Z (25)~= 0
Z (17) – Z (29) ~= 0 Z (18) – Z (30) ~= 0
All the above results (13 to 24) shows zero amplitude because here two cycles are identical, in this condition change detection filter shows zero line only and the results from 25 to 30 shows no zero amplitude. The both the cases are observed in the figurer 1. In this filter it is easy to identify the fault location in any number of samples in the signal.
III. GENERATIONOFPOWERQUALITY
EVENTSWITHCDFT
The generation of the power quality disturbances such as sag, swell, transients /impulse/spike, interruptions, harmonics, oscillatory transients, flicker, flicker with swell, sag with harmonics, notch etc. These PQ disturbances will be creating the discrepancy in the power in the system and that leads to damage the equipment. Now a days for every system had the key challenge to clear the faults very promptly due to its hold up capabilities. In order to clear the faults it is essential to detect and classify the power quality disturbances.
From these PQ events the proposed method focused on seven events those are interruptions, transients, oscillatory transients, harmonics, flicker, flicker with swell and notch. All these PQ events are simulated with using features (as discussed in section IV) in the MATLAB. The proposed method was developed by using following features.
Ns = 64 (where Ns is number of samples) F = 50 Hz (frequency)
Fs = 3200Hz (Sampling frequency)
According to IEEE 1159[14]
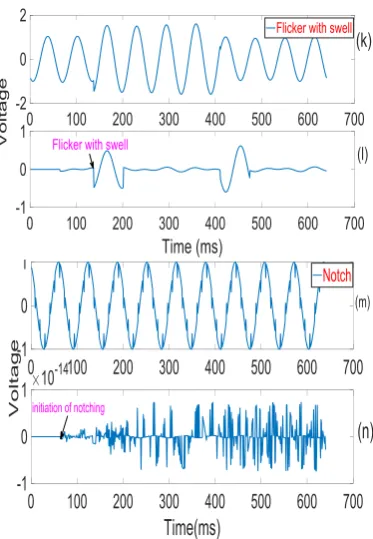
a. Interruption (M1): it will be occurred due to power system faults and equipment failures. The range of interruption is less than 0.1pu and fault existing period of time is less than one minute. From figure 1(a-b) it is clear that interruption started from 165ms (0.165sec) to 370 ms (0.376 sec).
b. Transients /spike/impulse (M2):The energy imbalance between power sources and storage sources are caused to produce transients. The transients are sudden change in the voltage is shown in the fig. 1(c-d).
c. Oscillatory transients (M3):An oscillatory transient consists of a voltage or current whose instantaneous value changes polarity rapidly. The range of oscillatory transients is less than 0.4pu and fault existing period of time is less than 50ms, as shown in figure 1(e-f)
d. Harmonics (M4): These are sinusoidal voltage frequencies that are integer multiples of supply voltage as shown in the fig. 1(g-h) these harmonics are caused due to non linear and power electronic devices.
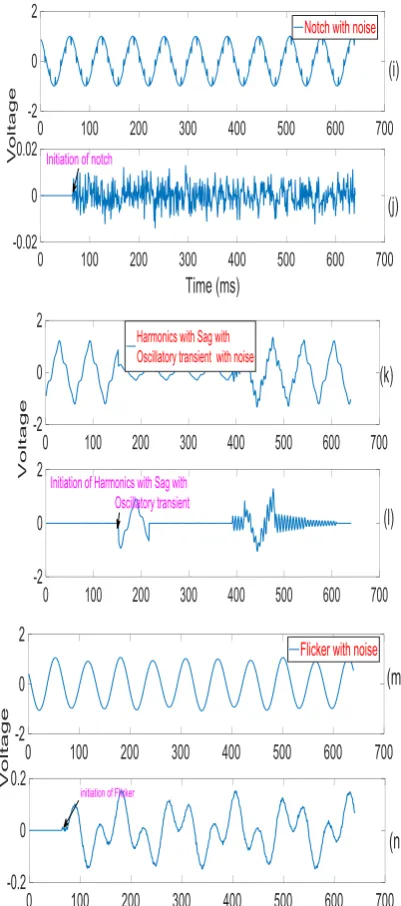
e. Flicker (M5): It is the process of rapidly changes in the supply voltage, it will be observed in the lamp when it was blinking that is shown in the fig. 1(i-j).
f. Flicker with swell (M6): It is the process of rapidly changes in the supply voltage with swell (i.e., The range of swell is between 1.1pu to 1.8pu with 0.5sec to 1min), which will be observed in the fig. 1(k-l)
[image:2.595.86.273.430.498.2]Figure 1: Power Quality events with change detection filter a-b: Interruption, c-d: Transients/impulse/spike, e-f: Oscillatory Transients, g-h: Harmonics, k-l: Flicker with Swell, m-n: Notch
All the above results are shows the operation of power quality signal with the CDFT filter. In this figure.1 CDFT clearly shows the whenever the changes in the PQ signals.
IV. TARGETFEATUREEXTRACTION
The major disturbances in the power quality analysis are sag, interruption, harmonics, transients, oscillatory transients, flicker, flicker with swell, sag with harmonics and notch. These PQ disturbances are extracted with the help of power quality indices. There are plenty of indices out of these indices eight parameters are considered those are C1 (energy),
C2 (entropy), C3 (root mean square), C4 (mean), C5 (standard
deviation), C6 (kurtosis), C7 (variance) and C8 (maximum
peak) [15]. Under these consideration seven types of PQ disturbances are extracted. Those are interruption, transients, oscillatory transients, harmonics, flicker, flicker with swell and notch
A. Energy of the signal (C1):
For a signal Z (t) with samples t = 1, 2, 3 … N its energy is defined as
N
t t
Z
12
(1)
B. Entropy (C2):
It is the average amount of the information from the PQ disturbance (or) source event
N
t
t b
t
Z
Z
1C. Root mean square(RMS)( C3):
It is defined as the square root of the sum of squares of the mean of the values of the signal
Nt
t
Z
Z
Z
N
12 2
2 2
1
...
)
(
1
(3)
D. Mean (C4):
It is defined as the ratio of the sum of the samples to the number of samples
Nt t
N
Z
1
(4)
Where N = total number of samples E. Standard Deviation (C5):
It is defined as the attribute that enumerates the amount of deviation in a set of data values mathematically.
C
5
Where C4 is the mean and “Zt”is the signal storage with
samples.
F. Kurtosis (C6):
It is the measure of the signal whether the data are peaked or flat relative to normal distribution. Data sets with high kurtosis tend to have a distinct peak near the mean and low kurtosis tend to have flat top near the mean.
G. Variance (C7):
It is defined as the difference between the squared sums of the instantaneous samples to the distribution form of the mean (µ) divided by the number of terms in the distribution (N)
H. Maximum Peak Amplitude (C8):
It is defined as the maximum value of the output of the signal. The target features are classified on the rule based model, in this model the distinctive features are found (the above all features i.e. from C1 to C8). All these performance
indices are mathematically represented in this section with the help of these expressions (equations from 1 to 7) are coded in the MATLAB to analysis the power quality disturbances.
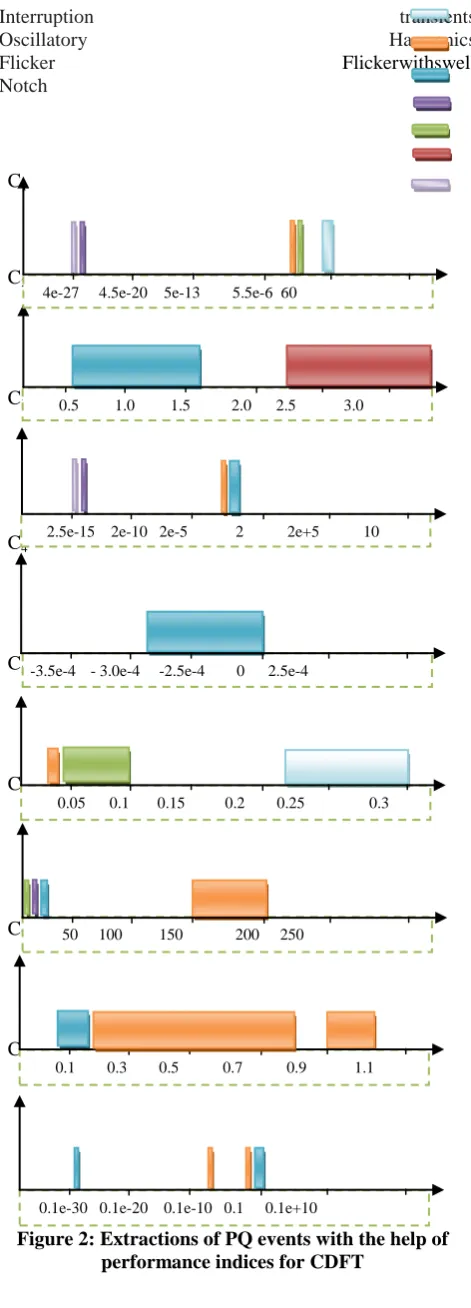
Depend upon these features the power quality disturbances are classified as shown in the fig.2. In the figure.2 various colors are used for identification of PQ events. These PQ events will be shown at the top right corner side. On the basis of these target features of PQ events a simple decision tree was build it is discussed in section V. All these power quality events are classified with the help of
table. I. From the figure 2 it is clear that no event is overlapping with any other event.
Interruption transients Oscillatory Harmonics Flicker Flickerwithswell
Notch
C1
C2
C3
C4
C5
C6
C7
[image:4.595.310.546.83.738.2]C8
Figure 2: Extractions of PQ events with the help of performance indices for CDFT
0.5 1.0 1.5 2.0 2.5 3.0
-3.5e-4 - 3.0e-4 -2.5e-4 0 2.5e-4 4e-27 4.5e-20 5e-13 5.5e-6 60
0.05 0.1 0.15 0.2 0.25 0.3 2.5e-15 2e-10 2e-5 2 2e+5 10
0.1 0.3 0.5 0.7 0.9 1.1 50 100 150 200 250
880
Published By:
Blue Eyes Intelligence Engineering Retrieval NumberI7781078919/19©BEIESP
[image:5.612.61.552.82.633.2]DOI:10.35940/ijitee.I7781.078919
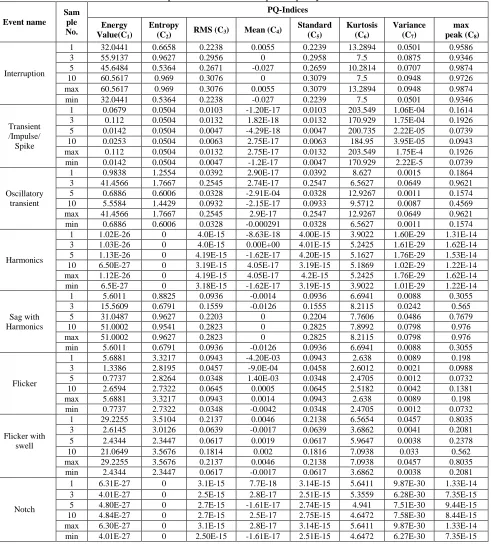
Table -1 performance indices for power quality events
Event name Sam
ple No.
PQ-Indices Energy
Value(C1)
Entropy
(C2) RMS (C3) Mean (C4)
Standard (C5)
Kurtosis (C6)
Variance (C7)
max peak (C8)
Interruption
1 32.0441 0.6658 0.2238 0.0055 0.2239 13.2894 0.0501 0.9586
3 55.9137 0.9627 0.2956 0 0.2958 7.5 0.0875 0.9346
5 45.6484 0.5364 0.2671 -0.027 0.2659 10.2814 0.0707 0.9874
10 60.5617 0.969 0.3076 0 0.3079 7.5 0.0948 0.9726
max 60.5617 0.969 0.3076 0.0055 0.3079 13.2894 0.0948 0.9874
min 32.0441 0.5364 0.2238 -0.027 0.2239 7.5 0.0501 0.9346
Transient /Impulse/
Spike
1 0.0679 0.0504 0.0103 -1.20E-17 0.0103 203.549 1.06E-04 0.1614
3 0.112 0.0504 0.0132 1.82E-18 0.0132 170.929 1.75E-04 0.1926
5 0.0142 0.0504 0.0047 -4.29E-18 0.0047 200.735 2.22E-05 0.0739
10 0.0253 0.0504 0.0063 2.75E-17 0.0063 184.95 3.95E-05 0.0943
max 0.112 0.0504 0.0132 2.75E-17 0.0132 203.549 1.75E-4 0.1926
min 0.0142 0.0504 0.0047 -1.2E-17 0.0047 170.929 2.22E-5 0.0739
Oscillatory transient
1 0.9838 1.2554 0.0392 2.90E-17 0.0392 8.627 0.0015 0.1864
3 41.4566 1.7667 0.2545 2.74E-17 0.2547 6.5627 0.0649 0.9621
5 0.6886 0.6006 0.0328 -2.91E-04 0.0328 12.9267 0.0011 0.1574
10 5.5584 1.4429 0.0932 -2.15E-17 0.0933 9.5712 0.0087 0.4569
max 41.4566 1.7667 0.2545 2.9E-17 0.2547 12.9267 0.0649 0.9621
min 0.6886 0.6006 0.0328 -0.000291 0.0328 6.5627 0.0011 0.1574
Harmonics
1 1.02E-26 0 4.0E-15 -8.63E-18 4.00E-15 3.9022 1.60E-29 1.31E-14
3 1.03E-26 0 4.0E-15 0.00E+00 4.01E-15 5.2425 1.61E-29 1.62E-14
5 1.13E-26 0 4.19E-15 -1.62E-17 4.20E-15 5.1627 1.76E-29 1.53E-14
10 6.50E-27 0 3.19E-15 4.05E-17 3.19E-15 5.1869 1.02E-29 1.22E-14
max 1.12E-26 0 4.19E-15 4.05E-17 4.2E-15 5.2425 1.76E-29 1.62E-14
min 6.5E-27 0 3.18E-15 -1.62E-17 3.19E-15 3.9022 1.01E-29 1.22E-14
Sag with Harmonics
1 5.6011 0.8825 0.0936 -0.0014 0.0936 6.6941 0.0088 0.3055
3 15.5609 0.6791 0.1559 -0.0126 0.1555 8.2115 0.0242 0.565
5 31.0487 0.9627 0.2203 0 0.2204 7.7606 0.0486 0.7679
10 51.0002 0.9541 0.2823 0 0.2825 7.8992 0.0798 0.976
max 51.0002 0.9627 0.2823 0 0.2825 8.2115 0.0798 0.976
min 5.6011 0.6791 0.0936 -0.0126 0.0936 6.6941 0.0088 0.3055
Flicker
1 5.6881 3.3217 0.0943 -4.20E-03 0.0943 2.638 0.0089 0.198
3 1.3386 2.8195 0.0457 -9.0E-04 0.0458 2.6012 0.0021 0.0988
5 0.7737 2.8264 0.0348 1.40E-03 0.0348 2.4705 0.0012 0.0732
10 2.6594 2.7322 0.0645 0.0005 0.0645 2.5182 0.0042 0.1381
max 5.6881 3.3217 0.0943 0.0014 0.0943 2.638 0.0089 0.198
min 0.7737 2.7322 0.0348 -0.0042 0.0348 2.4705 0.0012 0.0732
Flicker with swell
1 29.2255 3.5104 0.2137 0.0046 0.2138 6.5654 0.0457 0.8035
3 2.6145 3.0126 0.0639 -0.0017 0.0639 3.6862 0.0041 0.2081
5 2.4344 2.3447 0.0617 0.0019 0.0617 5.9647 0.0038 0.2378
10 21.0649 3.5676 0.1814 0.002 0.1816 7.0938 0.033 0.562
max 29.2255 3.5676 0.2137 0.0046 0.2138 7.0938 0.0457 0.8035
min 2.4344 2.3447 0.0617 -0.0017 0.0617 3.6862 0.0038 0.2081
Notch
1 6.31E-27 0 3.1E-15 7.7E-18 3.14E-15 5.6411 9.87E-30 1.33E-14
3 4.01E-27 0 2.5E-15 2.8E-17 2.51E-15 5.3559 6.28E-30 7.35E-15
5 4.80E-27 0 2.7E-15 -1.61E-17 2.74E-15 4.941 7.51E-30 9.44E-15
10 4.84E-27 0 2.7E-15 2.5E-17 2.75E-15 4.6472 7.58E-30 8.44E-15
max 6.30E-27 0 3.1E-15 2.8E-17 3.14E-15 5.6411 9.87E-30 1.33E-14
V. SIMPLE DECISION TREEBASED POWER QUALITY EVENTS CLASSIFIER
Figure: 3 A simple decision tree for classification of PQ events
It is easy method to classify and analysis the power quality events under the disturbance conditions for the proposed method which was shown in the fig.3. It shows decision tree for detecting the type of power quality events occurred when the disturbance generated in the system. The PQ events classification with features is mathematically shown in the table I. the classification has the following procedure.
Step -1: Write the code for above mentioned power quality events in the MATLAB script file
Step -2: Run the program to generate above PQ events Step -3: From these signals evaluate the performance indices (features) with different samples (for each event, 10 samples are taken in this paper).
Step -4: These features passed through the proposed decision tree for classifying the events
Algorithm for decision tree for classification of PQ event
Rule-1:If (32.03<C1<60.562 && 0.2238<C5<0.308 &&
0.091<C8<0.99)then disturbance is Interruption
Rule-2: If 0.013<C1<0.113 && 0.0503<C2<0.0505
&&0.0045<C3<0.0135&&169<C6<204 &&
2.20e-5<C7<0.000181 thendisturbance is
transients/impulse/spike
Rule-3: If0.6005<C2<1.78 &&
-0.000295<C4<3e-17&&6.4<C6<13.7then the disturbance is
oscillatory transients
Rule-4: If6.49e-27<C1<1.131e-26 &&
3.17e-15<C3<4.2e-15 && 3.17e-15<C5<4.21e-15
&&3.89<C6<5.9163then the disturbance is harmonics.
Rule -5: If0.7728<C1<5.689 && 0.0347<C3<0.0945 &&
0.0347<C5<0.0945 && 2.4<C6<2.8 &&0.0011<C7<0.0095
&& 0.0728<C8<0.23then the disturbance is flicker
Notch C1, C2, C3, C4, C5, C6, C7 and C8
Interruptions
If
(32.03<C1<60.562 && 0.2238<C5<0.308 && 0.091<C8<0.99)
Transients/Impulse/ Spike
If
0.013<C1<0.113 && 0.0503<C2<0.0505 && 0.0045<C3<0.0135&&169<C6< 204 &&
2.20e-5<C7<0.000181
Oscillatory Transients
If
0.6005<C2<1.78 && -0.000295<C4<3e-17&&6.4<C6<13.7
Harmonics
If
6.49e-27<C1<1.131e-26 && 3.17e-15<C3<4.2e-15 && 3.17e-15<C5<4.21e-15
&&3.89<C6<5.9163
Flicker
If
0.7728<C1<5.689 && 0.0347<C3<0.0945 && 0.0347<C5<0.0945 && 2.4<C6<2.8
&&0.0011<C7<0.0095 && 0.0728<C8<0.23
Flicker with swell
If
2.343<C2<3.6282 && 0.0616<C5<0.21381 &&0.208<C8<0.8035
If
4.0e-27<C1<6.32e-27 && 2.4e-15<C3<3.15e-15 && 2.50e-15<C5<3.15e-15 && 6.25e-30<C7<9.88e-30 &&
Rule – 6: If2.343<C2<3.6282 && 0.0616<C5<0.21381 &&
0.208<C8<0.8035then the disturbance is flicker with swell
Rule–7: If4.0e-27<C1<6.32e-27 && 2.4e-15<C3<3.15e-15
&& 2.50e-15<C5<3.15e-15 && 6.25e-30<C7<9.88e-30 &&
7.30e-15<C8<1.34e-14then the disturbance is Notch
Else The PQ events are non distinctive
With the help of above algorithm, total twenty nine power quality events are used for testing. All the power quality events are synthetic signals, each disturbance signal is tested by 1000 times with the above algorithm. The capability of the algorithms can be easily verified by the classification accuracy. To show the performance of the proposed
technique, a 7 × 7 confusion matrix is given in Tables 2. The diagonal elements of the confusion matrix are indicates the correctly classified event and the off diagonal elements are indicates the misclassified PQ events. This confusion matrix generated with the help of above algorithm. In this matrix all the events shows the 1000 except event 3, because it is overlapping with the previous values or M2, M4 and M5 are
overlapping. This is the drawback of this method and it is unable to classify the all the events.
Tale -2 confusion matrix for CDFT
Event name
M1 M2 M3 M4 M5 M6 M7
M1
M2
M3
M4
M5
M6
M7
1000 0 0 0 0 0 0
0 1000 0 0 0 0 0
0 8 985 4 3 0 0
0 0 0 1000 0 0 0
0 0 0 0 1000 0 0
0 0 0 0 0 1000 0
0 0 0 0 0 0 1000
VI. PQEVENTSGENERATIONNOISEWITH
CDFT
In this method some noise will be added to the raw signal or synthetic signal to analyze the performance of the change detection filter for noise signal. Whenever the noise contains in the signal then the detection of disturbance is slightly difficult, because the disturbance signal not only contains power quality disturbance but also contains electrical noise. To overcome that difficulty in this paper the proposed filter is used (CDFT). The entire process of this filter is same as discussed in the section II. Different types of power quality disturbances are discussed in the earlier section III. From these PQ events, this (CDFT with noise) method focused on seven events those are Sag, Interruption, Transients/ Impulse/Spike, Flicker, Notch, Harmonics with Sag with Oscillatory transient and Harmonics with Sag with Flicker with Oscillatory transient. Few of above mentioned PQ events are explained clearly in the section III, rest of the events discussed in this section.
Sag (M8): I t is a decrease in RMS voltage or Current to
sandwiched between 0.1pu and 0.9pu at the power frequency for durations from 0.5 cycle to 1 min. It is shown in the fig.4
(a-b), in this figure 4(a) shows the synthetic signal with the 50DB noise and figure 4(b) shows the CDFT with noise, rest of all the power quality disturbances are shown in the figure in this way.
Harmonics with Sag with Oscillatory transient (M9): It is
occurred when the signal has the integer multiples with the decreasing RMS voltage between 10 to 90 percent with rapidly changing instantaneous values of the signal with the polarities of that signal. As shown in the fig. 4 (k-l).
Harmonics with Sag with Flicker with Oscillatory transient (M10): It is occurred when the disturbance is generated with
its integer multiples of decreasing RMS voltage between 0.1pu to 0.9pu, with its changing instantaneous values of the blinking signals. As shown in the figure 4 (g-h).
Interruption (M1), Transients/Impulse/Spike (M2), Notch
(M7) and Flicker (M5)are PQ disturbances with CDFT are
shown in the fig. 4 ((c-d), (e-f), (i-j) and (m-n)) respectively. All these power quality events are generated with the help of the target features (performance indices).These features (from C1 to C8) are discussed in the section IV. All these are
Figure 4: power quality disturbances with change detection filter: (a-b) sag, (c-d) interruption, (e-f) transients, (g-h), harmonics with sag with flicker with oscillatory transients, (i-j) notch, (k-l) harmonics with sag with oscillatory transients and (m-n) flicker.
The target features are classified on the rule based model, in this model the idiosyncratic features are found, the above (section IV) all features i.e. from C1 to C8. Depend upon these
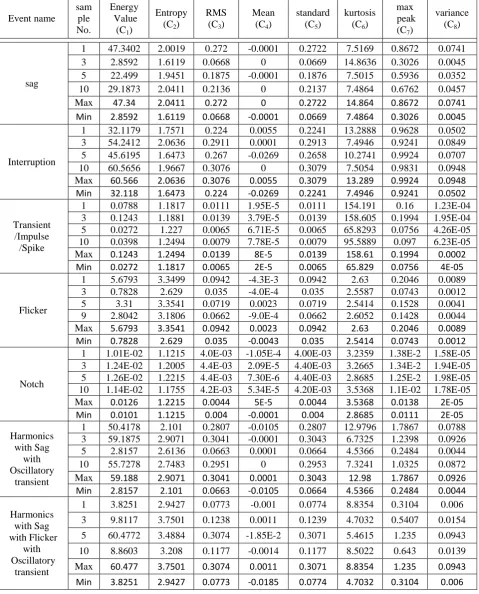
[image:8.595.324.525.59.513.2]Table -3 performance indices for power quality events
Event name sam
ple No.
Energy Value (C1)
Entropy (C2)
RMS (C3)
Mean (C4)
standard (C5)
kurtosis (C6)
max peak
(C7)
variance (C8)
sag
1 47.3402 2.0019 0.272 -0.0001 0.2722 7.5169 0.8672 0.0741
3 2.8592 1.6119 0.0668 0 0.0669 14.8636 0.3026 0.0045
5 22.499 1.9451 0.1875 -0.0001 0.1876 7.5015 0.5936 0.0352
10 29.1873 2.0411 0.2136 0 0.2137 7.4864 0.6762 0.0457
Max 47.34 2.0411 0.272 0 0.2722 14.864 0.8672 0.0741
Min 2.8592 1.6119 0.0668 -0.0001 0.0669 7.4864 0.3026 0.0045
Interruption
1 32.1179 1.7571 0.224 0.0055 0.2241 13.2888 0.9628 0.0502
3 54.2412 2.0636 0.2911 0.0001 0.2913 7.4946 0.9241 0.0849
5 45.6195 1.6473 0.267 -0.0269 0.2658 10.2741 0.9924 0.0707
10 60.5656 1.9667 0.3076 0 0.3079 7.5054 0.9831 0.0948
Max 60.566 2.0636 0.3076 0.0055 0.3079 13.289 0.9924 0.0948
Min 32.118 1.6473 0.224 -0.0269 0.2241 7.4946 0.9241 0.0502
Transient /Impulse /Spike
1 0.0788 1.1817 0.0111 1.95E-5 0.0111 154.191 0.16 1.23E-04
3 0.1243 1.1881 0.0139 3.79E-5 0.0139 158.605 0.1994 1.95E-04
5 0.0272 1.227 0.0065 6.71E-5 0.0065 65.8293 0.0756 4.26E-05
10 0.0398 1.2494 0.0079 7.78E-5 0.0079 95.5889 0.097 6.23E-05
Max 0.1243 1.2494 0.0139 8E-5 0.0139 158.61 0.1994 0.0002
Min 0.0272 1.1817 0.0065 2E-5 0.0065 65.829 0.0756 4E-05
Flicker
1 5.6793 3.3499 0.0942 -4.3E-3 0.0942 2.63 0.2046 0.0089
3 0.7828 2.629 0.035 -4.0E-4 0.035 2.5587 0.0743 0.0012
5 3.31 3.3541 0.0719 0.0023 0.0719 2.5414 0.1528 0.0041
9 2.8042 3.1806 0.0662 -9.0E-4 0.0662 2.6052 0.1428 0.0044
Max 5.6793 3.3541 0.0942 0.0023 0.0942 2.63 0.2046 0.0089
Min 0.7828 2.629 0.035 -0.0043 0.035 2.5414 0.0743 0.0012
Notch
1 1.01E-02 1.1215 4.0E-03 -1.05E-4 4.00E-03 3.2359 1.38E-2 1.58E-05
3 1.24E-02 1.2005 4.4E-03 2.09E-5 4.40E-03 3.2665 1.34E-2 1.94E-05
5 1.26E-02 1.2215 4.4E-03 7.30E-6 4.40E-03 2.8685 1.25E-2 1.98E-05
10 1.14E-02 1.1755 4.2E-03 5.34E-5 4.20E-03 3.5368 1.1E-02 1.78E-05
Max 0.0126 1.2215 0.0044 5E-5 0.0044 3.5368 0.0138 2E-05
Min 0.0101 1.1215 0.004 -0.0001 0.004 2.8685 0.0111 2E-05
Harmonics with Sag
with Oscillatory
transient
1 50.4178 2.101 0.2807 -0.0105 0.2807 12.9796 1.7867 0.0788
3 59.1875 2.9071 0.3041 -0.0001 0.3043 6.7325 1.2398 0.0926
5 2.8157 2.6136 0.0663 0.0001 0.0664 4.5366 0.2484 0.0044
10 55.7278 2.7483 0.2951 0 0.2953 7.3241 1.0325 0.0872
Max 59.188 2.9071 0.3041 0.0001 0.3043 12.98 1.7867 0.0926
Min 2.8157 2.101 0.0663 -0.0105 0.0664 4.5366 0.2484 0.0044
Harmonics with Sag with Flicker
with Oscillatory
transient
1 3.8251 2.9427 0.0773 -0.001 0.0774 8.8354 0.3104 0.006
3 9.8117 3.7501 0.1238 0.0011 0.1239 4.7032 0.5407 0.0154
5 60.4772 3.4884 0.3074 -1.85E-2 0.3071 5.4615 1.235 0.0943
10 8.8603 3.208 0.1177 -0.0014 0.1177 8.5022 0.643 0.0139
Max 60.477 3.7501 0.3074 0.0011 0.3071 8.8354 1.235 0.0943
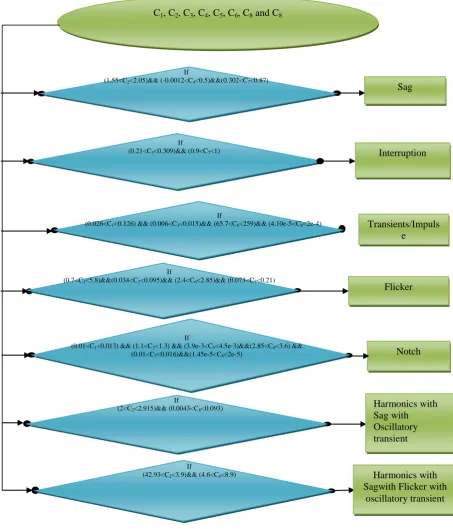
It is easy method to classify and analysis the power quality events under the disturbance and noise conditions for the proposed method which was shown in the fig.6. It shows decision tree for detecting the type of power quality events occurred when the noise is included in the PQ disturbance generated in the system. The PQ events classification with features is mathematically shown in the table 3. For the above decision tree and for events classification, it follows the following algorithm.
Rule-1: If1.55<C2<2.05 &&-0.0012<C4<0.5
&&0.302<C7<0.87 then disturbance isSag
Rule-2: If0.21<C3<0.309 &&0.9<C7<1then disturbance is
Interruption
Rule-3: If0.026<C1<0.126 &&0.006<C3<0.015
&&65.7<C6<259 && 4.10e-5<C8<2e-4then the disturbance
is Transients/impulse/spike
Rule-4: If0.7<C1<5.8 &&0.034<C3<0.095&& 2.4<C6<2.85
&&0.073<C7<0.21then the disturbance is Flicker.
Rule -5: 0.01<C1<0.013 &&1.1<C2<1.3 &&
(3.9e-3<C5<4.5e-3 &&2.85<C6<3.6 &&0.01<C7<0.016&&
1.45e-5<C8<2e-5then the disturbance is Notch
Rule – 6: If2<C2<2.915 &&0.0043<C8<0.093then the
disturbance is Harmonics with Sag with Oscillatory transient
Rule – 7: If42.93<C2<3.9&& 4.6<C6<8.9then the
disturbance is Harmonics with Sag with Flicker with oscillatory transient
With the help of above algorithm, total twenty nine power quality events are tested with the SNR is 50DB electrical noise. The signal which has power quality disturbance and electrical noise are simulated with numerical expressions in the MATLAB. All the power quality events are synthetic signals; each disturbance signal is tested by 1000 times with the above algorithm. The capability of the algorithms can be easily verified by the classification accuracy. To show the performance of the proposed technique, a 7 × 7 confusion matrix is given in Tables 4.The diagonal elements of the confusion matrix are indicates the correctly classified event and the off diagonal elements are indicates the misclassified PQ events. In this matrix all the events shows the 1000 except event M2, because it is overlapping with the previous values
or M1, M5, M7 and M8 are overlapping. This is the drawback of
[image:10.595.310.547.144.676.2]this method and it is unable to classify the all the events.
Table -4 confusion matrix for CDFT with noise
Event name
M1 M2 M5 M7 M8 M9 M10
M1
M2
M5
M7
M8
M9
M10
1000 0 0 0 0 0 0
35 910 27 15 1 3 0 0
0 0 1000 0 0 0 0
0 0 0 1000 0 0 0
0 0 0 0 1000 0 0
0 0 0 0 0 1000 0
0 0 0 0 0 0 1000
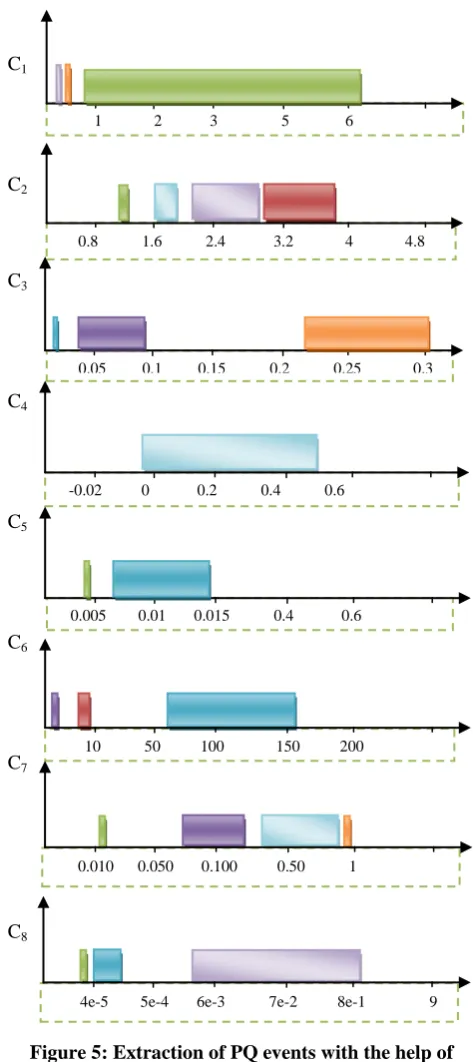
[image:10.595.48.290.582.768.2]Sag Interruptions Transients/impulse/spike Flicker Notch Harmonics with Sag with Flicker Harmonics with Sag with oscillatory C1 C2 C3 C4 C5 C6 C7 C8 Figure 5: Extraction of PQ events with the help of performance indices for CDFT with noise 0.8 1.6 2.4 3.2 4 4.8 1 2 3 5 6
0.05 0.1 0.15 0.2 0.25 0.3 -0.02 0 0.2 0.4 0.6 10 50 100 150 200
0.005 0.01 0.015 0.4 0.6 0.010 0.050 0.100 0.50 1
VII. SIMPLE DECISION TREEBASED POWER QUALITY EVENTS CLASSIFIER FOR CDFT WITH NOISE
Figure 6: A simple decision tree for classification of PQ events with change detection filter with noise Notch
If
(0.01<C1<0.013) && (1.1<C2<1.3) && (3.9e-3<C5<4.5e-3)&&(2.85<C6<3.6) &&
(0.01<C7<0.016)&&(1.45e-5<C8<2e-5)
C1, C2, C3, C4, C5, C6, C8 and C8
Sag
If
(1.55<C2<2.05)&& (-0.0012<C4<0.5)&&(0.302<C7<0.87)
Interruption
If
(0.21<C3<0.309)&& (0.9<C7<1)
Transients/Impuls e
If
(0.026<C1<0.126) && (0.006<C3<0.015)&& (65.7<C6<259)&& (4.10e-5<C8<2e-4)
Flicker
If
(0.7<C1<5.8)&&(0.034<C3<0.095)&& (2.4<C6<2.85)&& (0.073<C7<0.21)
If
(2<C2<2.915)&& (0.0043<C8<0.093) Harmonics with Sag with Oscillatory transient
If
(42.93<C2<3.9)&& (4.6<C6<8.9) Harmonics with Sagwith Flicker with
VIII. WORKING PRINCIPLE OF SYNCHROSQUEEZE WAVELET TRANSFORM (PROPOSED METHOD)
The proposed method (synchrosqueeze wavelet transform) is time-frequency signal algorithm; it is designed to decompose the signals into essential components with time varying oscillatory characteristics. The proposed method is related to the class of time frequency reassignment algorithms and it refines the time scale. Due to this property of SST, used in the finding of instantaneous values in the signal from their time frequency representation [17, 18, 19] A multi component signal can be represented as
Where Xn (t) is Fourier-like oscillatory mode
R (t) is residual signal indicates noise signal/ error signal
(t) n (t) > 0 is continuous differential function
Φn (t) is two times continuously differentiable function
satisfying Φ!
n(t) > 0 and Φ!n+1(t) > Φ!n(t) for all t
SST is a nonlinear operator that sharpens the time frequency plot of a signal’s continuous wavelet transform and enhances the time frequency reassignment method. But still this method retrieves the empirical mode decomposition (EMD) so the CWT of the analytic signal x(t) is given by
Where ‘u’ is the time scale. ‘v’ is the offset time.
‘φ’ is the mother wavelet with positive frequency. Let be a instantaneous frequency is yx (u, v)
Where ‘yl’ is l
th discrete angular frequency, ‘u
k’ is the k th
discrete scale point ∆y = yl-yl-1 and ∆uk =uk – uk-1.
Finally, the instantaneous angular frequency is normalized by 2Π, Then instantaneous frequency is .
To reconstruct the signal two ways are principally used those are direct and ridges. In the ridge reconstruction it is more robust for interference to the noise. In case of direct reconstruction better frequency modulation.
IX. PQEVENTSGENERATIONWITHSST
When the power quality disturbance occurred due to various reasons in the system, due to the PQ disturbance variations in the time- frequency will be takes place, that variations may increase or decrease in the amplitude of that plot [17]. Expression for the PQ signal when the fault is occurred as given by
Where
‘N’ is the number of disturbances in the signal ‘An’ is amplitude of the nth disturbance signal
‘Bn’ is the modulus of the nth amplitude modulation
‘fs’ is the rotational frequency
With the help of synchrosqueez wavelet transform, power quality signals are simulated in the MATLAB, which results are shown in the figure 5. A simulated power quality signals is analyzed as follows to test the performance of the proposed method. According to the equation (b), the simulated signal of the power quality disturbances has been chosen ‘N’ number of faults as
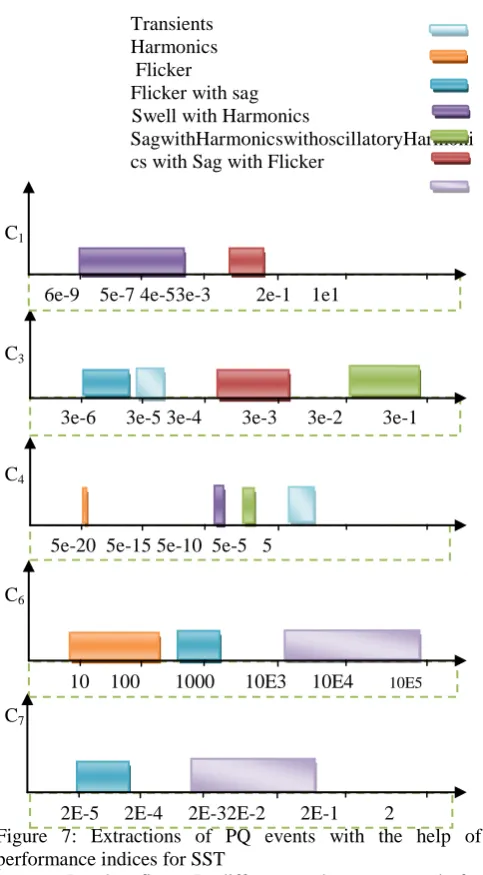
With the help of target features (as discussed in the section IV), few power quality disturbances are extracted from various power quality events as discussed in the section III and VI. The extracted PQ events are Transients/impulse/spike, Harmonics, Flicker, Flicker with sag, Swell with harmonics, Sag with harmonics with oscillatory transients and harmonics with sag with flicker with oscillatory transients. From these PQ events few are discussed in the section III and IV. Rests of the events are flicker with sag and sag with harmonics with oscillatory transients.
Flicker with sag (M11): It is the process of continuous
changing in the supply voltage and it various from the 0.1pu to 0.9pu as shown in the figure 7 (g-h).
Swell with harmonics (M12): Increase RMS voltage from
1.1pu to the 1.8pu for the entire integer multiples of the voltage signals is termed as the Swell with harmonics and it is shown in the figure 7 (i-j).
Sag with harmonics with oscillatory transients (M13): the
instantaneous changes in the voltage or current polarities with the integer multiples of that voltages varies from the 0.1pu to 0.9pu, as shown in the figure 7 (k-l).
Transients/ impulse/ spike (M2), Harmonics (M4), Flicker
(M5) and Harmonics with sag with flicker with oscillatory
transients (M10) are shown in the figure 7 ((a-b), (c-d), (e-f)
Figure: 7 Power quality disturbances with Synchrosqueez wavelet transform (SST) (a-b) Transients/ impulse/ spike, (c-d) Harmonics, (e-f) Flicker, (g-h),Flicker with sag, (i-j) Swell with harmonics, (k-l) sag with harmonics with oscillatory transients and (m-n)Harmonics with Sag with Flicker with Oscillatory Transients
The target features are classified on the rule based model, in this model the idiosyncratic features are found, the above (section IV) all features i.e. C1(energy), C3(RMS), C4(mean),
C6(kurtosis), and C7(maximum peak). With the help of these
X. TARGET FEATURE EXTRACTION WITH SST
Transients Harmonics
Flicker Flicker with sag Swell with Harmonics
SagwithHarmonicswithoscillatoryHarmoni cs with Sag with Flicker
C1
C3
C4
C6
C7
Figure 7: Extractions of PQ events with the help of performance indices for SST
In the figure.7 different colors are used for identification of PQ events. These PQevents will be shown at the top right corner side. On the basis of these target features of PQ events a simple decision treewas build it is discussed in section XI. All these power quality events are classified with the help of table. 7.
With the help of target features (i.e. discussed in the section X)and algorithm (i.e. discussed in the section XI), total twenty nine power quality events are tested with the SST. All PQ signals are simulated with numerical expressions in the MATLAB. All the power quality events are synthetic signals, each disturbance signal is tested by 1000 times with the proposed (SST) algorithm. The capability of the algorithms can be easily verified by the classification accuracy. To show the performance of the proposed technique, a 7 × 7 confusion matrix is given in Tables 6. The diagonal elements of the confusion matrix are indicates the correctly classified event and it is highlighted in the table 6.The off diagonal elements are indicates the misclassified PQ events. This confusion matrix generated with the help of SST algorithm. In this matrix all the events shows the 1000 is in its diagonal, because it doesn’t
[image:14.595.49.291.84.522.2]overlapping with the any previous PQ events. Hence this matrix doesn’t contain any misclassified events.
Table 6: Confusion matrix for SST
Event name M2 M4 M5 M10 M11 M12 M13
M2
M4
M5
M10
M11
M12
M13
1000 0 0 0 0 0 0
0 1000 0 0 0 0 0
0 0 1000 0 0 0 0
0 0 0 1000 0 0 0
0 0 0 0 1000 0 0
0 0 0 0 0 1000 0
0 0 0 0 0 0 1000
[image:14.595.307.548.107.342.2]Table- 7:Performance indices for power quality eventswith SST
Event name Sample
Num
PQ-Indices Energy
Value RMS Mean kurtosis maximum
Transient /Impulse/Spike
1 8.95E-09 8.41E-05 1.51E-01 7.52E+02 5.93E-04
3 1.97E-04 6.15E-05 1.53E-02 5.93E+02 4.15E-04
5 1.00E-12 2.52E-05 7.50E-03 9.16E+02 1.81E-04
10 3.00E-12 4.66E-05 4.00E-04 1.99E+04 3.35E-04
Max 1.97E-04 8.41E-05 1.51E-01 1.99E+04 5.93E-04
Min 1.00E-12 2.52E-05 4.00E-04 5.93E+02 1.81E-04
harmonics
1 2.09E-06 7.49E-05 5.22E-20 32 8.32E-05
3 6.74E-06 2.17E-04 2.96E-19 21.3361 6.29E-04
5 8.42E-06 1.15E-04 1.12E-19 32 4.38E-04
10 4.93E-06 1.10E-04 8.68E-20 7.8362 1.96E-04
Max 8.42E-06 2.17E-04 2.96E-19 3.20E+01 6.29E-04
Min 2.09E-06 7.49E-05 5.22E-20 7.84E+00 8.32E-05
flicker
1 2.69E-10 3.08E-06 2.40E-08 6.24E+02 2.17E-05
3 5.42E-09 2.08E-05 7.73E-08 9.54E+02 1.48E-04
5 3.30E-04 1.35E-05 1.35E-07 5.35E+02 8.57E-05
10 2.57E-10 5.37E-06 1.91E-08 2.06E+03 3.70E-05
Max 3.30E-04 2.08E-05 1.35E-07 2.06E+03 1.48E-04
Min 2.57E-10 3.08E-06 1.91E-08 5.35E+02 2.17E-05
Flicker with Sag
1 2.87E-05 3.16E-04 8.74E-07 2.00E+01 0.0017
3 2.53E-07 1.66E-04 1.97E-07 6.04E+02 0.0011
5 5.82E-07 2.58E-04 1.64E-08 4.61E+02 0.0018
10 6.00E-09 4.07E-05 6.40E-08 1.98E+03 0.0002
Max 2.87E-05 3.16E-04 8.74E-07 1.98E+03 1.80E-03
Min 6.00E-09 4.07E-05 1.64E-08 2.00E+01 2.00E-04
Swell with Harmonics
1 0.327 0.2315 1.33E-06 1.96E+03 0.0019
3 3.09E-04 0.035 5.52E-07 2.32E+02 0.0002
5 0.3465 0.1785 3.96E-06 3.33E+02 0.0011
10 0.0167 0.0624 3.49E-07 7.50E+02 0.0003
Max 3.47E-01 2.32E-01 3.96E-06 1.96E+03 1.90E-03
Min 3.09E-04 3.50E-02 3.49E-07 2.32E+02 2.00E-04
Sag with Harmonics with Oscillatory transient
1 4.84E-04 0.0001 7.20E-05 6.10E+02 0.0011
3 1.44E-04 0.0006 2.53E-06 2.94E+02 0.0005
5 0.0002 0.0044 6.80E-07 2.02E+03 0.0202
10 2.98E-04 0.0002 3.11E-06 1.05E+03 0.0017
Max 4.84E-04 4.40E-03 7.20E-05 2.02E+03 2.02E-02
Min 1.44E-04 1.00E-04 6.80E-07 2.94E+02 5.00E-04
Harmonics with Sag with Flicker
with Oscillatory transient
1 1.50E-06 0.0006 2.37E-06 1.14E+04 0.0059
3 2.70E-06 0.0002 0.0484 3.20E+04 0.0014
5 7.33E-05 0.001 1.34E-05 4.52E+04 0.0068
10 5.70E-04 0.0146 4.66E-05 9.05E+05 0.0594
Max 5.70E-04 1.46E-02 4.84E-02 9.05E+05 5.94E-02
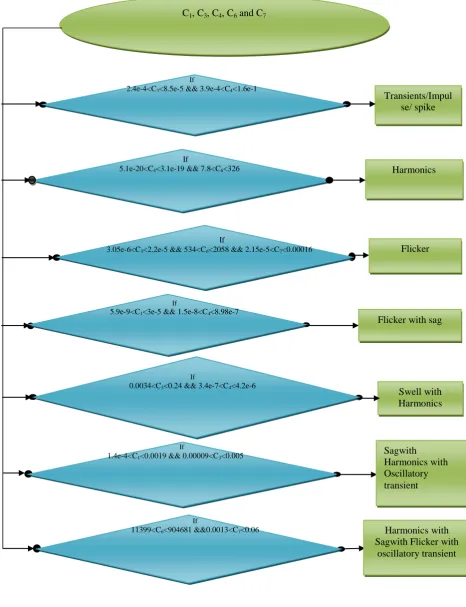
XI. SIMPLE DECISION TREEBASED POWER QUALITY EVENTS CLASSIFIER FOR SST
Figure 8: A simple decision tree for classification of PQ events on the basis of SST
XII. PERFORMANCE
EVALUTION C1, C3, C4, C6 and C7
Flicker
If
3.05e-6<C3<2.2e-5 && 534<C6<2058 && 2.15e-5<C7<0.00016
Swell with Harmonics
If
0.0034<C3<0.24 && 3.4e-7<C4<4.2e-6
Flicker with sag
If
5.9e-9<C1<3e-5 && 1.5e-8<C4<8.98e-7
If
1.4e-4<C1<0.0019 && 0.00009<C3<0.005
Sagwith Harmonics with Oscillatory transient
If
11399<C6<904681 &&0.0013<C7<0.06 Harmonics with
Sagwith Flicker with oscillatory transient
Harmonics
If
5.1e-20<C4<3.1e-19 && 7.8<C6<326
Transients/Impul se/ spike
If
To analyze the performance of the all the (above discussed) techniques it is necessary to calculate the efficiencies of the techniques. It defines the discussed and proposed techniques ability to successfully classify the correct PQ events for the number of target samples. Efficiency can be defined as the ratio of the number of accurate classified data sets to the randomly chosen data sets from the whole set (raw set). The mathematical expression for efficiency is
(I)
After extracting performance indices, their distinctive values are passed through the decision tree based classifier (as shown in fig.3) to classify the PQ events. In this method 1000 random test samples (out of entire 50 data sets) are passed through the decision tree based classifier. After that above equation the efficiency of all the confusion matrixes for the discussed and proposed techniques (i.e. from section II to section XI) are manifested in the table 7.
Table: 7 Efficiency for proposed techniques
S.
No Events
Tested data sets Method/ Algorith m % Efficien cy
1 Interruptions (M1)
1000 rando m data sets are tested out of 130 overall data sets
CDFT 99.78%
2 Transients (M2)
3 Oscillatory Transients (M3)
4 Harmonics (M4)
5 Flicker (M5)
6 Flicker with swell (M6)
7 Notch (M7)
8 Sag (M8)
CDFT WITH NOIS 98.71% 9 Harmonics with Sag with Oscillatory Transient (M9)
10
Harmonics with Sag with Flicker with Oscillatory
Transient (M10)
11 Flicker with sag (M11)
SST 100%
12 Swell with
Harmonics (M12)
13
Sag with Harmonics with Oscillatory Transients (M13)
In the above table 7 have the thirteen distinctive classified PQ events with the help of different algorithms. Actually each algorithm as mentioned above table 7 is distinctively classified 7 types of PQ events but overall PQ events are only thirteen, because of repeat ion. CDFT shows its overall
efficiency is 99.7%, CDFT with noise shows 98.7% and SST shows the 100%. All these are calculated based on the confusion matrixes.
XIII. VALIDATION OF SST ALGORITHIM ON SOLAR BASED MICROGRID
Solar PV generated voltage and currents are given to the DC-DC converter which will converts the variable dc to fixed dc, this fixed dc is fed to the voltage source converter it will converts the dc to ac voltage after that it will be stepped up with the help of transformer then it will be connected to the grid [22]. From grid to utility here 14km feeder is used, in this feeder PQ faults are created with the help of MATLAB/ SIMULINK, the entire process is shown in the figure 9. When the system is in the real time operation it is easily exposed to the faults on its distribution network [13]. Common PQ disturbances in the microgrid distribution networks are [16]
1. Sag 2. Swell 3. Harmonics 4. Transients Grid T/f Solar Farm
14 km feeder
Utility CB1
Figure: 9 Block diagram for Solar based microgrid. Among the above mentioned PQ disturbances the proposed algorithm is focused on the three PQ events, when the system is subjected to real time operation. In this real time operation swell can be generated when the circuit breaker with resistive load is initially switched to open condition then after some time the load is added to the system through circuit breaker, due to this action load is more, then the current drawn from the system is increases and similarly when circuit breaker is initially closed condition it will generates the sag current. With the diode bridge connected to the circuit breaker through the system, due to these power electronic devices harmonics will be generated in the system. Above three events will be passed through proposed algorithm for each phase currents to enhance the efficiency of the SST for the real time operated system as shown in the figure 9 ( 9.1, 9.2 & 9.3).
DC
Figure 9.1 Swell, Sag and Harmonics with SST for phase-A
[image:18.595.59.278.55.380.2]Figure 9.2 Swell, Sag and Harmonics with SST for phase-B
Figure 9.3 Swell, Sag and Harmonics with SST for phase-C
In the figure 9.1, 9.2 and 9.3 the shows the A, B and C phase currents and a, c, and d shows the swell, sag and harmonics respectively for all phases as shown in the above figure. These are passed through the SST algorithm to identify the fault location. All the faults in the graph are between 0.5 second to 1 second. The magnitude of the swell current is between 30A to -40A, the magnitude of the swell current with SST is lies between 0.1A to -0.1A for phase A, 0.1A to -0.1A for phase B, 0.2A to -0.1A for phase C. All these are shown in the figure 9.1, 9.2 and 9.3 likewise for sag and harmonics are also shown in the figure with its magnitude for the period of time is 05sec to 1 sec.
The target features are classified on the rule based model, in this model the idiosyncratic features are found, from the above (section X) all features i.e. C1(energy),
C3(RMS), C4(mean), C6(kurtosis), and C7(maximum peak).
[image:18.595.319.530.55.474.2]With the help of these target features (i.e. discussed in the section X)and algorithm (i.e. discussed in the section XI), total four faults are simulated in the MATLAB. Out of four faults 3 faults are extracted with the help of performance indices, these are shown in the table 9. Table 9 gives the information how the single disturbance is extracted with the help of target features and three phase currents. All these are real time faults, each disturbance signal is tested by 1000 times with the proposed (SST) algorithm. The capability of the algorithms can be easily verified by the classification accuracy. To show the performance of the proposed technique, a 3 × 3 confusion matrix is given in Tables 8.
Table 8: confusion matrix with SST in real time operation
With the help of equation (I) the accuracy of the solar based micro grid when the system is subjected to the various faults is 94.1%. This accuracy is found with the help of above confusion matrix.
When the system is subjected to real time, then it performance decreases as compared to ideal analysis, this was proven with the proposed algorithm according to the table 8. The cause of confusion matrix generation is the following algorithm
Algorithm for SST with real time micrigrid
Rule-1: If0.6<m1<1.95 && 0.014<m2<0.18 && 380<m4<704 then disturbance is swell
Rule-2: If 0.18<m1<0.56 && 0.01<m2<0.014 && 5.5e-6<m3<0.00025 && 0.067<m5<0.08 then disturbance is sag
Rule-3: 795<m4<12715 && 0.09<m5<0.2 then the disturbance is Harmonics.
[image:19.595.94.508.370.655.2]Else The PQ events are non distinctive
Table: 9 Faults extraction with performance indices
S. No. Phase
Currents
Type of
Event Energy RMS Mean Kurtosis
Maximum peaks
1
A
Swell
0.6903 0.0164 8.68E-05 653.44 0.0761
B 0.6042 0.0177 3.6 E-04 703.849 0.1042
C 1.9472 0.0143 1.9e-04 381.3407 0.1332
MIN 0.6042 0.0143 8.68E-05 381 0.076
MAX 1.9472 0.0177 3.60E-04 703 0.133
2
A
Sag
0.5144 0.013 5.54E-06 900.532 0.076
B 0.5560 0.0136 0.0002 624.064 0.0793
C 0.1829 0.0102 4.2E-05 362.1546 0.0679
MIN 0.1829 0.0102 5.54E-06 362 0.679
MAX 0.55 0.0136 0.0002 901 0.0793
3
A
Harmonics
1.9509 0.0226 7.6E-05 797.54 0.1552
B 1.0139 0.0295 6.9e-5 1.2715E+4 0.1815
C 0.2993 0.0105 1.13E-4 884.834 0.0921
MIN 0.2993 0.0105 6.90E-05 797 0.0921 MAX 1.95 0.0295 1.13E-04 12715 0.1815
Event Name
Swell Sag Harmonics
Swell Sag Harmonics
Table 10: comparison between proposed and existing methods
S. No Technique Efficiency
(%)
1 Short time Fourier transform 91.8
2 Wavelet transform with neural network
94.3
3 Discrete Wavelet Transform with ANN [21]
97.8
4 HHT with neural network 97.2
5 Variational mode decomposition with fuzzy decision tree[3]
98.5
6 S- Transform with rule based decision tree with real time
operation [20]
92.1
7 Change detection filter with simple decision tree (proposed)
99.7
8 Change detection filter with noise simple decision tree (proposed)
98.7
9 Synchrosqueeze wavelet
transform (proposed)
100
10 Sinchrosqueezed wavelet
transform with real time operation (proposed)
94.1
From the above discussions (in table 10) it is clear that the compared to other existing techniques proposed methods (i.e. CDFT, CDFT with noise and SST) is exactly classified the PQ events with the help of performance indices without further processing them. Hence the computational complexity of the proposed algorithm is diminished without affecting the efficiency of the proposed algorithm.
XIV. PERFORMANCE EVALUATION
Initially, twenty-nine power quality events were simulated and passed through the signal processing algorithms (i.e. CDFT, CDFT with noise and SST) for generating the target feature sets. After analyzing the target feature sets, it was found that thirteen PQ events are distinctively classified (i.e. with CDFT 7 events, CDFT with noise 7 events and with SST 7 events but due repeating events 13 only considered out of the twenty-nine. The overall classes have been classified by the proposed algorithms with a classification accuracies is shown in the table 7. According to the table 10 CDFT with noise efficiency is reduced when compared to the CDFT because detection and classification of events for noise condition is very difficult but proposed algorithm has given tremendous performance for detection. Which as compared to the conventional methods, the proposed methods are verified to be efficient and superior. One of the shortcomings of the proposed method is that, it is unable to classify the all the twenty-nine events and SST with PV based microgrid efficiency is less compared to ideal condition. This will be resolved with the help of any adaptive classification technique, will be addressed in near future.
In this paper a simple decision tree based power quality disturbance classification techniques have been developed. After processing the raw signals to the proposed algorithms to generate the target feature sets, with this algorithm is fed to decision tree based classifier and it classified the selected power quality events such as sag, swell, interruption,
transients/spike, oscillatory transients, harmonics, flicker, flicker with swell, sag with harmonics, notch, Flicker with sag, Swell with harmonics, Sag with harmonics with oscillatory transients and harmonics with sag with flicker with oscillatory transients are efficiently and distinctively classified, with the help of a simple decision tree classifier. The proposed technique illustrates significant advantages such as better classification efficiency as compared to some existing techniques,as it doesn’t require further processing for classification. Finally, the proposed (SST) technique exhibits lesser computational complexity. The proposed method can employ the PQ monitoring and it is an effective tool for the PQ disturbances detection and classification.
REFERENCES
1. Z. Oubrahim, V. Choqueuse, Y. Amirat and M. E. H. Benbouzid, "Disturbances Classification Based on a Model Order Selection Method for Power Quality Monitoring," in IEEE Transactions on Industrial Electronics, vol. 64, no. 12, pp. 9421-9432, Dec. 2017. 2. Mahela, Om Prakash, and Abdul Gafoor Shaik. "Recognition of
power quality disturbances using S-transform based ruled decision tree and fuzzy C-means clustering classifiers." Applied Soft Computing, vol. 59, pp.243-257, Oct 2017
3. P. D. Achlerkar, S. R. Samantaray and M. Sabarimalai Manikandan, "Variational Mode Decomposition and Decision Tree Based Detection and Classification of Power Quality Disturbances in Grid-Connected Distributed Generation System," in IEEE Transactions on Smart Grid, vol. 9, no. 4, pp. 3122-3132, July 2018. 4. Singh, Utkarsh, and Shyam Narain Singh. "Application of fractional
Fourier transform for classification of power quality disturbances." IET Science, Measurement & Technology, vol. 11, no.1, pp. 67-76, Jan 2017.
5. Eristi, Belkis, et al. "A new embedded power quality event classification system based on the wavelet transform." International Transactions on Electrical Energy Systems, vol. 28, no.9, pp.e2597, Sep 2018.
6. M. Sahani and P. K. Dash, "Automatic Power Quality Events Recognition Based on Hilbert Huang Transform and Weighted Bidirectional Extreme Learning Machine," in IEEE Transactions on Industrial Informatics, vol. 14, no. 9, pp. 3849-3858, Sept. 2018. 7. A. M. Abduljabbar, M. E. Yavuz, F. Costen, R. Himeno and H.
Yokota, “Continuous Wavelet Transform-Based Frequency
Dispersion Compensation Method for Electromagnetic
Time-Reversal Imaging”, in IEEE Transactions on Antennas and Propagation, vol. 65, no. 3, pp. 1321-1329, March 2017
8. K. Thirumala, A. C. Umarikar and T. Jain, "Estimation of Single-Phase and Three-Phase Power-Quality Indices Using Empirical Wavelet Transform," in IEEE Transactions on Power Delivery, vol. 30, no. 1, pp. 445-454, Feb. 2015.
9. Li, Jianwen, et al. "Research on power quality disturbance identification and classification technology in high noise background." IET Generation, Transmission & Distribution (2019).
10. D. Camarena-Martinez, M. Valtierra-Rodriguez, C. A.
Perez-Ramirez, J. P. Amezquita-Sanchez, R. de Jesus
Romero-Troncoso and A. Garcia-Perez, "Novel Down sampling Empirical Mode Decomposition Approach for Power Quality Analysis," in IEEE Transactions on Industrial Electronics, vol. 63, no. 4, pp. 2369-2378, April 2016.
11. Liu, Huawu, et al. "Fast and flexible selective harmonic extraction methods based on the generalized discrete Fourier transform." IEEE Transactions on Power Electronics, vol. 33, no.4 3484-3496, Apr 2018.
12. Y. H. Gu and M. H. J. Bollen,
time-scale domain analysis of voltage disturbances," in IEEE Transactions on Power Delivery, vol. 15, no. 4, pp. 1279-1284, Oct. 2000.
13. R. S. H., S. R. Mohanty, N. Kishor and A. T. K., "Real-Time Implementation of Signal Processing Techniques for Disturbances Detection," in IEEE Transactions on Industrial Electronics, vol. 66, no. 5, pp. 3550-3560, May 2019.
14. IEEE Recommended Practice for Monitoring Electric Power Quality, IEEE 1159-1995 (R2001), 1995.
15. F. A. S. Borges, R. A. S. Fernandes, I. N. Silva and C. B. S. Silva, “Feature Extraction and Power Quality Disturbances Classification Using Smart Meters Signals,” in IEEE Transactions on Industrial Informatics, vol. 12, no. 2, pp. 824-833, April 2016.
16. Chakravorti, Tatiana, Rajesh Kumar Patnaik, and Pradipta Kishore Dash. "Detection and classification of islanding and power quality disturbances in microgrid using hybrid signal processing and data mining techniques." IET Signal Processing, vol. 12, no.1, pp. 82-94. Aug 2017.
17. G. W. Chang, Y. Chen and Y. Lin, "A Synchrosqueezing Transform-Based Hybrid Method for Voltage Fluctuations Assessment," in IEEE Transactions on Power Delivery, vol. 33, no. 5, pp. 2541-2550, Oct. 2018.
18. Li, Chuan, and Ming Liang. "A generalized synchrosqueezing transform for enhancing signal time–frequency representation." Signal Processing vol.92, no 9, pp: 2264-2274, 2012. 19. Wang, Shibin, et al. "Matching synchrosqueezing wavelet transform and application to aeroengine vibration monitoring." IEEE Transactions on Instrumentation and Measurement, vol. 66, no. 2, pp: 360-372, Feb 2017.
20. R. Kumar, B. Singh, D. T. Shahani, A. Chandra and K. Al-Haddad,
"Recognition of Power-Quality Disturbances Using
S-Transform-Based ANN Classifier and Rule-Based Decision Tree," inIEEE Transactions on Industry Applications, vol. 51, no. 2, pp. 1249-1258, March-April 2015.
21. A. Abdullah, "Ultrafast Transmission Line Fault Detection Using a DWT-Based ANN," inIEEE Transactions on Industry Applications, vol. 54, no. 2, pp. 1182-1193, March-April 2018.
Dhar, Snehamoy, and Pradipta Kishore Dash. "Adaptive threshold based new active islanding protection scheme for multiple PV based microgrid application." IET Generation, Transmission & Distribution vol. 11 no. 1
pp: 118-132 Jan 2017.
AUTHORS PROFILE
Kanche Anjaiah: Received B.Tech degree in EEE from SKIST affiliated by JNTUH (Sree Kavitha Institute of Science and Technology), Madhira in 2015. He worked as a polytechnic lecturer with 2 years experience in Vijaya Engineering College, currently pursuing M Tech in GMRIT, Rajam.His area of interest is protection of on renewable energy based microgrids
.