Int. J. Electrochem. Sci., 11 (2016) 5267 – 5278, doi: 10.20964/2016.06.93
International Journal of
ELECTROCHEMICAL
SCIENCE
www.electrochemsci.org
Synthesis and Characterization of LiNi
1/3Co
1/3Mn
1/3O
2as
Cathode Materials for Li-Ion Batteries via an Efficacious
Sol-Gel Method
Xiaoyu Cao1,*, Yang Zhao1, Limin Zhu1, Lingling Xie1, Xiaoli Cao2, Shaoyi Xiong3, Chiwei Wang4,*
1
School of Chemistry and Chemical Engineering, Henan University of Technology, Zhengzhou 450001, People’s Republic of China
2
School of Electronics and Information Engineering, Sias International University, Zhengzhou 451150, People’s Republic of China
3
Zhenghou Ruineng Electric Co. Ltd., Zhengzhou 450001, People’s Republic of China 4
Tianjin EV Energies Co. Ltd., Tianjin 300380, People’s Republic of China *
E-mail: [email protected]; [email protected]
Received: 2 April 2016 / Accepted: 29 April 2016 / Published: 4 May 2016
A series of LiNi1/3Co1/3Mn1/3O2 powders have been successfully prepared as cathode materials for lithium-ion batteries by a citric acid-assisted sol-gel method. The crystal structures and microstructures of as-prepared cathode materials were characterized by X-ray diffraction and scanning electron microscopy. Charge/discharge cycling and cyclic voltammetry were also employed to investigate their electrochemical behaviors. X-ray diffraction results show that calcinations temperature and time have the important effects on the crystal structure of LiNi1/3Co1/3Mn1/3O2 powders. Among all the LiNi1/3Co1/3Mn1/3O2 powders, the LiNi1/3Co1/3Mn1/3O2 powder calcined at 850 oC for 16 h demonstrates a phase-pure hexagonal lattice with the best ordered layered structure. Scanning electron microscopy with element mapping tests reveal that the homogeneous LiNi1/3Co1/3Mn1/3O2 solid solution has been achieved via this synthesis method. The LiNi1/3Co1/3Mn1/3O2 powder heated at 850 o
C for 16 h can deliver a high initial discharge capacity of 199.9 mAh g−1 and still retain the discharge capacity of 143.6 mAh g−1 after 80 cycles at the current rate of 20 mA g−1 in the voltage range of 2.5−4.6 V. Cyclic voltammetry results confirm that as-obtained LiNi1/3Co1/3Mn1/3O2 powder at 850 oC for 16 h displays the decreased electrode polarization and stable crystal structure upon cycling.
Keywords: LiNi1/3Co1/3Mn1/3O2; Cathode materials; Sol-gel synthesis; Characterization; Lithium-ion batteries; Electrochemical performances
1. INTRODUCTION
higher demand for LIBs, including high working voltage, large discharge capacity, and excellent cycle performance [1]. At present, the major bottlenecks of improving the electrochemical performances of LIBs lie in the cathode materials with unsatisfied properties. Therefore, the development and optimization of the high performance cathode materials are very essential to improve the electrochemical performances of LIBs. Among the known cathode materials, LiCoO2 is the first large-scale commercialized cathode material [2]. However,Li+ ions only take off up to 0.5 unit of quantity from LiCoO2 when LiCoO2 is used as cathode material in LIBs application. At a voltage higher than 4.3 V, delithiated Li1-xCoO2 will react with the electrolyte and cobalt element will dissolve in the electrolyte, which results in the crystal structural collapse and then deteriorates its electrochemical properties. Thus, the actual capacity of LiCoO2 is around 140 mAh g−1 [3−6]. And not only that, the application of LiCoO2 is limited by high market price and slight toxicity of Co element. LiNi1/3Co1/3Mn1/3O2 (NCM) with similar structure as LiCoO2 has been widely studied as one of the most promising cathode material [7−10] because it possesses a high synergistic effect that Ni element could raise the charge/discharge capacity, Co element could decrease cation mixing, and Mn element could reduce the cost, thus enhancing its applicability, security and stability [7,11,12].
Nowadays, there are various methods concerning synthesis of NCM cathode material such as solid-state synthesis method [13,14], hydrothermal synthesis method [15], thermal polymerization method [16], rheological phase reaction method [17], flame spray pyrolysis method [18], co-precipitation method [19,20,21], and sol-gel method [9,22,23]. Among these synthesis methods, the co-precipitation method and sol-gel method are widely used and expected to put into use in industrialized production. The two methods have some merits such as homogenous incorporation of reactants at the molecular level, easy preparation of nanomaterials with regular chemical composition, and relatively simple operation.
However, it is reported that the preparation of NCM precursor needs the inert atmosphere protection, accuracy control of the PH of the reaction solution and reaction rate, repeated removal of the precipitates, and prolonged reaction time through the co-precipitation method [19,21]. In contrast, it is relatively simple to synthesize NCMby the sol-gel method [9], however, it also needs to control the PH of the reaction solution and add the nonionic surfactant to the reaction solution, which leads to long drying time for NCM precursor and ordinary experimental reproducibility. Therefore, this work is focused on the further exploration and optimization of fabrication method of NCM materials, and making high performances layered NCMcathode materials via a more efficacious sol-gel method.
2. EXPERIMENTAL
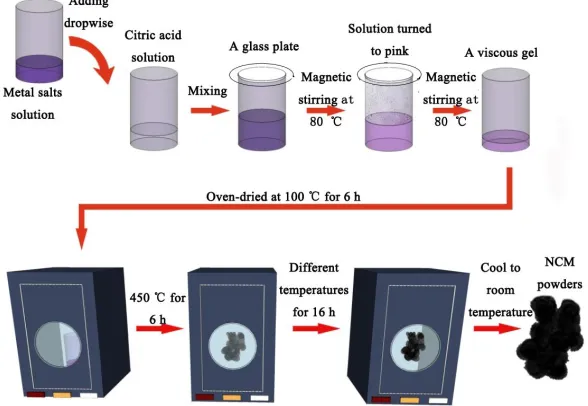
of the beaker in order to prevent excessive water evaporation. It was not removed until the mixing solution turned to pink. Then the reaction continued to form a viscous gel. Thirdly, the resulting gel was oven-dried at 100 oC for 6 h to obtain NCM precursor. The NCM precursor was pre-heated at 450 o
C for 6 h under air atmosphere in a muffle furnace. Afterwards, the pre-heated NCM materials were ground into fine powder, which was calcined at different temperatures (700, 750, 800, 850, 900, and 950 oC) for 16 h under air atmosphere in a muffle furnace and then naturally cooled to room temperature to obtain final NCM powders. For the sake of convenience, the six NCMsamples were designated as 700-16, 750-16, 800-16, 850-16, 900-16, and NCM-950-16, respectively.
Thermogravimetric (TG) analysis of the NCM precursor was measured on a LIN-SEIS STA PT 1600 apparatus in the temperature ranging from room temperature to 1000 oC at a heating rate of 10 oC min–1 under air. The phase structures of the NCM samples were determined on a D/Max-2500 X-ray diffractometer (XRD, Rigaku, Japan) with Cu Kα radiation (λ=1.54056 Å). The microstructures and morphologies of the NCM samples were characterized by a JSM-6510LV scanning electron microscope (SEM, JEOL, Japan). Energy dispersive spectroscopy (EDS) mapping was measured to investigate the element distribution.
[image:3.596.163.457.238.441.2]To examine the electrochemical properties of resultant NCM samples, standard CR2016 coin cells were assembled under argon atmosphere in a JMS-3 glove box (Nanjing Jiumen Automation Technology Co., Ltd). The cathode films were composed of 80 wt.% of active NCM powder, 10 wt.% of super P as a conductive agent and 10 wt.% of polytetrafluoethylene (PTFE, 60wt%) micro-emulsion as a binder. The working electrodes were prepared by loading the cutting disc films with a diameter of 1.0 cm into the cleaned and polished aluminum meshes, and then they were pressed under the pressure of 10 MPa for 1 minute to fabricate cathode. Lithium sheet (China Energy Lithium Co., Ltd) was served as the negative electrode, and commercial polyethylene (PE) microporous film (ND420H129-100, Asahi Kasei Chemical Co.) was used as the separator. The electrolyte solution was 1 mol dm−3
Figure 1. Schematic diagram of synthesis of NCM samples by a sol-gel method
LiPF6 dissolved in a mixture of ethylene carbonate (EC) and dimethyl carbonate (DMC) (1:1 by volume, provided by zhangjiagang Guotai-Huarong New Chemical Materials Co., Ltd).
The galvanostatic charge/discharge cycles were carried out at the current rate of 20 mA g−1 and in the voltage range from 2.5 to 4.6 V on a battery testing system (CT2001A, Wuhan LAND Electronics Co., Ltd) at room temperature. The cyclic voltammetry (CV) curves were obtained on a CHI660D electrochemical workstation (Shanghai Chenhua Crop.) at a scanning rate of 0.1 mV s−1 on the potential interval of 2.5−4.6 V.
3. RESULTS AND DISCUSSION
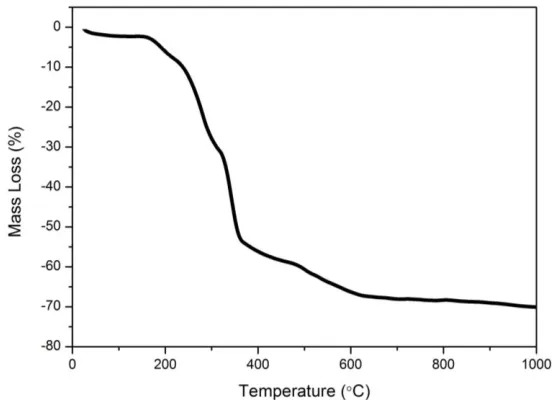
[image:4.596.147.424.433.633.2]Fig. 2 shows TG curves of the NCM precursor operated under air atmosphere. As illustrated in Fig. 2, the weight loss process can be divided into three stages. The first one from room temperature to 200 oC is ascribed to the release of adsorbed water and bonded water in the NCM precursor. The second weight loss occurred in the range of 200−380 oC may be closely involved in the volatilization of CO, CO2 and H2O from the NCM precursor. Subsequently, the weight loss between 380 and 700 oC originates from the pyrolysis of the remaining citric acid and the formation of crystalline NCM. From700 to 900 oC, no apparent weight loss can be observed in the TG curve, prefiguring the final formation of NCM. Above 900 oC, the weight loss seems to become evident again, which may be attributed to some side reactions leading to NCM decomposition. According to the TG results, we choose the calcinations temperature of the NCM precursor below 1000 oC.
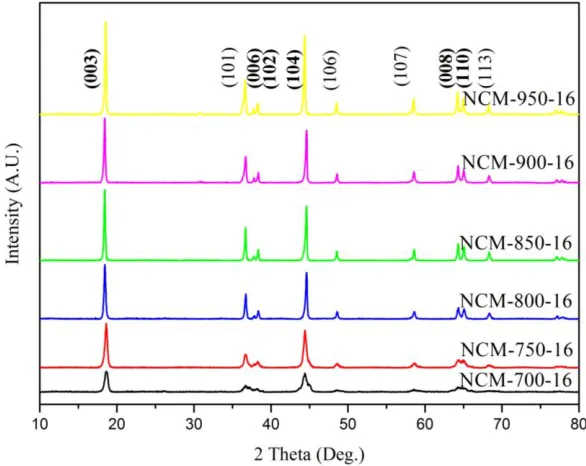
Fig. 3 displays the XRD patterns of the NCM samples in the 2θ range of 10°–80°. All diffraction peaks are indexed as the hexagonal α-NaFeO2 crystal structure with a space group of R-3m. The characteristic diffraction peak position of as-prepared NCM samples is also consistent with the previous literature [24], which means that the NCM samples with layered structure can be successfully prepared by the improved sol-gel method. With the increase of the calcination temperatures, the
Figure 2. TG curves of the NCM precursor.
diffraction peak intensity becomes much stronger. And meanwhile, according to the reports [25,26], the growth status of the layered structure of NCM samples can be judged by the splitting degree of the doublets (006)/(102) and (108)/(110). As seen in Fig. 3, double peak splitting of (006)/(102) and (108)/(110) becomes more apparent with the increase of the calcinations temperature, indicating the better layered structure and crystallinity for the as-prepared NCM samples [27]. Furthermore, as a rule, the high ratios of c/a and I(003)/I(104) are desirable for the well-defined hexagonal layered structure [28]. The lattice parameters calculated for the NCM samples are summarized in Table 1. As shown in Table 1, the ratio of c/a for all the NCM samples is larger than 4.9, indicating a well-ordered hexagonal structure [26]. At the same time, both c/a and I(003)/I(104) of NCM-850-16 sample display maximum value, indicating an ideal layered structure for NCM sample [28]. When the calcinations temperature is raised to 900 and 950 oC, fine impurity peak located at around 2θ-31o are found. Compared with the standard JCPDS card of NCM, the impurity peak may be attributed to Co2O3 or Mn3O4 substance, which shows that the crystal structure of NCM samples may be reconstructed due to lithium volatilization or other side reactions when the calcinations temperature is over 900 oC. From Table 1, in comparison with NCM-850-16 sample, the c/a and I(003)/I(104) of NCM-900-16 and NCM-950-16
[image:5.596.152.445.355.588.2]samples begin to become small, exhibiting the enhanced cation mixing at the high temperatures.
Figure 3. XRD patterns of NCM samples synthesized at different temperatures for 16 h.
Table 1. The lattice parameters for NCM samples obtained at different temperatures for 16 h
NCM samples a (Å) c (Å) c/a V (Å3) I(003)/I(104)
[image:5.596.90.506.662.752.2][image:6.596.127.468.323.681.2]
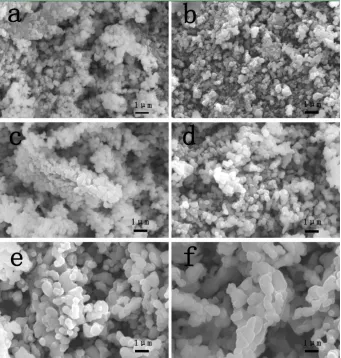
The morphology of NCM samples obtained at various calcinations temperatures were observed using a SEM, and the results are shown in Fig. 4. As seen in Fig. 4, the particle shape changes with the calcinations temperature. NCM-700-16 and NCM-750-16 samples display inhomogeneous particle distribution and obscure grain boundary. Combined with XRD data in Fig. 3 and Table 1, it is believed that the order layered crystal structure of the NCM-700-16 and NCM-750-16 samples is not yet fully developed. When the calcinations temperature is increased to 850 oC, the as-prepared NCM-850-16 sample with the average particle size of about 250 nm has a reasonable and uniform particle size distribution. Moreover, the particles agglomeration of NCM-850-16 sample is relatively low. It is well known that uniform small particle size and particle size distribution is conducive to the rapid migration of Li+ ions and electrons, which will help NCM-850-16 sample achieve excellent electrochemical performances. As the calcinations temperature is further increased to 900 and 950 oC, the particle size of NCM-900-16 and NCM-950-16 samples becomes larger, and many primary particles gather together and form some large secondary particles, which goes against the Li+ ions diffusion, and accordingly increases the electrode polarization and worsens the electrochemical properties [29,30].
Figure 4. SEM images of NCM samples synthesized at different temperatures for 16 h. (a) 700-16, (b) 750-700-16, (c) 800-700-16, (d) 850 -700-16, (e) 900-700-16, and (f) NCM-950-16.
[image:7.596.158.470.195.564.2]
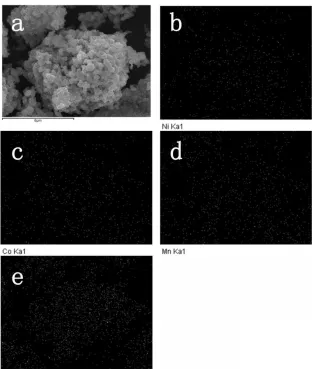
Elemental mapping of NCM-850-16 particles was obtained by EDS. SEM of NCM-850-16 sample which is chosen to do EDS measurement is shown in Fig. 5 (a). Fig. 5 (b–e) shows the elemental mapping of Ni, Co, Mn, and O in NCM-850-16 sample. As shown in Fig. 5, a homogeneous distribution of the Ni, Co, Mn, and O elements can be observed in NCM-850-16 sample, which demonstrates that these elements have achieved homogeneous solid solution and confirms the advantages of the sol–gel synthesis method in this work.
Fig. 6 shows the initial charge/discharge curves of the as-prepared NCM samples in the voltage range of 2.5−4.6 V at the current rate of 20 mA g−1. As seen in Fig. 6, all the charge/discharge curves have a voltage platform located at around 3.6−3.9 V, which is in accord with the typical layer structured NCM. The NCM-700-16, NCM-750-16, NCM-800-16, NCM-850-16, NCM-900-16, and NCM-950-16 show the initial charge/discharge capacities of 229.1/169.3, 223.7/181.7, 225.0/188.0, 234.3/199.9, 227.8/188.9, and 220.1/182.2 mAh g−1, respectively. And the coulombic efficiency of NCM samples is 73.8%, 81.2%, 83.5%, 85.3%, 82.9%, and 82.7%, respectively. The irreversible capacity loss may be mainly attributed to the cations mixing in NCM structure [24]. Among these NCM samples, NCM-850-16 sample manifests the highest discharge capacity and coulombic
Figure 5.SEM image (a) and elemental mapping (b-e) of NCM-850-16 sample
efficiency, which is higher than that of the NCM samples reported in literature [31]. In addition, it is evident from Fig. 6 that NCM-850-16 sample has the lowest charge platform and the highest discharge platform, indicating the decreased electrode polarization.
The 40th charge/discharge curves of MCM samples in the voltage range of 2.5−4.6 V at the current rate of 20 mA g−1are depicted in Fig. 7. As shown in the Fig. 7, charge/discharge capacities of the NCM-700-16, NCM-750-16, NCM-800-16, NCM-850-16, NCM-900-16, and NCM-950-16 samples at the 40th cycle are 129.6/128.1, 151.5/149.9, 159.0/157.5, 169.5/168.4, 155.9/154.4, 155.9/153.2 mAh g−1, respectively. The corresponding coulombic efficiency of NCM samples is 98.8%, 98.9%, 99.0%, 99.3%, 99.0%, and 98.2%, respectively, which is close to 100% and suggests
Figure 6.The initial charge/discharge curves of MCM samples
Figure 7.The 40th charge/discharge curves of MCM-850-16 samples
that irreversible capacity loss is decreased upon cycling. Furthermore, it is found that all the NCM samples demonstrate much smoother charge/discharge curves after 40 cycles in comparison with the initial charge/discharge curves in Fig. 6, implying that the phase transition experienced by the NCM samples during the repeated Li+ ions intercalation/deintercalation process becomes more smoothly. At the same time, NCM-850-16 still bears the highest charge/discharge capacities and coulomb efficiency. It is not difficult to explain the phenomenon mentioned above in Fig. 6 and Fig. 7. In the case of the NCM-700-16, NCM-750-16, and NCM-800-16 samples, low charge/discharge capacities obviously stem from their no well-defined crystal structures and agglomerated particles [24]. As for the NCM-800-16 sample whose charge/discharge capacities are next to the best NCM-850-16 sample, the cations mixing is reduced and particles are gradually dispersed. As far as the NCM-900-16 and NCM-950-16 samples are concerned, their particles are beginning to merge and grow, which will allow Li+ ions to move a more prolonged distance in the host material and correspondingly aggrandize the electrode polarization [29]. However, it is worth mentioning that, NCM-900-16 sample demonstrates more well-defined layered crystal structure related to the NCM-800-16 sample in Table 1. Hereby, a roughly equivalent cycleability is presented for the NCM-800-16 and NCM-900-16 samples, which are to follow up on Fig. 8.
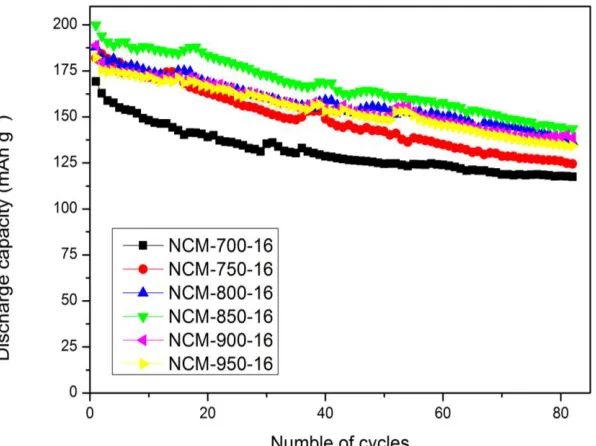
[image:9.596.141.439.375.598.2]Fig. 8 shows the cycling performance of NCM samples in the voltage range of 2.5−4.6 V at the current rate of 20 mA g−1. It can be seen that the 700-16, 750-16, 800-16, NCM-850-16, NCM-900-16, and NCM-950-16 samples deliver the 80th discharge capacities of 117.5, 124.5, 136.4, 143.6, 138.7, and 134.2 mAh g−1, which are higher than that of the pristine NCM samples reported in literature [21]. With the increase of the calcinations temperature, cycling performance is improved, especially for NCM-850-16 who achieves the best cycling performance. With further increase of the calcinations temperature to 900 oC, discharge capacity and cycling performance of
Figure 8. Discharge capacity curves of NCM samples as a function of cycle number.
NCM-900-16 and NCM-950-16 samples also tend to decrease. But all the same, the cycling performance of the NCM-700-16 and NCM-750-16 samples is still poor, which should be ascribed to the half-grown layered crystal structure and low crystallinity. Therefore, it is concluded that the calcinations temperature has an important influence on the comprehensive electrochemical performances of NCM samples in this work, which mainly determines the crystal structure and particle morphology of NCM samples. In order to further explore the effect of calcinations time on the electrochemical performances of NCM samples, experiments regarding the preparation of NCM samples at 850 oC for other different time (8 h, 24 h, and 32 h; simply called 8, NCM-850-24, and NCM-850-32) and evaluation of the electrochemical performances have been conducted. However, NCM-850-8, NCM-850-24, and NCM-850-32 samples do not show more ordered layered crystal structure compared with NCM-850-16 sample, and the electrochemical performances of them are worse than that of NCM-850-16 sample (See ESI, Figure S1 and Figure S2). Considering the comprehensive electrochemical performances, energy consumption, and production cost, the optimal preparing condition for NCM samples in this study is set at 850 oC for 16 h.
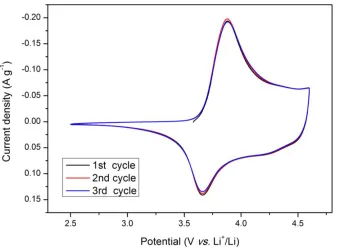
[image:10.596.113.452.322.572.2]Fig. 9 shows the CV curves of NCM-850 -16 sample for the first three cycles. It is found that there is a typical pair of redox peaks in the potential range of 3.6–4.0 V, which should be attributed to the redox couples of Ni2+/Ni4+. The well defined redox peaks reflects a high crystallinity for the NCM-850-16 sample, which is very important to be demonstrated a good electrochemical performance. The oxidation peak at around 3.854 V could be mainly attributable to Ni2+/Ni4+, and the reduction peak at around 3.694 V should be mainly ascribed to Ni4+/Ni2+, which keeps in step with the charge/discharge platforms in Fig. 6. The small potential interval (ΔEP) of anodic and cathodic peaks (0.16 V) discloses that the redox reaction and the electron transfer are very easy during the Li+ ions intercalation/deintercalation process [11].
Figure 9. CV curves of NCM-850-16 sample for the first three cycles.
4. CONCLUSIONS
The citric acid-assisted sol-gel method is used to synthesize NCM samples as cathode materials for LIBs application. It is found that the calcinations temperature and time of NCM samples have the significant effects on their crystal structure, morphology, and electrochemical behaviors. The relation between crystal structure, particle morphology and electrochemical performances is systematically investigated. Of the as-prepared NCM samples, the NCM-850-16 sample exhibits a highly ordered layered structure and small particle size with a reasonable and uniform particle size distribution. As a consequence, the highest first charge/charge capacities and good cycleability are achieved for the NCM-850-16 sample. In particular, the excellent CV characteristics imply that the NCM-850-16 sample prepared through this sol-gel method has the stabilized crystal structure and can be used as a promising cathode material in LIBs. Research on further improving the electrochemical behaviors of NCM cathode materials will be reported elsewhere.
ACKNOWLEDGEMENTS
This work was supported by Innovation Scientists and Technicians Troop Construction Projects of Zhengzhou City, China (No. 131PLJRC652), NNSF of China (No. 21403057), Ph.D. Programs Foundation of Henan University of Technology (No. BS150535), Plan for Scientific Innovation Talent of Henan University of Technology, China (No. 2012CXRC09), Fundamental Research Funds for the Henan Provincial Colleges and Universities, China (Nos. 2014YWQN03 and 2015RCJH10).
References
1. J. M. Tarascon, M. Armand, Nature, 414 (2001) 359.
2. K. Mizushima, P. C. Jones, P. J. Wiseman, J. B. Goodenough, Mater. Res. Bull., 15 (1980) 783. 3. G. G. Amatucci, J. M . Tarascon, L. C. Klein, Solid State Ionics, 83 (1996) 167.
4. J. Akimoto, Y. Gotoh, Y. Oosawa, J. Solid State Chem., 141 (1998) 298. 5. Y. Oh, J. G. Lee, B. Kim, B. Park, Electron. Mater. Lett., 4 (2008) 9.
6. Y. I. Jang, N. J. Dudney, D. A. Blom, L. F. Allard, J. Electrochem. Soc., 149 (2002) A1442. 7. T. Ohzuku, Y. Makimura, Chem. Lett., 30 (2001) 642.
8. M. Armand, J. M. Tarascon, Nature, 451 (2008) 652.
9. Z. D. Huang, X. M. Liu, S. W. Oh, B. Zhang, P. C. Ma, J. K. Kim, J. Mater. Chem., 21 (2011) 10777.
10. C. Venkateswara Rao, A. Leela Mohana Reddy, Y. Ishikawa, P. M. Ajayan, ACS Appl. Mater. Inter., 3 (2011) 2966.
11. Y. Koyama, I. Tanaka, H. Adachi, Y. Makimura, T. Ohzuku, J. Power Sources, 119–121 (2003) 644.
12. B. J. Hwang, Y. W. Tsai, D. Carlier, G. Ceder, Chem. Mater., 15 (2003) 3676. 13. J. Liu, W. Qiu, L. Yu, H. Zhao, T. Li, J. Alloys Compd., 449 (2008) 326. 14. H. Meng, B. Huang, J. Yin, X. Yao, X. Xu, Ionics, 43–49 (2015) 21. 15. J. Xie, X. Huang, Z. Zhu, J. Dai, Ceram. Int., 36 (2010) 2485.
16. C. X. Ding, Q. S. Meng, L. Wang, C. H. Chen, Mater. Res. Bull., 44 (2009) 492. 17. H. Ren, Y. Wang, D. Li, L. Ren, Z. Peng, Y. Zhou, J. Power Sources, 178 (2008) 439. 18. J. H. Kim, J. H. Yi, Y. N. Ko, Y. C. Kang, Mater. Chem. Phys., 134 (2012) 254.
Julien, J. Power Sources, 196 (2011) 8632.
21. C. Gong, W. Lv, L. Qu, O.E. Bankole, G. Li, R. Zhang, M. Hu, L. Lei, J. Power Sources, 151– 155 (2014) 247.
22. A. Milewska, M. Molenda, J. Molenda, Solid State Ionics, 192 (2011) 313. 23. Y. Hu, Y. Zhou, J. Wang, Z. Shao, Mater. Chem. Phys., 129 (2011) 296. 24. F. Wu, M. Wang, Y. Su, L. Bao, S. Chen, J. Power Sources, 195 (2010) 2362.
25. T. Cho, S. PARK, M. Yoshio, T. Hirai, Y. Hideshima, J. Power Sources, 142 (2005) 306.
26. X. Zhang, W. J. Jiang, A. Mauger, Qilu, F. Gendron, C. M. Julien, J. Power Sources, 195 (2010) 1292.
27. I. Taniguchi, D. Song, M. Wakihara, J. Power Sources, 109 (2002) 333. 28. B. J. Hwang, R. Santhanam, C. H. Chen, J. Power Sources, 114 (2003) 244. 29. C. Cheng, L. Tan, H. Liu, X. Huang, Mater. Res. Bull., 46 (2011) 2032.
30. S. Jouanneau, K. W. Eberman, L. J. Krause, J. R. Dahn, J. Electrochem. Soc., 150 (2003) A1637. 31. H. U. Kim, D. R. Mumm, H. R. Park, M. Y. Song, Electron. Mater. Lett., 6 (2010) 91.
[image:12.596.203.377.303.436.2]
ELECTRONIC SUPPLEMENTARY INFORMATION (ESI)
Figure S1. XRD patterns of NCM samples calcined at 850 oC for different time. The inset is the lattice parameters for NCM samples.
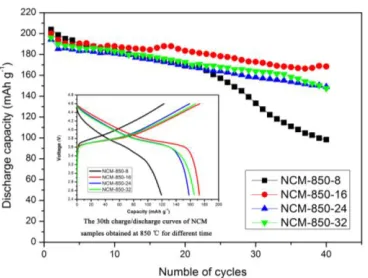
Figure S2. The cycleability of NCM samples calcined at 850 oC for different time. The inset is the 30th charge/discharge curves of NCM samples.
[image:12.596.199.383.509.648.2]