R E S E A R C H A R T I C L E
Open Access
Estimating the effectiveness and
cost-effectiveness of establishing additional
endovascular Thrombectomy stroke
Centres in England: a discrete event
simulation
Peter McMeekin
1, Darren Flynn
2, Mike Allen
3, Diarmuid Coughlan
4, Gary A. Ford
5,6,7, Hannah Lumley
7,
Joyce S. Balami
6, Martin A. James
3,8, Ken Stein
3, David Burgess
9,10and Phil White
7*Abstract
Background:We have previously modelled that the optimal number of comprehensive stroke centres (CSC)
providing endovascular thrombectomy (EVT) in England would be 30 (net 6 new centres). We now estimate the relative effectiveness and cost-effectiveness of increasing the number of centres from 24 to 30.
Methods:We constructed a discrete event simulation (DES) to estimate the effectiveness and lifetime cost-effectiveness (from a payer perspective) using 1 year’s incidence of stroke in England. 2000 iterations of the simulation were performed comparing baseline 24 centres to 30.
Results:Of 80,800 patients admitted to hospital with acute stroke/year, 21,740 would be affected by the service reconfiguration. The median time to treatment for eligible early presenters (< 270 min since onset) would reduce from 195 (IQR 155–249) to 165 (IQR 105–224) minutes. Our model predicts reconfiguration would mean an additional 33 independent patients (modified Rankin scale [mRS] 0–1) and 30 fewer dependent/dead patients (mRS 3–6) per year. The net addition of 6 centres generates 190 QALYs (95%CI−6 to 399) and results in net savings to the healthcare system of £1,864,000/year (95% CI -1,204,000 to £5,017,000). The estimated budget impact was a saving of £980,000 in year 1 and £7.07 million in years 2 to 5.
Conclusion:Changes in acute stroke service configuration will produce clinical and cost benefits when the time taken for patients to receive treatment is reduced. Benefits are highly likely to be cost saving over 5 years before any capital investment above £8 million is required.
Keywords:Thrombectomy, Acute stroke, Predictive models, Health economics
Background
Endovascular thrombectomy (EVT) in the treatment of acute ischaemic stroke resulting from large artery occlusion (LAO) significantly improves independent (good) outcomes with a modified Rankin Scale (mRS) score of 0–2 - from 25 to 50% [1]. It has been shown to be cost-effective, but
requires specialist facilities, expertise and training. Conse-quently, EVT is available only in comprehensive stroke cen-tres (CSCs) and is not currently equally accessible to the entire English population. Structural inequalities describe situations where patients with similar capacities to benefit from treatment do not, because of the way services are organised. In the case of EVT, one goal, amongst others, of health care providers such as NHS Commissioners is to reduce structural inequalities by mitigating the effects of geography on outcomes, in particular due to differences in time to initiation of treatment.
© The Author(s). 2019Open AccessThis article is distributed under the terms of the Creative Commons Attribution 4.0 International License (http://creativecommons.org/licenses/by/4.0/), which permits unrestricted use, distribution, and reproduction in any medium, provided you give appropriate credit to the original author(s) and the source, provide a link to the Creative Commons license, and indicate if changes were made. The Creative Commons Public Domain Dedication waiver (http://creativecommons.org/publicdomain/zero/1.0/) applies to the data made available in this article, unless otherwise stated.
* Correspondence:[email protected]
7Institute of Neuroscience, Newcastle University, 3-4 Claremont Terrace,
Newcastle upon Tyne, UK
Currently EVT rates (5.5 per 1000 ischaemic strokes) place the United Kingdom on a par with countries in Eastern Europe and the Balkans and behind Western Europe, where EVT rates can exceed 50 per 1000
ischae-mic strokes [2]. In 2018–19, 1200 EVT procedures were
recorded in England, Wales and Northern Ireland in the national stroke audit (SSNAP) (approximately 1.4% of all
ischaemic strokes) [3]. To address this shortfall in
provision, the NHS England Long Term Plan describes the objective of a 10-fold increase in this figure by 2022
[4]. To achieve this both the number of comprehensive
stroke centres will need to increase as well as then num-bers of EVTs carried out at these centres. A more de-tailed analysis of the path to achieving this figure is
provided in “Thrombectomy: An Implementation Guide
for Commissioners & Healthcare Providers”[5].
In a previous modelling study [6] we identified, by means of genetic algorithms, an optimal configuration for a ‘Drip and Ship’paradigm across England, aiming to initiate defini-tive treatment (intravenous thrombolysis [IVT] or EVT) as soon as possible. In England, the‘Drip and Ship’paradigm denotes a treatment regimen in patients in whom IVT is ini-tiated at the nearest primary stroke centre (PSC) and trans-ferred to a CSC as soon as possible. We assumed that 50 such PSCs exist in England reflecting current policy recon-figuration intentions. The algorithm used in our previous paper identified the need for seven new comprehensive stroke centres and the downgrading of one by means of a genetic algorithm. The algorithm identified which of the existing primary stroke centres should be upgraded by look-ing at the geography of their constituency of patients. To prevent the algorithm identifying an optimal provision that involved upgrading every primary stroke centre to a compre-hensive stroke centre, it was subject to a maximum and minimum number of stroke patients (hence EVTs) that any potential comprehensive stroke centre could undertake. These were based on national guidelines that recommend the minimum number of admissions to a primary or com-prehensive stroke centre is 600 patients per year [7] and that travel to first point of stroke care should be ideally 30 min or less, and no more than 60 minutes [8]. Additionally; to provide a robust 24/7 EVT service realistically requires at least five operators, and all five could not hope to meet mini-mum activity levels to maintain competence if EVT volume was less than 150 procedures. There is no guideline on the maximum size of a primary or comprehensive stroke centre, but NHS England guidance recommends a maximum of 1500 admissions for a single team, and the largest centre currently in the England has about 2000 admissions [9].
We concluded that, subject to the model constraints, one optimal solution would be to increase the number of CSCs providing EVT in England from 24 to about 30, by closing one clinically unsustainable centre in London and opening seven new centres across England. With 30
CSCs, structural inequality was substantially reduced; 52% of the population in England would be within 30 min travel of a centre compared with 43% (82% versus 71% within 45 min, and 93% versus 86% within 60 min), reducing the impact of geography on outcomes. For the remainder, these constitute sparsely populated areas, dis-tant from CSCs where helicopter transfer may provide a better solution to reducing inequality [10].
Methods
Aim
By means of an economic model, we aim to provide add-itional information to support the implementation of rec-ommendations for EVT service expansion [11]. Specifically, to complement previous estimates of sustainability and in-creased equity, we sought to estimate the health economic impact (clinical effectiveness and cost-effectiveness) of in-creasing the number of CSCs from 24 to 30. Clinical effect-iveness was estimated in terms of the changes in mRS in treated patients and cost-effectiveness in terms of cost per quality adjusted life- year (QALY) from a payer perspective.
Modelling approach
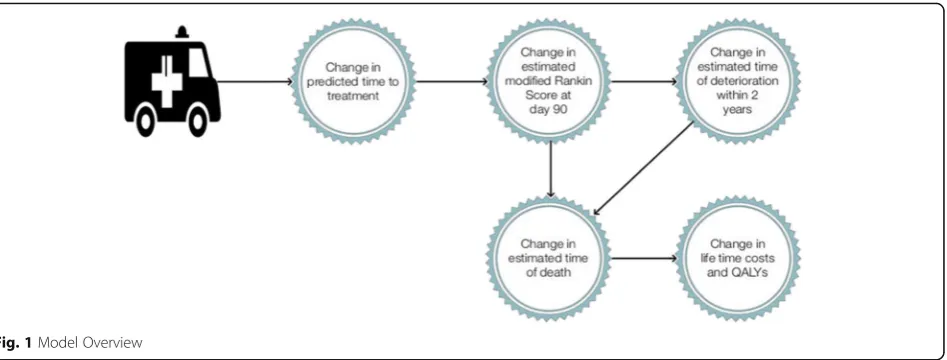
Informed by development work undertaken from our previ-ous modelling [6,12], we developed a discrete event simu-lation (DES) model to estimate the relative effects and cost-effectiveness that accrue from increasing the number of CSCs centres in England. Discrete Event Simulations are one of the most common modelling techniques and, its use is increasing in Health Technology Assessment (HTA) [13–16]. We chose DES as the modelling technique in pref-erence to Markov models [17]. The latter typically models relatively crude changes in mRS categories (0–2, 3–5 and 6) and is computationally burdensome; whereas a DES en-ables modelling across each of the seven mRS states rela-tively effecrela-tively. A DES creates one estimate of the time an event occurs rather than a set of probabilities of an event occurring over time. Unlike a Markov model, probabilities of events are not estimated at regular intervals; in a DES events occur according to their probabilities of occurrence over time. The DES was iterated 2000 times for each per-son in the population that would be affected by the change in service configuration. The mean outcomes were aggre-gated to estimate the marginal effects, before and after pro-posed service change, at the population level, as well as to quantify uncertainty around these estimates.
Model structure and assumptions
patients alive at 90-days; an event occurs at a random time in the future; where time of event is a function of a patient’s 90-day mRS status. If that event is further de-terioration in mRS, then death occurs at a subsequent time in the future based on age and subsequent mRS status which increases mortality risk. For the purposes of this DES model, deterioration could only occur in years 1 to 5 and resulted in an increase in mRS.
The DES repeatedly modelled each of the affected stroke patients’journeys and the mean costs and effects were used as estimates of lifetime cost-effectiveness. Each repeated simulation drew a random set of parameters to reflect the uncertainty around eligibility, journey times, costs and out-comes. Each simulation equates to a single point on a cost-effectiveness plane for the entire cohort of patients influ-enced by the service change. In this DES model, EVT ineli-gible patients would be unaffected by the change in EVT provision and were excluded from the simulation to reduce computational burden. The benefit of shorter times to EVT provision accrues in the model only for early presenters (presenting≤270 min since onset) with National Institutes for Health Stroke Severity Scale score (NIHSS)≥6, through shorter times to treatment; this and other fixed assump-tions of the model are listed in Table1.
The simulation was implemented in R as 2-dimensional matrix: The first dimension representing patients, where each EVT eligible patient was included 2000 times repre-senting the number of simulation runs. The second di-mension represented the patients attributes including invariant data items such as age, sex and variant items such as time to treatment, the main predictor of clinical outcome, under each scenario and times and types of events under each scenario. The use of parametric survival functions mean the DES runtime was effectively the life time of each patient, although this was truncated when a patient reached 100 years. For memory efficiency, the data.table package was used. The DES effectively consisted of the creation of this matrix, its manipulation (by a set of
R functions) and its processing to report outcomes. No other libraries or packages were used. The matrix con-struct was chosen as it allowed the use of vector operations.
The model’s empirical internal validity was assessed de-terministically by testing both the individual components of the model and the processing of the matrix to estimate the marginal cost and QALY implications: Modelled out-comes (for 90 day modified Rankin, survival, deterioration and consequent costs and QALYs) were compared to a values computed independently of the model.
In keeping with our previous study that identified the potential location of the additional centres, no changes in IVT pathways were assumed to occur. However, we assumed a reduction of 30 min between IVT and EVT procedure when patients did not require transfer from a primary stroke centre (PSC) to a CSC.
Data sources
We utilised data from Northumbria Healthcare NHS Foundation Trust (NHFT) with moderate to severe LAO stroke to reflect variability in early presenters’ onset to door time, whilst maintaining the differential in time to treatment due to differing secondary transfer times in each scenario. NHFT serves a mixed population - the ma-jority live in urban or semi-urban locations near to stroke units, and a minority live in more distant rural areas. We obtained anonymised data about 600 consecutive patients
presenting with NIHSS scores of ≥6 with confirmed
LAOs. Of these, 440 patients presented early (≤270 min) with a median presentation of 85 min (IQR 60–133) [19]. During each of the 2000 simulations, we sampled with re-placement from this distribution to estimate initial presen-tation time of an early presenting patient.
[image:3.595.66.540.87.267.2]PSC to a CSC centre or vice versa. Outcomes for late presenters (> 270 min from onset) were not estimated in our model as outcomes were assumed to be relatively time invariant; no published information yet exists about the association between time to treatment and outcome in“all comer” late presenter populations: The DAWN trial [20] considered outcomes in patients presenting between 6 and 24 h and estimated absolute treatment effect in this period based on clinical imaging mismatch and independ-ently of time to treatment. This small group (DAWN &/or DEFUSE-3 eligible) is therefore excluded in our model of marginal effects [18,21].
Simulation parameters are shown in Table2. Long-term outcomes were those reported in the Oxford Vascular
Study (OXVASC) [22] study which estimated survival
from 90 day mRS for patients experiencing a major stroke
[23]. We estimated death by combining the results of
OXVASC study (for mortality 90 days to five years after stroke) with mortality data from national life tables [24] and data from the Lothian stroke register [25] about the increased mortality associated with stroke survivors de-pending on their 90 day mRS, using a knotted spline
tech-nique to extrapolate survival [26]. This generates a
different set of extrapolated parametric survival curves for each iteration of the simulation from which the time to death could be calculated from the uniform randomly drawn probability of death [27]. To allow for improve-ments in survival since the Lothian stroke register data was collected, we applied a reduction in mortality of 25% from year 6 onwards. This was obtained from a longitu-dinal study that reported composite mortality rates after stroke falling by 20% from 9.3 to 7.4% [28]. The mean me-dian and inter-quartile range survival for each mRS across all simulation runs, for a 70 year old stroke patient, based on this is shown in Table2. Our model also allowed for deterioration within the first five years. We included data from OXVASC study about increases in dependency, as measured by mRS by calculating an annualised probability of an increase of at least two points if the 90 day mRS was 3 or less, and 1 if 90 day mRS was 4 or more. Combining this with survival data resulted in a combined probability of death or deterioration, with a further random variable used to determine whether deterioration or death were the first event experienced during each simulation; Each probability was rescaled to sum to one (i.e. a 20% chance of death at the time the event occurred and a 5% chance of deterioration were rescaled to 0.8 and 0.2) and the event decided by a random draw between 0 and 1.
Costs associated with each level on the mRS in the first year after stroke and subsequent years came from a longitudinal study of 569 stroke patients in Belgium [29], converted to British Pounds (sterling) using the Or-ganisation for Economic Co-operation and Development
(OECD)purchasing parity index [30] and inflated to
2017 prices using the Hospital and Community Health
Services (HCHS) index [31]. The cost of EVT were
de-rived from a UK micro costing study [32], ambulance
costs from the Personal Social Services Research Unit (PSSRU). The uncertainty around cost estimates is cap-tured by using a gamma distribution to reflect the right skewed nature of the data. Where no standard deviations for costs were available the method of Briggs et al. [33] was used, whereby the standard error was assumed to be the same value of the mean. Utility scores which reflect quality of life were modelled using a beta distribution to reflect their bounded nature between zero and one and
were those reported in the MR CLEAN study [34].
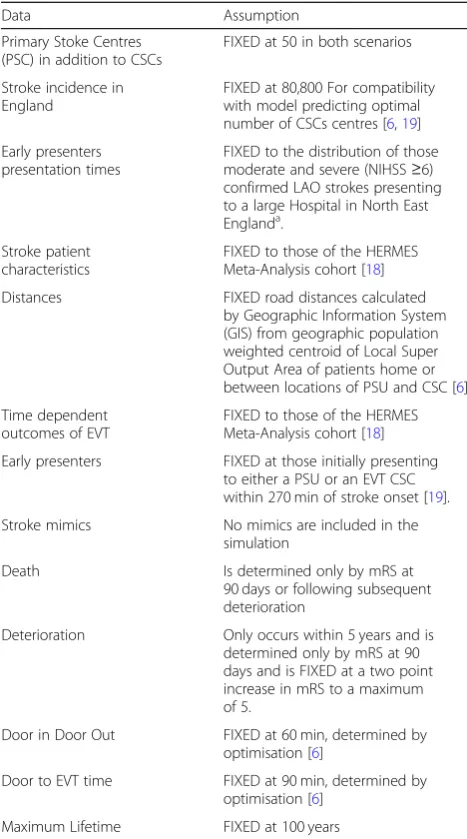
[image:4.595.56.290.98.518.2]Ran-dom draws of cost and utilities associated with mRS were generated using copulas to maintain the correlation Table 1Fixed Modelling Assumptions
Data Assumption
Primary Stoke Centres (PSC) in addition to CSCs
FIXED at 50 in both scenarios
Stroke incidence in England
FIXED at 80,800 For compatibility with model predicting optimal number of CSCs centres [6,19]
Early presenters presentation times
FIXED to the distribution of those moderate and severe (NIHSS≥6) confirmed LAO strokes presenting to a large Hospital in North East Englanda.
Stroke patient characteristics
FIXED to those of the HERMES Meta-Analysis cohort [18]
Distances FIXED road distances calculated
by Geographic Information System (GIS) from geographic population weighted centroid of Local Super Output Area of patients home or between locations of PSU and CSC [6]
Time dependent outcomes of EVT
FIXED to those of the HERMES Meta-Analysis cohort [18]
Early presenters FIXED at those initially presenting to either a PSU or an EVT CSC within 270 min of stroke onset [19].
Stroke mimics No mimics are included in the
simulation
Death Is determined only by mRS at
90 days or following subsequent deterioration
Deterioration Only occurs within 5 years and is
determined only by mRS at 90 days and is FIXED at a two point increase in mRS to a maximum of 5.
Door in Door Out FIXED at 60 min, determined by
optimisation [6]
Door to EVT time FIXED at 90 min, determined by
optimisation [6]
Maximum Lifetime FIXED at 100 years
a
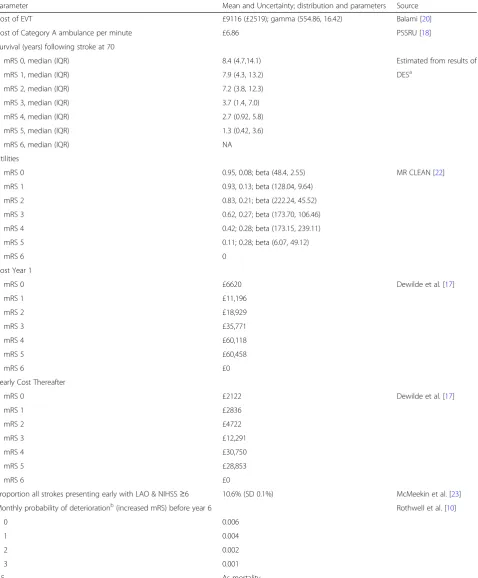
Table 2Simulation Parameters
Parameter Mean and Uncertainty; distribution and parameters Source
Cost of EVT £9116 (£2519); gamma (554.86, 16.42) Balami [20]
Cost of Category A ambulance per minute £6.86 PSSRU [18]
Survival (years) following stroke at 70
mRS 0, median (IQR) 8.4 (4.7,14.1) Estimated from results of
mRS 1, median (IQR) 7.9 (4.3, 13.2) DESa
mRS 2, median (IQR) 7.2 (3.8, 12.3)
mRS 3, median (IQR) 3.7 (1.4, 7.0)
mRS 4, median (IQR) 2.7 (0.92, 5.8)
mRS 5, median (IQR) 1.3 (0.42, 3.6)
mRS 6, median (IQR) NA
Utilities
mRS 0 0.95, 0.08; beta (48.4, 2.55) MR CLEAN [22]
mRS 1 0.93, 0.13; beta (128.04, 9.64)
mRS 2 0.83, 0.21; beta (222.24, 45.52)
mRS 3 0.62, 0.27; beta (173.70, 106.46)
mRS 4 0.42; 0.28; beta (173.15, 239.11)
mRS 5 0.11; 0.28; beta (6.07, 49.12)
mRS 6 0
Cost Year 1
mRS 0 £6620 Dewilde et al. [17]
mRS 1 £11,196
mRS 2 £18,929
mRS 3 £35,771
mRS 4 £60,118
mRS 5 £60,458
mRS 6 £0
Yearly Cost Thereafter
mRS 0 £2122 Dewilde et al. [17]
mRS 1 £2836
mRS 2 £4722
mRS 3 £12,291
mRS 4 £30,750
mRS 5 £28,853
mRS 6 £0
Proportion all strokes presenting early with LAO & NIHSS≥6 10.6% (SD 0.1%) McMeekin et al. [23]
Monthly probability of deteriorationb(increased mRS) before year 6 Rothwell et al. [10]
0 0.006
1 0.004
2 0.002
3 0.001
4,5 As mortality
a
Estimated from modelled mortality based on OXVASC, UK lifetables, Lothian Stroke Register
b
of the parameter. A copula is a multivariate probability distribution where the marginal probability distribution of each variable is uniform and typically used to describe the dependence between random variables. For example, a simulation run never occurs where the utility associ-ated with mRS 3 is greater than mRS 2.
Reporting clinical effectiveness and cost-effectiveness
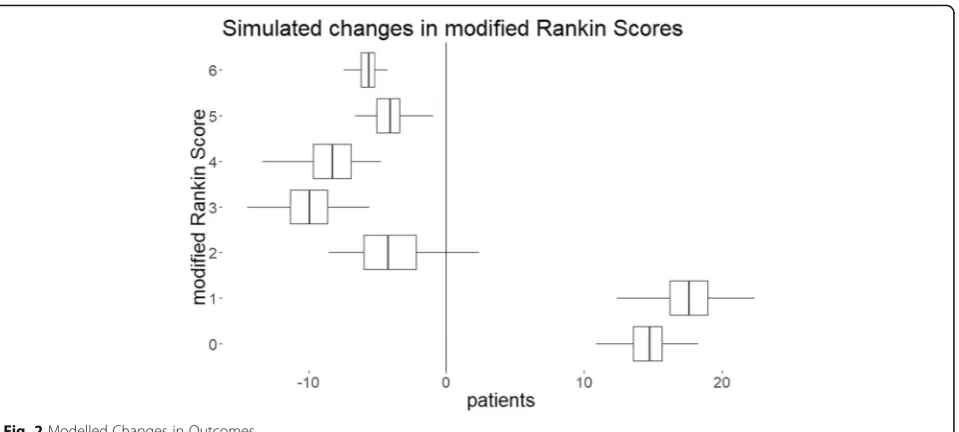
In reporting clinical effectiveness, the DES model esti-mates the mean number of patients whose mRS scores would change as a result of service reconfiguration. Similarly, in reporting cost-effectiveness, the marginal cost and the marginal QALYs for each simulation run are used to calculate the incremental cost-effectiveness ratio (ICER). The mean costs and mean QALYs repre-sent the outcomes across the patients that are affected by the EVT service reconfiguration.
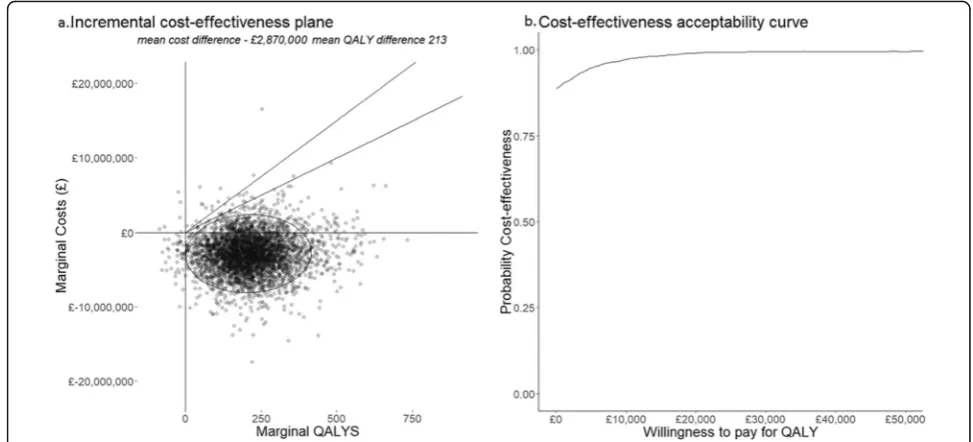
Uncertainty and sensitivity analyses
For visualising the uncertainty around clinical effectiveness, a plot shows the estimated number of patients with changes in mRS scores if EVT service reconfiguration is adopted. The cost-effectiveness of each simulated outcome across the cohort are shown on an incremental cost-effectiveness plane. Uncertainty around cost-effectiveness (cost per QALY) is explored by means of a cost-effectiveness accept-ability curve (CEAC) which shows the probaccept-ability that the proposed EVT service reconfiguration is cost-effective at in-creasing willingness-to-pay thresholds. QALYs that result from the proposed reconfiguration are valued at the thresh-old and added to any cost savings to estimate a net financial benefit. Furthermore, the proportion of simulations of the service reconfiguration whose net benefit fall below the threshold represents the probability that is cost-effective. If a simulation is cost-saving and results in a QALY loss, those QALYs are also valued at the threshold and included in the net benefit calculation.
The Willingness to Pay (WTP) for a QALY is derived from the notion of acceptable thresholds of cost-effectiveness. It is a construct that monetises on health gains which are added to any financial savings or consequences of healthcare intervention. The greater the willingness to pay (WTP) for a QALY, the more likely an intervention that generates health gains is to be deemed cost effective. There is no explicit threshold, but in England the WTP for a QALY is estimated to be between £20,000 and £30,000 [35]. These amounts have been inferred from decisions taken by the National Institute for Clinical Effectiveness.
We also undertook three one-way sensitivity analyses. Firstly, we replaced cost per mile with the current
esti-mated average Ambulance mission Tariff to £234 [30].
Secondly, we varied by ±1% the proportion of early pre-senting patients with moderate-to-severe LAO strokes and finally we varied the age of patients by ±5 years. The
average age at first stroke, for all sub-types, in the UK was reported in 2008 as 77 years in women and 71 years in men [36] and therefore older than the patients in the HERMES meta-analysis that formed our base case. Our model assumes that the patients included in our simula-tion had the same properties as those included in the HERMES [19] analysis of time to treatment: 66 years we varied the age of patients within our simulation, the only effect of this was on post 90 day survival and deterior-ation. We implicitly assumed that EVT outcomes for eli-gible patients were invariant with age across the range of our sensitivity analysis.
The DES was created in R and the flexsurv library was used to fit appropriate parametric functions to survival data. The copula library was used to generate random multivari-ate distributions using copulas and parametric margins.
Results
The results of the simulation are summarised in Table3. We estimate that 21,740 stroke patients would be af-fected by the change in service configuration from 24 to 30 CSCs with a fixed number of 50 PSCs in England. Of these the mean number of patients treated with EVT would be 2540 (SD 7); the median time to treatment for (EVT eligible) early presenters would reduce from 195 (IQR 155–249) to 165 (IQR 105–224) minutes. 2316 (SD 4.5) patients would benefit from shorter secondary transfer times but 222 (SD 2.0) patients would addition-ally face a secondary transfer (due to the service recon-figuration from 24 to 30 by creating 7 new centres and closing an existing one).
The effectiveness and cost-effectiveness results are presented graphically in Figs. 2 and 3. Across the 2000 simulations, reconfiguration from 24 to 30 CSC results in 32 individuals estimated to benefit from reduced
de-pendency or death (Table 3 and Fig. 2). 14 of these
Table 3Simulation Results
Outcome Estimate
Mean time to treatment reduction (SD) 42 min (SD 63)
Changes in population mRS (n) *
0 15
1 18
2 -4
3 -10
4 −8
5 −8
6 −4
Marginal Lifetime QALY gains across English pop. 213 (95% CI 28, 447)
Marginal Lifetime costs to NHS England -£2,870,000 (95% CI -£7,946,000 to £2,051,000)
Net Benefit at £20,000 per QALYb £7,123,000 (95% CI £1,039,000 to £13,666,000)
Net Benefit at £25,000 per QALYb £8,187,000 (95% CI £1,609,000 to £ 15,684,000)
Net Benefit at £30,000 per QALYb £ 9,250,000 (95% CI £1,983,000 to £ 17,532,000)
Budget Impact Analysis
Year 1 -£981,000(95% CI -£2,067,000 to £218,000)
Years 2 to 5 (discounted) - £1,186,000 (95% CI -£3,587,000 to £1,187,000)
Sensitivity Analyses expressed as change in Net Benefit at £25,000 willingness to pay for QALY
Use of Ambulance Tariff £20,000
1% increase in LAO incidence £93,000
1% decrease in LAO incidence -£72,000
Mean age at stroke−5 years (65) £1,023,000 22 additional QALYs, additional savings of £473,000
Mean age at stroke + 5 years (75) -£934,000 27 fewer QALYs, reduction in savings of £259,000
a
Rounded to nearest number of patients
b
Net benefit is calculated by deducting the‘value’of QALYs generated from increased costs
[image:7.595.61.541.507.723.2]Figure3b shows the CEAC at willingness to pay thresh-olds for QALYs from £0 to £50,000. At £0 this is 89%, reflecting the number of simulations resulting in costs in the lower-left, cost-saving and QALY positive, quadrant of the cost-effectiveness plane, Fig. 3a. Uncertainty about cost-effectiveness is not reached at any threshold because of simulations that result in estimates in the south-west quadrant. As willingness to pay for a QALY increases, the financial compensation required for a lost QALY rises. As willingness to pay increases, willingness to accept in-creases, more simulations in the upper-right quadrant be-come cost effective and fewer simulations in the lower-left quadrant remain cost effective.
The results of the one-way sensitivity analyses (Table 3) show that using a common tariff for secondary trans-fer, did not change QALY outcomes and decreased net benefit by £20,400, reflecting the lower average costs and transfer distances associated with a per mile cost compared with the common ambulance tariff. Increasing the proportion of patients eligible for EVT presenting early from 10.6 to 11.6% increased net benefit to £92, 700. This resulted from an additional 3 QALYs and a further saving of healthcare costs of £17,000. Decreasing eligibility to 9.6% reduced QALY gains by 2 and increasing healthcare costs by £21,600 resulting in a £71,600 loss in net benefit. Reducing the mean age of patients from 70 to 65 increases QALY gains by 22 and increases health and social care savings by £472, 700; resulting in an increase in net benefit of £1,022, 700. Conversely, increasing the age of patients to 75 results in 27 fewer QALYs and reduces savings by £259,500. This equates to reduction in net benefit of £934,500.
Discussion
Increasing the number of CSC providing EVT in England from 24 to 30 would deliver health gains within current thresholds of cost-effectiveness with a very high probability of being cost-effective. The magnitude of overall gains in health and in cost savings are driven by significant changes in outcomes in a small number of patients. Our model shows that, as expected, a reduction in time to EVT is char-acterised by a shift towards better outcomes. Our results confirm that net benefit is significantly influenced by the costs of future healthcare, and in turn this is influenced by the longer term mortality of stroke patients. Our model was only sensitive to patient age beyond 90 days, 90 day outcomes were those of HERMES meta-analysis. If increas-ing age was associated with poorer outcomes, the modelled decreased decrease in benefit may be even greater.
The modelled effectives in terms of improved mRS scores and cost-effectiveness in terms of cost per QALY and net benefit should be considered along with informa-tion about reducinforma-tions in structural-inequity and budget impact that the proposed change in service configuration delivers. Our model shows that in each year, a saving of £1 million pounds will be made because of improved out-comes in patients treated that year. In years 2 to 5 these improved outcomes will result in a further £1.2 million saving equating approximately to a £8 m return on invest-ment over five years. Currently commissioners must also consider reductions in structural inequality alongside cost-effectiveness without information about how society would value any reduction. In a parallel ongoing study we intend to elicit societal preferences in order to‘value’these reductions, and thereby include them in a subsequent net benefit calculation using our DES model.
[image:8.595.53.540.88.309.2]Strengths and limitations
Our model is the first DES based economic evaluation to use individual mRS scores as outcomes rather than crude changes in mRS categories. Our model is therefore more in line with outcomes used in randomised control trials and more relevant to routine stroke care. Our ana-lysis took a payer perspective and ignored implications to the wider economy. In an employed population an outcome of mRS 0 suggests that a patient would be able to return to work, and as such it would be feasible to in-clude wages not forgone if the analysis were from a soci-etal perspective. The use of population mortality data in combination with mRS related mortality allows the model to predict longer-term outcomes.
Our analysis used as an exemplar, one potential opti-mised configuration of 30 CSCs derived from our earlier geographical modelling work, chosen from among many possible options [6]. The new configuration involved clos-ing down one unit, which means that some patients expe-rienced longer times to treatment and concomitant worse outcomes. We included simulations which result in sce-narios where the outcome of reconfiguration resulted in both cost savings and QALY losses as generating a net benefit. Because over each simulation run the costs and QALYs were summed to estimate the net effect and be-cause of the 7:1 ratio of centres opening to centres closing, at the population level only a small number of scenarios resulted in cost savings and QALY losses, which were never judged cost-effective at any threshold. However, at the individual patient level within a simulation summing QALY losses and QALY gains, it is equivalent to assuming an equal value of a QALY lost as a QALY gained. If soci-ety places more value on a QALY lost than it would pay for a QALY gain, our estimates of net benefit are biased in favour of the new service configuration. In contrast, we also assumed that, in the absence of other information that the decline in treatment effect of EVT over time was linear. If the relationship between effect and time is not linear, as for thrombolysis for ischaemic stroke, then our
model potentially underestimates the gains from
expedited access to EVT: The benefits estimated in the HERMES meta-analysis included some patients with sal-vageable brain tissue identified by advanced imaging and therefore more likely to benefit. These patients tended to be among those treated later and this will contribute to an underestimate of the decline in treatment effect over time. Outcomes for LAO treated by EVT were estimated from the data from the HERMES group, and as such our esti-mated outcomes are those of a 70 year old patient and do not account for uncertainty over time. Changing the age of patients in our model takes no account of outcome of EVT dependent on age, and simply increases benefit due to increased life expectancy. As a consequence the uncer-tainty in our model is only that of financial consequences
and post 90-day mortality and morbidity. Our model also ignored any benefits that might accrue to patients present-ing outside the thrombolysis window. Whilst there is no published estimates of how benefit changes with time to treatment in this group, benefits may result from quicker access to treatment. Furthermore the additional thromb-ectomy centres may be better placed to identify eligible late presenters and provide treatment.
Although out model has seven eventual outcome states, it does not reflect changes within states and therefore un-derestimates treatment gains as improvements within mRS states are not accounted for in the DES. This is a feature of a DES, however the mean costs and effects should not differ from a Markov Model where individuals are apportioned across states. Our model includes no costs associated with setting up new centres. This is equivalent to assuming that investments to upgrade centres can be financed through in-come; however, that is the actual approach NHS England has taken to introducing EVT of LAO stroke as a routine service into the existing 24 English CSCs.
Conclusion
Increasing the number of CSCs in England from 24 to 30 would be effective and highly likely to be both cost-effective and cost-saving. The net benefit from patients treated in one year to the NHS would be between £7 mil-lion and £9 milmil-lion. In cash terms the savings are esti-mated to be over £2 million over five years. The proposed reorganisation would therefore yield a return on invest-ment over five years of £8 million, notwithstanding initial capital costs to establish new centres. The magnitude of savings is dependent on the longer term survival of stroke patients and less sensitive to the numbers of eligible pa-tients and the costs associated with ambulance transfer.
Abbreviations
CEAC:cost-effectiveness acceptability curve; CSC: comprehensive stroke centres; EVT: endovascular thrombectomy; HCHS: Hospital and Community Health Services; HERMES: Highly Effective Reperfusion Using Multiple Endovascular Devices Collaboration; HTA: Health Technology Assessment; ICER: incremental cost-effectiveness ratio; LAO: Large Artery Occlusion; mRS: modified Rankin score; NHFT: Northumbria Healthcare NHS Foundation Trust; NHS: UK National Health Service; NIHR: National Institute for Health Research; OECD: Organisation for Economic Co-operation and Development; PISTE: `The Pragmatic Ischaemic Thrombectomy Evaluation trial; PSC: Primary Stroke Centre; PSSRU: Personal Social Services Research Unit; QALY: Quality Adjusted Life Year; STABILISE: Stroke: an evaluation of thrombectomy in the ageing brain; WTP: Willingness to pay
Acknowledgements
We would like to express our thanks to Professor Luke Vale, for advice on manuscript drafting, Clare Bowes for administrative and the staff of Northumbria Healthcare Foundation Trust who provided access to anonymised routine clinical data about presentation times.
Authors’contributions
revised manuscript; GAF Conceived and designed the analysis and revised the manuscript; HL commented and revised the manuscript; JSB Contributed data and analysis tools; MAJ commented and revised the manuscript; KS commented and revised the manuscript; DB commented and revised the manuscript; PW Conceived and designed the analysis and revised the manuscript. All authors have read and approved the manuscript.
Funding
This paper summarises independent research funded by NIHR) under its Programme Grant for Applied Research Programme (RP-PG-1211-20012). MAJ, MA, KS and KP are supported by the NIHR South West Peninsula CLAHRC (Collaboration for Leadership in Applied Health Research and Care). The views expressed are those of the authors and not necessarily those of the NHS, the NIHR or the Department of Health.
Availability of data and materials
All data except the summary data from Northumbria Healthcare NHS Foundation trust was taken from the literature and is referenced in the manuscript.
Ethics approval and consent to participate
Not applicable
Consent for publication
Not Applicable
Competing interests
This paper summarises independent research funded by the NIHR under its Programme Grant for Applied Research Programme (RP-PG-1211-20012). The views expressed are those of the author(s) and not necessarily those of the NHS, the NIHR or the Department of Health. PW is co-PI for 2 randomised thrombectomy trials (PISTE & STABILISE) in acute stroke. Start-up phase of PISTE was mainly funded by the Stroke Association but was also part-funded by unrestricted educational grants from Covidien (now Medtronic) & Cod-man who Cod-manufacture stroke thrombectomy devices. STABILISE is part-funded by Microvention grant to Newcastle University. PW has undertaken consultancy work for Stryker, Codman & Microvention who manufacture stroke thrombectomy devices. GAF’s previous institution has received re-search grants from Boehringer Ingelheim (manufacturer of Alteplase), and honoraria from Lundbeck for stroke related activities. GAF has also received personal remuneration for educational and advisory work from Boehringer Ingelheim and Lundbeck. MAJ has received honoraria and support for educa-tional activities from Boehringer Ingelheim and Medtronic.
Author details
1School of Health, Community and Education Studies, Northumbria
University, Newcastle upon Tyne, UK.2School of Health and Social Care, Teesside University, Tees Valley, UK.3National Institute for Health Research
(NIHR) Collaboration for Leadership in Applied Health Research and Care (CLAHRC) South West Peninsula, Bristol, UK.4Institute of Health and Society,
Newcastle University, Newcastle Upon Tyne, UK.5Oxford University Hospitals NHS Trust, Oxford, UK.6Oxford University, Oxford, UK.7Institute of
Neuroscience, Newcastle University, 3-4 Claremont Terrace, Newcastle upon Tyne, UK.8Royal Devon and Exeter NHS Foundation Trust, Exeter, UK. 9
Clinical Research Network North East and North Cumbria, North East and North Cumbria Stroke Patient & Carer Panel, Newcastle upon Tyne, UK.
10
North East and North Cumbria Stroke Patient & Carer Panel, Newcastle upon Tyne, UK.
Received: 12 July 2019 Accepted: 25 October 2019
References
1. Flynn D, et al. Intra-arterial mechanical thrombectomy stent retrievers and aspiration devices in the treatment of acute ischaemic stroke: a systematic review and meta-analysis with trial sequential analysis. European Stroke Journal. 2017;2(4):308–18.
2. Aguiar de Sousa D, von Martial R, Abilleira S, et al. Access to and delivery of acute ischaemic stroke treatments: a survey of national scientific societies and stroke experts in 44 European countries. Eur Stroke J. 2018;4:13–28.
3. Sentinel Stroke National Audit Programme (SSNAP). SSNAP annual portfolio for April 2018–March 2019 admissions and discharges: national results. London: King's College London; 2019. Availablehttps://www.strokeaudit. org/Documents/National/Clinical/Apr2018Mar2019/Apr2018Mar2019-AnnualResultsPortfolio.aspx
4. NHS. The NHS long term plan. Jan 2019.https://www.longtermplan.nhs.uk/ wp-content/uploads/2019/01/nhs-long-term-plan.pdf. Accessed 13 Aug 2019.
5. Oxford Academic Health Sciences Network. Mechanical thrombectomy for acute ischaemic stroke: an implementation guide for the UK.http://bit.ly/ MTguide. Accessed 13 Aug 2019.
6. Allen M, et al. Maximising access to thrombectomy services for stroke in England: a modelling study. European Stroke Journal. 2018;4(1):39–49. 7. Intercollegiate Stroke Working Party. National Clinical Guideline for stroke,
5th edition (Royal College of Physicians of London). 2016. URL:www. strokeaudit.org.uk/guideline. Accessed 13 Aug 2019.
8. NHS England. Stroke Services: Configuration Decision Support Guide. Technical report, 2015.URLhttp://www.necn.nhs.uk/wp-content/uploads/2 015/02/ADD_1210_Stroke-NHS-toolkit_c1_full_2016.08.18_11.48_10_ single-1.pdf. Accessed 13 Aug 2019.
9. Sentinel Stroke Audit Programme (SSNAP). Apr 2015 Mar 2016-AnnualResultsPortfolio. 2016.
10. Lumley, H., et al., Secondary transfers by helicopter emergency services for thrombectomy in rural England: a feasibility study. Int J Stroke, 2018. 13: p. 46–46. 11. England NHS. Clinical commissioning policy: mechanical thrombectomy for
acute ischaemic stroke (all ages); 2018.
12. Halvorsrud K, et al. A Delphi study and ranking exercise to support commissioning services: future delivery of Thrombectomy services in England. BMC Health Serv Res. 2018;18(1):135.
13. Caro JJ, Möller J, Karnon J, Stahl J, Ishak J. Discrete Event Simulation for Health Technology Assessment 1st Edition. Chapman and Hall (New York). ISBN−10: 1482218240.
14. Karnon J, Stahl J, Brennan A, Caro JJ, Mar J, Möller J. On behalf of ISPOR-SMDM modeling good research practices task force. Modeling using discrete event simulation: a report of the ISPOR-SMDM modeling good research practices task force--4. Value Health. 2012;15(6):821–7.https://doi. org/10.1016/j.jval.2012.04.013.
15. Igarashi A, Goto R, Suwa K, et al. Appl Health Econ Health Policy. 2016;14:77
https://doi.org/10.1007/s40258-015-0204-3.
16. Karnon, J. & Haji Ali Afzali, H. PharmacoEconomics (2014) 32: 547.https://doi. org/10.1007/s40273-014-0147-9.
17. Caro JJ, Moller J. Advantages and disadvantages of discrete-event simulation for health economic analyses. Expert Rev Pharmacoecon Outcomes Res. 2016;16(3):327–9.
18. Saver JL, et al. Time to treatment with endovascular Thrombectomy and outcomes from ischemic stroke: a meta-analysis. JAMA. 2016;316(12):1279–88. 19. McMeekin P, White P, James MA, Price CI, Flynn D, Ford GA. Estimating the
number of UK stroke patients eligible for endovascular thrombectomy. European Stroke Journal. 2017;2(4):319–26https://doi.org/10.1177/ 2396987317733343.
20. Nogueira RG, et al. Thrombectomy 6 to 24 hours after stroke with a mismatch between deficit and infarct. N Engl J Med. 2018;378(1):11–21. 21. Albers GW, et al. Thrombectomy for stroke at 6 to 16 hours with selection
by perfusion imaging. N Engl J Med. 2018;378(8):708–18.
22. Rothwell PM, et al. Population-based study of event-rate, incidence, case fatality, and mortality for all acute vascular events in all arterial territories (Oxford vascular study). Lancet. 2005;366(9499):1773–83.
23. Ganesh, A., et al., Time Course of Evolution of Disability and Cause-Specific Mortality After Ischemic Stroke: Implications for Trial Design. J Am Heart Assoc, 2017. 6(6).
24. Office of National Statisitics. National Life Tables, UK: 2015 to 2017. Available from:https://www.ons.gov.uk/releases/nationallifetablesuk2015to2017. Accessed 13 Aug 2019.
25. Slot KB, et al. Impact of functional status at six months on long term survival in patients with ischaemic stroke: prospective cohort studies. BMJ. 2008;336(7640):376–9.
26. Fang CT, et al. Life expectancy of patients with newly-diagnosed HIV infection in the era of highly active antiretroviral therapy. QJM. 2007;100(2): 97–105.
28. Edwards JD, et al. Trends in long-term mortality and morbidity in patients with no early complications after stroke and transient ischemic attack. J Stroke Cerebrovasc Dis. 2017;26(7):1641–5.
29. Dewilde S, et al. Modified Rankin scale as a determinant of direct medical costs after stroke. Int J Stroke. 2017;12(4):392–400.
30. Organisation for Economic Co-operation and Development. Prices and purchasing power parities (PPP). 2017. Available from:http://www.oecd.org/ sdd/prices-ppp/. Accessed 13 Aug 2019.
31. Curtis L, Burns A. Unit costs of health and social care 2017. Personal Social Services Research Unit, University of Kent, Canterbury. 2017;https://doi.org/ 10.22024/UniKent/01.02/65559.
32. Balami JS, et al. Case costing of mechanical thrombectomy for acute ischaemic stroke in routine clinical setting: cost differences between mothership vs drip and ship. Int J Stroke. 2018;13:45–6.
33. Briggs AH, Claxton K, Sculpher MJ. Decision modelling for health economic evaluation. Oxford: Oxford University Press; 2006.
34. Dijkland SA, Voormolen DC, Venema E, Roozenbeek B, et al. Utility-weighted modified Rankin scale as primary outcome in stroke trials: a simulation study. Stroke. 2018;49:965–71https://doi.org/10.1161/STROKEAHA.117.020194. 35. McCabe C, Claxton K, Culyer AJ. The NICE cost-effectiveness threshold what
it is and what that mean. Pharmacoeconomics. 2008;26:733https://doi.org/ 10.2165/00019053-200826090-00004.
36. Lee S, Shafe ACE, Cowie MR. UK stroke incidence, mortality and cardiovascular risk management 1999–2008: time-trend analysis from the general practice research database. BMJ Open. 2011;1:e000269.https://doi. org/10.1136/bmjopen-2011-000269.
Publisher’s Note