Open Access
Research article
Cost-effectiveness analysis of guidelines for antihypertensive care in
Finland
Neill Booth*
1, Antti Jula
2, Pasi Aronen
3,4, Minna Kaila
3,5, Timo Klaukka
6,
Katriina Kukkonen-Harjula
7, Antti Reunanen
2, Pekka Rissanen
1,
Harri Sintonen
3,4and Marjukka Mäkelä
3,8Address: 1Tampere School of Public Health, University of Tampere, Tampere, Finland, 2Department of Health and Functional Capacity, National
Public Health Institute, Helsinki, Finland, 3Finnish Office for Health Technology Assessment (FinOHTA), National Research and Development
Centre for Welfare and Health (STAKES), Helsinki, Finland, 4Department of Public Health, University of Helsinki, Helsinki, Finland, 5Paediatric
Research Centre, Tampere University Hospital and University of Tampere, Tampere, Finland, 6Research Department, Social Insurance Institution,
Helsinki, Finland, 7UKK Institute for Health Promotion Research, Tampere, Finland and 8University of Copenhagen, Copenhagen, Denmark
Email: Neill Booth* - [email protected]; Antti Jula - [email protected]; Pasi Aronen - [email protected]; Minna Kaila - [email protected]; Timo Klaukka - [email protected]; Katriina Kukkonen-Harjula - [email protected]; Antti Reunanen - [email protected]; Pekka Rissanen - [email protected]; Harri Sintonen - [email protected]; Marjukka Mäkelä - [email protected]
* Corresponding author
Abstract
Background: Hypertension is one of the major causes of disease burden affecting the Finnish population. Over the last decade, evidence-based care has emerged to complement other approaches to antihypertensive care, often without health economic assessment of its costs and effects. This study looks at the extent to which changes proposed by the 2002 Finnish evidence-based Current Care Guidelines concerning the prevention, diagnosis, and treatment of hypertension (the ACCG scenario) can be considered cost-effective when compared to modelled prior clinical practice (the PCP scenario).
Methods: A decision analytic model compares the ACCG and PCP scenarios using information synthesised from a set of national registers covering prescription drug reimbursements, morbidity, and mortality with data from two national surveys concerning health and functional capacity. Statistical methods are used to estimate model parameters from Finnish data. We model the potential impact of the different treatment strategies under the ACCG and PCP scenarios, such as lifestyle counselling and drug therapy, for subgroups stratified by age, gender, and blood pressure. The model provides estimates of the differences in major health-related outcomes in the form of life-years and costs as calculated from a 'public health care system' perspective. Cost-effectiveness analysis results are presented for subgroups and for the target population as a whole.
Results: The impact of the use of the ACCG scenario in subgroups (aged 40–80) without concomitant cardiovascular and related diseases is mainly positive. Generally, costs and life-years decrease in unison in the lowest blood pressure group, while in the highest blood pressure group costs and life-years increase together and in the other groups the ACCG scenario is less expensive and produces more life-years. When the costs and effects for subgroups are combined using standard decision analytic aggregation methods, the ACCG scenario is cost-saving and more effective.
Conclusion: The ACCG scenario is likely to reduce costs and increase life-years compared to the PCP scenario in many subgroups. If the estimated trade-offs between the subgroups in terms of outcomes and costs are acceptable to decision-makers, then widespread implementation of the ACCG scenario is expected to reduce overall costs and be accompanied by positive outcomes overall.
Published: 24 October 2007
BMC Health Services Research 2007, 7:172 doi:10.1186/1472-6963-7-172
Received: 7 December 2006 Accepted: 24 October 2007
This article is available from: http://www.biomedcentral.com/1472-6963/7/172 © 2007 Booth et al; licensee BioMed Central Ltd.
Background
Rationale and objectives of the study
Despite the increasing use of evidence-based guidelines over the last decade to complement other approaches to care, there appears to be a relative dearth of English-lan-guage cost-effectiveness analyses of such guidelines ([1-11]). There are numerous possible approaches to cost-effectiveness analysis (CEA) in the field of antihyperten-sive care (see, e.g., [12-22]), mainly addressing questions such as 'whom to treat' and 'how to treat'. A literature database search strategy (see Additional file 1, Table 1) revealed no CEAs that have been carried out concerning broad alternative scenarios for antihypertensive care as outlined in evidence-based guidelines. Therefore, we undertook a cost-effectiveness analysis to evaluate the rel-ative impact of the hypothetical application of two scenar-ios on the costs and effects of the prevention, diagnosis, and treatment of hypertension in Finland. Based on the 2002 evidence-based Antihypertensive Current Care Guideline (ACCG) [23], the ACCG scenario is compared with a prior clinical practice (PCP) scenario. For a descrip-tion of the development process for the Finnish Current Care Guidelines see Additional file 2.
The ACCG and PCP scenarios differ in the types of care they include and, hence, in the clinical outcomes expected to result from each scenario. We use a combination of individual-level data (i.e., observed and recorded infor-mation on a representative population sample of individ-uals) with data representative of the whole population (i.e., population data from national registers) to calculate expected outcomes in each scenario using decision ana-lytic modelling (see Additional file 3, Figure 1).
The ACCG is aimed primarily at providing health care professionals with guidance concerning the prevention,
diagnosis, or treatment of hypertension in individuals. The objective of this cost-effectiveness study is to highlight some of the opportunity costs of the two scenarios in undertaking antihypertensive care in the longer term and at a national level (see Additional file 1, Table 2 for details of terminology such as opportunity costs). This research is intended mainly for members of the various bodies and organisations responsible for the selection and imple-mentation of publicly funded health care technologies.
Antihypertensive care scenarios
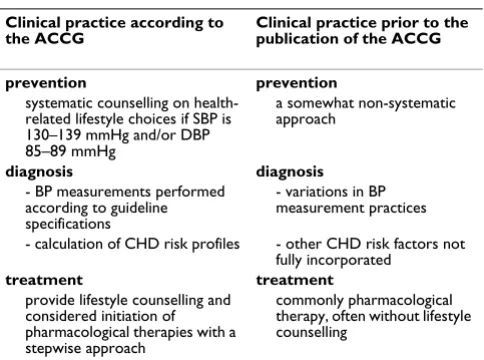
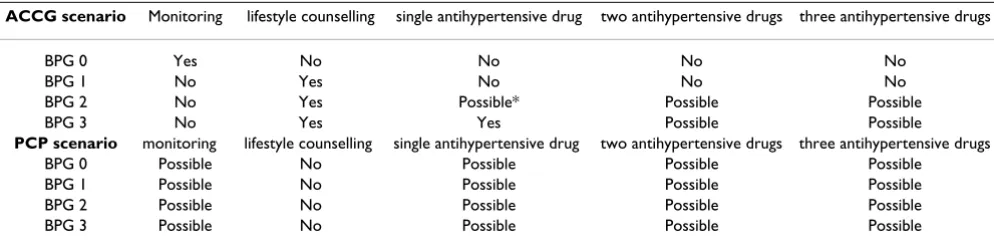
Some important differences between antihypertensive care according to the 2002 antihypertensive Current Care guideline and prior clinical practice are shown in Table 1. The ACCG scenario refers to the hypothetical application of only part of the ACCG and the PCP scenario refers to the hypothetical application of observed PCP. These sce-narios are constructed to form part of a decision analytic model. The blood pressure groups (BPGs) used in this study are presented in Table 2. The two scenarios each involve particular combinations of a variety of therapeutic interventions, as shown in Table 3.
The most important assumed differences between the two scenarios are the following: 1) the frequency and type of BP measurement, 2) the use of coronary risk assessment, 3) the recommended therapeutic choices – especially – the preventative role of lifestyle counselling [23]. For example, in line with the ACCG, diagnostic BP measure-ment under the ACCG scenario consists of four sets of duplicate SBP and DBP measurements within a specified period of time (if the screening SBP is 140 mmHg or more or the screening DBP is 90 mmHg or more as averaged over two readings) [24]. In contrast, the PCP scenario is assumed to include four blood pressure measurements per year, see Additional file 4, Table 1. The use of coronary risk assessment tables [25] is advocated in the ACCG and modelled in the ACCG scenario, but such tables are assumed not to be used under the PCP scenario. The ther-apeutic choices for different BP groups under the PCP and ACCG scenarios differ as shown in Table 3, and the differ-ences in the pharmacological therapies between the two scenarios are shown the additional material, see Addi-tional file 1, Table 3. The lifestyle counselling intervention is assumed to be applicable to all individuals in the ACCG scenario, except those in the lowest-numbered BP group, BPG 0. It is assumed that lifestyle counselling is not used under the PCP scenario.
[image:2.612.56.298.548.728.2]The PCP and ACCG scenarios are hypothetically applied to the individuals in the study population as if antihyper-tensive care was being initiated. The two scenarios are applied only to individuals without concomitant cardio-vascular disease or diabetes. That is, the analysis of the two scenarios is specific to individuals without diagnoses
Table 1: Differences between the two approaches to the prevention, diagnosis, and treatment of hypertension.
Clinical practice according to the ACCG
Clinical practice prior to the publication of the ACCG
prevention prevention
systematic counselling on health-related lifestyle choices if SBP is 130–139 mmHg and/or DBP
85–89 mmHg
a somewhat non-systematic approach
diagnosis diagnosis
- BP measurements performed according to guideline specifications
- variations in BP measurement practices - calculation of CHD risk profiles - other CHD risk factors not
fully incorporated
treatment treatment
provide lifestyle counselling and considered initiation of pharmacological therapies with a stepwise approach
of diabetes, coronary heart disease (CHD), or cerebrovas-cular events (CVEs). In addition, the two scenarios are restricted to individuals aged 40–74. Almost 1.5 million Finns, out of a total Finnish population of almost 5.2 mil-lion, fall into this category. Among this target population
of 1.5 million Finns, over 70% of males and over 60% of females have elevated blood pressure (SBP exceeding 130 mmHg or DBP over 85 mmHg). The 'do nothing' compa-rator was assumed not to be a reasonable alternative in the
Base case incremental analysis for both genders, by age group and blood pressure group Figure 1
Base case incremental analysis for both genders, by age group and blood pressure group.
males BPG 0 BPG 1 BPG 2 BPG 3
70–74 €217,000 per life-year €74,000 per life-year ACCG scenario dominates ACCG scenario is dominated
- €5m - €1m - €5m €2m
-23 life-years -15 life-years 19 life-years -65 life-years
65–69 €103,000 per life-year €32,000 per life-year ACCG scenario dominates €7,000 per life-year
- €6m - €4m - €6m €3m
-56 life-years -110 life-years 312 life-years 395 life-years
60–64 €42,000 per life-year €9,000 per life-year ACCG scenario dominates €3,000 per life-year
- €9m - €8m - €16m €2m
-223 life-years -860 life-years 223 life-years 678 life-years
55–59 €15,000 per life-year ACCG scenario dominates ACCG scenario dominates €3,000 per life-year
- €11m - €3m - €12m €9m
-746 life-years 146 life-years 1,847 life-years 3,420 life-years
50–54 €42,000 per life-year ACCG scenario dominates ACCG scenario dominates €5,000 per life-year
- €24m - €7m - €25m €23m
-572 life-years 1,064 life-years 3,366 life-years 4,476 life-years
45–49 €34,000 per life-year ACCG scenario dominates ACCG scenario dominates €10,000 per life-year
- €29m - €10m - €25m €20m
-841 life-years 1,705 life-years 1,171 life-years 2,040 life-years
40–44 €42,000 per life-year ACCG scenario dominates ACCG scenario dominates €6,000 per life-year
- €38m - €7m - €18m €11m
-904 life-years 891 life-years 287 life-years 1,898 life-years
females BPG 0 BPG 1 BPG 2 BPG 3
70–74 ACCG scenario dominates ACCG scenario dominates ACCG scenario dominates €13,000 per life-year
- €3m - €5m - €11m €7m
4 life-years 15 life-years 332 life-years 567 life-years
65–69 €95,000 per life-year €48,000 per life-year €32,000 per life-year €4,000 per life-year
- €3m - €12m - €12m €6m
-36 life-years -247 life-years -359 life-years 1,327 life-years
60–64 €50,000 per life-year €20,000 per life-year ACCG scenario dominates €3,000 per life-year
- €10m - €14m - €19m €7m
-193 life-years -699 life-years 54 life-years 2,559 life-years
55–59 €30,000 per life-year ACCG scenario dominates ACCG scenario dominates €1,000 per life-year
- €13m - €5m - €24m €18m
-435 life-years 574 life-years 1,387 life-years 12,756 life-years
50–54 €42,000 per life-year ACCG scenario dominates €55,000 per life-year €2,000 per life-year
- €35m - €9m - €29m €18m
-843 life-years 1,404 life-years -527 life-years 7,388 life-years
45–49 €69,000 per life-year ACCG scenario dominates €15,000 per life-year €3,000 per life-year
- €48m - €10m - €28m €10m
-698 life-years 1,892 life-years -1,804 life-years 3,191 life-years
40–44 €52,000 per life-year ACCG scenario dominates €45,000 per life-year €4,000 per life-year
- €60m - €7m - €18m €7m
-1,137 life-years 1,734 life-years -397 life-years 1,812 life-years
blood pressure group classification
age g
rou
p
age
grou
context of antihypertensive care in a Western European society.
Methods
Modelling
For the purposes of economic evaluation, a decision model with Markov cycle sub-trees was built [26]. The sub-trees consist of 11 Markov states, which describe the major health-related outcomes and costs associated with antihypertensive care (see Additional file 3, Figure 3). For the basic structure of the decision tree see Additional file 3, Figure 3. The Markov cycle duration was set at five years, the minimum time horizon of the model was 10 years, and the maximum time horizon was 40 years. Progression between states is represented by transition probabilities (see Additional file 1, Table 5). Transitions between states are determined by the use of both epidemiological study data and published analyses of clinical trial data. Results are presented as incremental cost-effectiveness ratios (ICERs).
To facilitate modelling, the population was divided by gender and into seven age bands, each five years wide. The model follows cohorts of individuals (40–44, 45–49, 50– 54, 55–59, 60–64, 65–69, and 70–74) and calculates costs and outcomes until members of the cohort exceed the age of 80. Results are given as incremental
cost-effec-tiveness ratios in 56 age-, gender-, and BP-stratified sub-groups as well as being aggregated over all subsub-groups.
A rate of discount of 5% was used for both costs and effec-tiveness in the base case analysis as well as 0% in sensitiv-ity analysis in accordance with the guidelines of the Finnish Ministry of Social Affairs and Health [27]. In addi-tion, one-way sensitivity analyses were carried out by changing the probabilities of regimen switching (only applicable in the ACCG scenario), the distribution of first-line therapy (only applicable in the ACCG scenario), the costs of medication, the costs of lifestyle counselling (only applicable in the ACCG scenario), the costs associated with morbidity, and the effects of antihypertensive care on BP. Sensitivity analysis was also carried out by attaching to the Markov states health-related quality of life (HRQL) weights as measured by the 15D instrument [28]. For fur-ther details of the sensitivity analyses, see Additional file 5.
Statistical analysis was carried out using the R statistical package [29] and version 6.12 of the SAS System [30].
Population data
[image:4.612.54.295.110.190.2]Data were available from the National Health 2000 Health Examination Survey (H2000), a two-stage strati-fied cluster sample undertaken in 2000–2001 (which included 8,028 persons aged 30 years and over and was representative of all people of that age in Finland) [31]. These data were used to provide prevalence estimates for BP groups in the population, stratified by age and gender, as well as a means for calculation of hypothetical treat-ment effects; an estimate of the use of antihypertensive medication under PCP; and the proportion of the popula-tion, stratified by age group and gender, with a risk of CHD within the next 10 years of ≥ 20% by applying a risk estimation equation [32]. In addition, the HRQL weights of the Markov states were derived from these data.
Table 3: Main operationalised differences between the PCP and ACCG scenarios.
ACCG scenario Monitoring lifestyle counselling single antihypertensive drug two antihypertensive drugs three antihypertensive drugs
BPG 0 Yes No No No No
BPG 1 No Yes No No No
BPG 2 No Yes Possible* Possible Possible
BPG 3 No Yes Yes Possible Possible
PCP scenario monitoring lifestyle counselling single antihypertensive drug two antihypertensive drugs three antihypertensive drugs
BPG 0 Possible No Possible Possible Possible
BPG 1 Possible No Possible Possible Possible
BPG 2 Possible No Possible Possible Possible
BPG 3 Possible No Possible Possible Possible
[image:4.612.56.553.576.699.2]* In this table, 'Possible' refers to the potential use of interventions. In the ACCG scenario, this refers to the fact that treatment with antihypertensive pharmacological therapy can be considered in this case. For the PCP scenario, data from H2000 suggest that use of antihypertensive pharmacological therapy did occur in all BP groups, as did monitoring.
Table 2: Classification of blood pressure: If SBP and DBP fell into different groups, the individual was classified in the higher group.
systolic blood pressure (in mmHg)
diastolic blood pressure (in mmHg)
BPG 0 < 130 and < 85 BPG 1 130–139 and/or 85–89 BPG 2 140–159 and/or 90–99
From the entire H2000 dataset, only data on individuals aged between 40 and 79 were utilised, as the expected observable frequency of events in other age groups, in terms of morbidity and mortality, was deemed insuffi-cient. Further, the dataset was restricted to those individu-als who have had their BP measured and who have no history of cardiovascular or related illnesses according to H2000 study. That is, the sample was restricted to individ-uals without diagnoses of diabetes, coronary heart disease (CHD), or cerebrovascular events (CVEs). The resultant sample size was 3,188. Almost 15% of individuals in this sample were recorded as using antihypertensive medica-tion. For these individuals, prior to allocation to one of the four BP groups, the recorded SBP was increased by 10 mmHg and DBP by 6 mmHg. The same increase was applied regardless of BP group (see Additional file 1, Table 6). This simplified adjustment was undertaken because information for apportioning prior treatment effects more precisely was not available at the time of this study.
Due to the relatively small sample size in the 70–74 age group, where necessary, it was assumed that the 75–79 age group also is representative of the 70–74 age group. Expansion weights calculated by Statistics Finland for the H2000 sample were applied to provide estimates of target population sizes at the national level in the 56 subgroups, with these subgroups representing approximately 1.5 mil-lion Finns (i.e., 62% of the Finnish population between the ages of 40 and 74), of whom almost 720,000 were male and over 780,000 female. See Additional file 6, Fig-ures 1, 2, 3.
Transition probabilities and paths of treatment
For modelling purposes, we calculated the transition probabilities between the Markov states in each of the 28 age- and BP-stratified subgroups for men and women. The transition probabilities between BP groups are based on treatment effects (see Additional file 1, Tables 7 and 8) applied to the individual H2000 data on blood pressure group membership. The estimated probabilities of mov-ing from the various BP group states to the states of CHD, CVEs, and death from those or other causes (i.e., morbid-ity and fatal event states) are based on the follow-up of the participants in the Mini-Finland (MF) health examina-tion/interview survey undertaken between 1978–1980 [33]. Hazard functions were estimated by stratifying the sample into two age groups, 40–59 and 60–79 (see Addi-tional file 1, Table 9), due to the relative infrequency of endpoints in quinquennial age groups. After the first Markov cycle, the model also allows movements from the morbidity states to two co-morbidity states: the pertinent hazard function estimates are shown in (see Additional file 1, Table 10). All hazard function estimates are trans-formed into transition probabilities using the formula P(t) = 1 – exp(-μt) [34]. In the few cases where, due to the small number of observations in a subgroup, the
esti-Subgroup results on the cost-effectiveness plane Figure 3
[image:5.612.312.553.86.259.2]Subgroup results on the cost-effectiveness plane.
Table 4: Yearly costs of pharmacological therapies* used in the PCP scenario, rounded to the nearest euro, by gender (2001 prices).
Pharmacological subgroup ATC code
male female
hydrochlorothiazide or trichlormethiazide and potassium-sparing agents
C03EA 40 42
beta-blocking agents C07A 145 136
combination of metoprolol or bisoprolol and thiazides
C07B 141 141
atenolol or metoprolol and other antihypertensives
C07F 285 275
calcium channel blockers C08 245 228
ACE inhibitors C09A 203 192
combination of ACE inhibitors and diuretics C09BA 233 228 combination of ACE inhibitors and calcium
channel blockers
C09BB 349 348
angiotensin II subtype 1 receptor antagonists
C09C 251 250
combination of angiotensin II subtype 1 receptor antagonists and diuretics
C09D 271 274
*(weighted average of the different pharmacological subgroups)
Key for figures 1, 3, and 4 Figure 2
Key for figures 1, 3, and 4.
mates were not congruent with the work of MacMahon et al. [35], estimates were smoothed.
The scenarios differ in their treatment paths. Common to both are the use of mono-, dual-, or triple-drug therapy and a path defined as monitoring (i.e., without any BP-modifying treatment). Lifestyle counselling (LSC) is used only in the ACCG scenario, with or without drug therapy.
The ACCG scenario follows the treatment options pre-sented in Table 3, such that the type of treatment largely is determined by BPG. In BPG 0 and BPG 1, monitoring and LSC are the only options, respectively. In BPG2, all indi-viduals are assumed to receive LSC and pharmacological therapy can be considered if the individual's risk of CHD within the next 10 years is at least 20% [25]. In BPG 3, all individuals are assumed to receive both LSC and pharma-cological therapy.
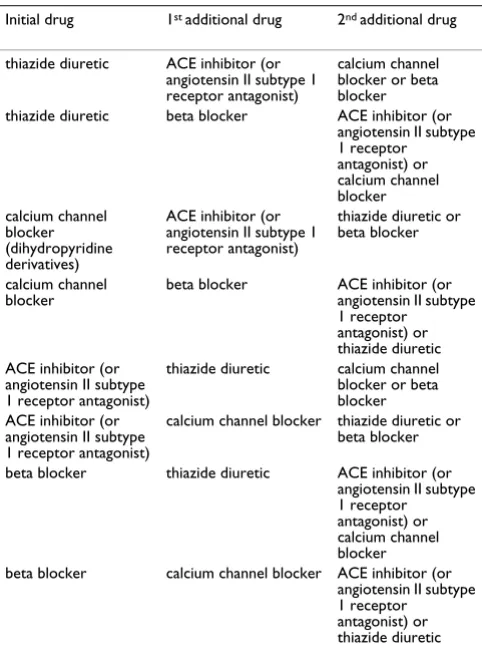
The choice of initial pharmacological therapy in the ACCG scenario is limited to five alternative monothera-pies: a thiazide diuretic, a calcium channel blocker, a beta blocker, an ACE inhibitor, or an angiotensin II subtype 1 receptor antagonist. The latter is recommended by the ACCG when the other drug therapies have resulted in problematic side effects. In the ACCG scenario, at the start of the first five-year Markov cycle, there is a possibility of regimen switching if an individual's hypertension is poorly controlled or there are side effects. According to the ACCG, initial therapy is then changed either to another monotherapy (preferably with a different pharmacologi-cal effect) or to a combination treatment (especially if the first drug is a thiazide diuretic or an ACE inhibitor). If blood pressure still remains poorly controlled, the ACCG suggests changing one drug in the two-drug combination, or that adding a third drug with a different effect to the combination should be considered. The possible alterna-tives for regimen switching in the ACCG scenario are shown in Table 8.
The ACCG recommends consideration of costs in the pre-scription of pharmacological therapies. According to the ACCG the rational first-line treatment would be thiazides
for 60% of the population (not complicated by other car-diovascular-related disease) for which drug treatment would be recommended. In part, this recommendation was implemented in the base case analysis of our model by assuming that the majority (60%) of patients receive thiazide diuretics as their initial treatment. In addition, from each pharmacological subgroup a relatively inexpen-sive and widely used pharmacological substance was cho-sen.
In the PCP scenario there are 24 possible choices of phar-maceutical monotherapy or pharphar-maceutical combination therapies, with no possibility of regimen switching. For further details on the interventions available in both sce-narios, see Additional file 1, Table 3.
Estimates of costs
The data used to estimate costs were collated from national registers, Finnish costing studies [36], an earlier national study on the costs of antihypertensive care [37],
Table 7: Estimates of the antihypertensive effect of monotherapy and combination pharmacological treatment.
Blood pressure level 1 drug 2 drugs 3 drugs BPG 0 SBP < 130 mmHg and DBP
< 85 mmHg
5/3 10/6 15/8
BPG 1 SBP 130–139 mmHg and/or DBP 85–89 mmHg (but not SBP ≥ 140 or DBP ≥ 90 mmHg)
6/3 12/7 18/10
BPG 2 SBP 140–159 mmHg and/or DBP 90–99 mmHg (but not SBP ≥ 160 or DBP ≥ 100 mmHg)
7/4 14/8 21/12
BPG 3 SBP ≥ 160 mmHg or DBP ≥ 100 mmHg
[image:6.612.55.298.120.201.2]8/4 16/9 24/13
Table 5: Yearly costs of pharmacological therapies used in the ACCG scenario, rounded to the nearest euro, by gender (2001 prices).
Pharmacological substance ATC code male female
hydrochlorothiazide C03AA03 22 24
bisoprolol C07AB07 112 107
nifedipine C08CA05 243 227
enalapril C09AA02 192 181
candesartan C09CA06 235 237
Table 6: Costs of non-pharmacological treatment-related therapies per year*, rounded to the nearest euro, by gender and BPG**.
Cost ACCG scenario PCP scenario
BP measurement 15 5
initial diagnostic work-up 38 62 lifestyle counselling 1st year = 36
2nd year = 24
subsequent years = 17
not applicable
follow-up BP measurement Female Male BPG 0 3 2 0
BPG 1 10 6 4
BPG 2 27 9 7
BPG 3 57 16 14 * unless otherwise stated
[image:6.612.313.556.580.725.2]and an international study of the costs of morbidity asso-ciated with elevated blood pressure [38].
For the PCP scenario, information on the shares of use of the pharmacological subgroups of antihypertensive drugs and their combinations (see Additional file 1, Table 4), as well as their average costs in 2001, was obtained from the reimbursement registers of the Finnish Social Insurance Institution (SII). The SII data include all reimbursements made under the National Health Insurance Scheme [39]. In calculation of these costs, patients with entitlement to a special refund on account of concomitant conditions of diabetes and cardiovascular diseases were excluded.
The costs of pharmacological therapies in the ACCG sce-nario were estimated on the basis of the ACCG recom-mendation that from each pharmacological subgroup an inexpensive and widely used substance should be chosen. As for the PCP scenario, information on the average costs of antihypertensive drugs was obtained from the reim-bursement registers of the SII.
In the base case the substances were valued at their cost to the health care sector in 2001, excluding value added tax
(VAT). The estimates of yearly costs (including VAT) are shown in Table 4 and Table 5.
Base case estimates of the non-pharmacological ment-related costs of prevention, diagnosis, and treat-ment of hypertension in the ACCG and PCP scenarios are presented in Table 6. Cost estimates were derived by using H2000 data; a Finnish lifestyle counselling study [40]; Finnish health care unit costs [36]; and, where necessary, expert opinion. For further details, see Additional file 4.
Costs applied to the states of CHD, cerebrovascular events, and combinations of these morbid states were esti-mated from the related literature [38,41-45] and Finnish health care unit costs [36]. The estimate used for CVEs is 3,000 euros per year and for CHD 1,000 euros per year [36,38,41-45]. In the combination states of CVE and CHD, these costs were summed together.
Estimates of effects
The estimated effect of treatment on outcomes is calcu-lated by first estimating the effect of the expected reduc-tion in BP on BP group and then by the estimating the effect of BP group on morbidity and mortality. These esti-mated effects are then expressed as changes in life-years, which are calculated on the basis of the cohort's duration of stay in non-fatal states. Life-years are valued equally in all BP and morbidity states in the base case analysis and adjusted for health-related quality of life (HRQL) in a sen-sitivity analysis. In both the H2000 survey and the MF sur-vey, the measurement of BP was strictly carried out according to the World Health Organization (WHO) rec-ommendations. Antihypertensive effects of treatments are divided into effects associated with medication, those associated with lifestyle counselling and those associated with a combination of the two treatments (see Additional file 1, Tables 7 and 8). The effectiveness of all pharmaco-logical therapies (i.e., the change resulting from any par-ticular pharmacological intervention in terms of change in BP) is assumed to be the same in the ACCG and PCP scenarios.
On account of the work of Kastarinen et al. [40], for those receiving both lifestyle counselling (LSC) and pharmaco-logical therapy, a reduction due to LSC of 1 mmHg in both SBP and DBP was assumed in BPG 0, and 2 mmHg in the other BP groups. In the absence of larger RCTs, LSC is assumed to decrease SBP by 2.6 mmHg and DBP by 2.7 mmHg for persons not receiving pharmacological treat-ment [46].
[image:7.612.56.297.401.733.2]The effect of five-year increases in age on BP as estimated with regression analysis from the H2000 sample – i.e., the effect of monitoring (no active treatment but active sur-veillance) – was similar to that obtained in another study
Table 8: Possible regimen changes in the ACCG scenario.
Initial drug 1st additional drug 2nd additional drug
thiazide diuretic ACE inhibitor (or angiotensin II subtype 1 receptor antagonist)
calcium channel blocker or beta blocker
thiazide diuretic beta blocker ACE inhibitor (or angiotensin II subtype 1 receptor antagonist) or calcium channel blocker calcium channel
blocker (dihydropyridine derivatives)
ACE inhibitor (or angiotensin II subtype 1 receptor antagonist)
thiazide diuretic or beta blocker
calcium channel blocker
beta blocker ACE inhibitor (or angiotensin II subtype 1 receptor antagonist) or thiazide diuretic ACE inhibitor (or
angiotensin II subtype 1 receptor antagonist)
thiazide diuretic calcium channel blocker or beta blocker ACE inhibitor (or
angiotensin II subtype 1 receptor antagonist)
calcium channel blocker thiazide diuretic or beta blocker beta blocker thiazide diuretic ACE inhibitor (or
angiotensin II subtype 1 receptor antagonist) or calcium channel blocker
[47]. These estimates were calculated for two age groups, 40–60 years old and 60–80 years old. In the first of these groups, SBP was estimated to have increased by 4 mmHg and DBP by 2 mmHg per five-year period, while in the 60–80-year-old group SBP was estimated to have increased by 4 mmHg and DBP decreased by 1 mmHg per five-year period.
The estimates of the antihypertensive effect of pharmaco-logical monotherapies and combination therapies were derived from a recent meta-analysis of randomised trials [48]. According to that study, the five main categories of blood-pressure-lowering drugs (thiazides, beta blockers, ACE inhibitors, angiotensin II subtype 1 receptor antago-nists, and calcium channel blockers) produced similar reductions in BP. The expected reductions in BP in differ-ent BP groups under both the ACCG and the PCP scenar-ios are summarised in Table 7.
It is assumed that the effect of treatments within each sce-nario on BP group membership occurs only during the first five-year cycle. In subsequent cycles, transitions between BP groups result from changes in BP with age under the assumption that only monitoring would occur (for estimates of the resource use in terms of monitoring see Additional file 4, Tables 4, 5 and 6). The Mini-Finland data [30] were used to help provide estimates of the mor-bidity and mortality associated with BP group. The MF data were linked using exact matching of unique identifi-ers to the Cause of Death Register (Statistics Finland) and the Hospital Care Register (National Research and Devel-opment Centre for Welfare and Health). Cox models [32] were used to produce estimates of hazard functions relat-ing the BP groups to the morbidity and fatal event states for the follow-up period of 15 years (see Additional file 1, Table 9) and estimates of hazard functions relating prior morbidity to future comorbidity and death (see Addi-tional file 1, Table 10). For examples of transition proba-bilities see Additional file 7.
Results
In line with recommendations in the literature (see, e.g., [49]), we report analyses in both subgroup and aggregated form. For the 56 age- and gender-stratified subgroups, the estimated ICERs and the corresponding numerators and denominators for the base case analysis are shown (Figure 1). Green cells in Figure 1 (21 in number) show domi-nance of the ACCG scenario; that is, application of the ACCG scenario is more effective (produces more life-years) and is less costly than the PCP scenario. Yellow shading (12 cells) indicates incremental costs and incre-mental outcomes, while orange shading (22 cells) indi-cates decremental costs and decremental outcomes. That is, the smaller the ICERs with yellow shading or, con-versely, the larger the ICERs with orange shading, the
more likely the ICERs are to be considered cost-effective. Red shading (one cell) represents incremental costs and decremental outcomes (i.e., the PCP scenario dominates). These results are given for each subgroup over the time horizon of the study (10 to 40 years, depending on the age range of the subgroup). See Additional file 1, Table 11 for the estimated sizes of subgroups. The total target popula-tion is almost 1.5 million individuals in Finland.
In large part, the subgroup results differ according to blood pressure group (BPG). Generally, in blood pressure group 0 (BPG 0, where SBP is below 130 mmHg and DBP is below 85 mmHg) the effect of the application of the ACCG scenario was to reduce expected costs at the same time as reducing the expected number of life-years. Largely, for BPG 1 and BPG 2 (where SBP is 130–139 mmHg and/or DBP 85–89 mmHg and SBP is 140–159 mmHg and/or DBP 90–99 mmHg, respectively), the ACCG scenario was shown to be cost-saving and more effective (i.e., decreased costs and increased life-years expected). Generally, in BPG 3 (where SBP is over 160 mmHg or DBP over 100 mmHg), increased expected costs are associated with an increase in the expected number of life-years. Figure 3 shows these subgroup results plotted on the cost-effectiveness plane [50]. We also provide the approximate size of the Finnish population to which the results in that quadrant apply (the numbers in brackets in Figure 3).
As a summary of both Figure 1 and Figure 3, aggregating the results from the 56 study subgroups indicates that in comparison to the PCP scenario the use of the ACCG sce-nario would produce 49,000 extra life-years and save 498 million euros. In this case, the ACCG would be the dom-inant scenario overall. That is, while the ACCG scenario should not be classed as cost-effective, it is both cost-sav-ing and more effective [51].
A cost-effectiveness plane based on the results of one-way sensitivity analyses (aggregated over all subgroups) of 30 variations of influential variables is shown in Figure 4. For a detailed presentation of the results of these sensitivity analyses, see Additional file 5. Almost all aggregated sen-sitivity analyses showed that the ACCG scenario domi-nates the PCP scenario – i.e., that the ACCG scenario is cost-saving and more effective. One exception was the case where lifestyle counselling was assumed to be four times more costly than in the base case. In this sensitivity analysis, with an extreme value used for the cost of life-style counselling, the aggregated results show that the cost per life-year saved would be around €8,000.
(six at least, 31 at best) days per person in the target pop-ulation, although it should be noted that this figure is averaged over all individuals in the target population of 1.5 million Finns.
Discussion
Over half of Finland's 40–74-year-old 'uncomplicated' population has elevated blood pressure. The major goal of the ACCG is to achieve a reduction in blood pressure that is sufficient for these individuals to lower their risk of car-diovascular (and related) diseases. As a means to this end, the ACCG promotes lifestyle modification and rational use of antihypertensive drugs. The lifestyle counselling considered to be feasible in the ACCG scenario is by design a low-intensity patient-counselling programme [40]. The most significant lifestyle-related and modifiable risk factors for elevated blood pressure are overweight sta-tus, high intake of sodium, high intake of alcohol, and physical inactivity. Also, a randomised controlled trial has shown the beneficial effects of a lifestyle intervention based on reduced sodium intake and increased intake of fruits, vegetables, and low-fat dairy products [52]. Even more dramatic effects could be achieved with a more aggressive lifestyle intervention [53,54] than is considered here.
Generally, in blood pressure group 0, the impact of the application of the ACCG scenario was to reduce expected costs at the same time as reducing the expected number of life-years in comparison to the PCP scenario. This result is likely to reflect the fact that the PCP scenario, with at least some use of medication, is always treated by the model as being more effective than monitoring (i.e., in BPG 0 active surveillance is the only treatment option under the ACCG scenario). In the majority of age- and gender-stratified
subgroups in BPG 1 and BPG 2, the ACCG scenario was shown to be both cost-saving and more effective. Indeed, these two groups are those for which, a priori, we expected to see the greatest relative benefit from lifestyle counsel-ling, either alone (in the case of BPG 1) or in combination with medication for individuals at increased risk of CHD (in the case of BPG 2). Generally, in BPG 3, increased expected costs are associated with an increase in the expected number of life-years. This mainly reflects the fact that the ACCG scenario applies drug treatment to all indi-viduals in BPG 3, whereas the PCP scenario treats only some individuals in this group.
Other factors that are likely to have contributed greatly to the results presented include both the manner in which diagnosis is performed in the ACCG scenario and the fact that inexpensive medications from within each pharma-cological subgroup are used under the ACCG scenario. The rational use of antihypertensive drugs can be pro-moted by reference to both the severity of hypertension and the costs of drug treatment [23,55]. The ACCG, for instance, promotes the initiation of drug treatment using a single pharmacological therapy [23]. In addition, for most instances of combination treatment, one of the drugs to be chosen is a thiazide diuretic [56].
Strengths of the study
This analysis is intended to be a pragmatic cost-effective-ness analysis and firmly based on observed prior clinical practice in Finland and on the operationalisation of the Finnish evidence-based guidelines undertaken in this study. Generalising the results of this study may, to some extent, be justified in view of the broadly similar hyper-tension-related disease burden in other settings and the similarity of other evidence-based antihypertensive guide-lines, such as the recently updated National Institute for Clinical Excellence (NICE) guidelines [57].
The study presented here is based on an extraordinary set of data sources, which include both exemplary national registers with high coverage [58] and high-quality surveys of population health (see [31] and [33]). The Hospital Care Register, particularly as regards cardiovascular dis-eases, has proved to be accurate [59]. The National Health Insurance Scheme operates in all Finnish pharmacies, and over 90% of reimbursements for the purchase of antihy-pertensive drugs occur seamlessly at the point of sale.
In both the H2000 and MF surveys, the measurement of BP was carried out according to the WHO recommenda-tions. It is therefore credible that these datasets provide classification of BP in line with measurements made in standard clinical practice. In addition, both SBP and DBP are used as part of the basis for BP classification, as recom-mended by the ACCG.
The cost-effectiveness plane with the results (aggregated across subgroups) of the one-way sensitivity analyses Figure 4
Perhaps most importantly, this study offers rare insight into the potential usefulness of developing clinical prac-tice guidelines.
Limitations of the study
A number of caveats should be attached to all results and discussion presented here, the following two being of major importance. Firstly, that this is a model of limited size, analytic capability, and adherence to economic eval-uation guidelines. Secondly, because uncertainty concern-ing the model inputs has not been fully incorporated, the cost-effectiveness analyses reported here are best taken as being indicative of the direction, rather than the exact magnitude, of differences in costs and effects between the two scenarios.
Further to this, pertinent evidence of adherence to either the ACCG scenario or the PCP scenario had not been pub-lished. The full-adherence assumption used in this study deviates, somewhat, from what might be expected in standard clinical practice. However, the practical effect of this assumption is likely to be reduced by the fact that it was used in the same manner in both scenarios. Indeed, the financial costs associated with guideline development and production in Finland are estimated to be minimal, and, even with very low levels of adherence, their produc-tion is likely to be economically viable in the long term. The results of a sensitivity analysis concerning low levels of adherence to the ACCG scenario in favour of continued use of the PCP scenario are not presented here, as the result is merely a linear scaling of the differences in the costs and effects between the two scenarios. However, the possibility remains that these results may be located toward the upper end of the potential overall impact of the ACCG scenario.
The ACCG itself is an evidence-based, advisory statement, and treatment should always be tailored to the individual. On the other hand, in the Markov model used here, the ACCG scenario is implemented as if it were a prescriptive scenario. Thus, the model does not fully incorporate the subtleties and flexibilities of the ACCG. The result that the ACCG scenario, in almost all age- and gender-stratified BPG 0 subgroups, produces fewer life-years and costs than the PCP scenario is also explained in part by the rigidity of the model. In contrast to the observed use of antihyper-tensive medications in prior clinical practice, in the ACCG scenario no intervention is provided for BPG 0 (see Table 3). It is likely that the H2000 records on prior usage of antihypertensive medications include some element of overtreatment.
This study did not directly consider the cost of ACCG development, nor the costs of ACCG implementation in clinical practice [60]. This leads to an underestimate of the
costs of the ACCG scenario, but can be justified by refer-ence to the fact that the ACCG scenario is not identically equivalent to the whole of the evidence-based ACCG. The costs included can be considered to consist mainly of the costs borne by the health care sector. Value added tax was subtracted from the recorded prices of the pharmaceuti-cals. This could result in an underestimate of the cost bur-den to the health care sector [61].
The number of treatments considered and the number of health states representing alternative outcomes had to be restricted in order to keep the Markov model simple enough to be functional and able to populate the model. Carrying out the analyses in 56 subgroups led to moder-ately small sample sizes in some cases, but this was deemed necessary for identifying any heterogeneity of the impact on the subgroups. For example, due to lack of reli-able or consistent data, this study does not incorporate some health care costs and outcomes that potentially could be associated with elevated blood pressure, such as the costs and health-related effects of peripheral vascular disease, renal disease, heart failure, diabetes, and lost earnings [62]. This may well have resulted in an underes-timate of the costs and effects associated with BP-related disease but is also likely to result in an underestimate of potential savings and benefits in outcome from BP reduc-tion at the aggregated level.
At best, the estimates of BP effects on mortality and mor-bidity should be treated as only indicative of the extent and direction of the likely associations between BPG and health status in terms of morbidity and mortality. The estimates presented here are also subject to the assump-tion of full benefit [12]. This assumes that the estimated change in BP is achieved, that the effect of non-adherence is negligible, that the change to (or inclusion in) a BP group completely and linearly defines the risk of morbid-ity and mortalmorbid-ity, and that the amount of benefit does not diminish within any age group. For a detailed presenta-tion of other assumppresenta-tions applied in this research, see Additional file 8.
The potential effect of substitution with generic equiva-lents, for which legislation has been in place in Finland since 1 April 2003, was not incorporated into the base case analysis. Equivalence, in terms of side effects, of the pharmacological therapies was assumed in the absence of strong evidence to the contrary. Therefore, the impact of potential side effects on antihypertensive care (discontin-uation of treatment or regimen change and costs associ-ated therewith) or on individuals (HRQL effects) is assumed to be the same and is omitted from considera-tion.
Probabilistic sensitivity analysis was not carried out, partly on account of the assumed robust nature of the datasets used [63]. In addition, the complexity of the Markov model did not allow easy application of probabi-listic sensitivity analysis. One-way sensitivity analyses showed that exaggerated increases in the cost of lifestyle counselling was the only variant investigated that changed the aggregated result from that of the ACCG scenario being dominant to that of it being both more costly and more effective.
Conclusion
The aggregated results showed that the ACCG scenario is less costly and produces more life-years than the PCP sce-nario. However, there was heterogeneity in the results from the 56 subgroups analysed – i.e., ranging from losses in life-years and increased costs in one subgroup to gains in life-years and reduced costs in others. The most consist-ently positive effects of the ACCG scenario (decreased costs and an increased number of life-years) were observed for males with moderately elevated blood pres-sure – that is, for those in BPGs 1 and 2. On the other hand, generally, the effect of the application of the ACCG scenario in BPG 0 was to reduce costs at the same time as the number of life-years.
Although aggregated results alone can be of value to deci-sion-making entities, here they are accompanied by more detailed information from subgroup-specific results. This subgroup-specific information is of potential importance to decision-making entities, too. The aggregated ICER results presented here assume that individuals and groups are treated equally in keeping with ex ante equity concerns – i.e., that, as is usual in cost-effectiveness analyses, equity is restricted to a specific form of 'equitable efficiency' [64]. 'Equitably efficient' usually refers to a situation where reductions in life-years for one group are given an equal and opposite weight to gains in life-years in another. For example, here we assume that the relevant objective func-tion is the maximisafunc-tion of a proxy for health – life-years – and that each life-year is valued equally, irrespective of which group loses or gains it. However, generally, society-level decision-makers' objectives include separate
consid-erations of efficiency and equity. Therefore, whether the ACCG scenario represents an improvement in societal welfare and thus is preferable to the PCP scenario is a value judgement [65], and the applicability of the consid-eration of equity employed here is left for decision-makers to judge.
If the estimated trade-offs between the subgroups in terms of outcomes and costs are acceptable to decision-makers, then widespread implementation of the ACCG scenario is expected to reduce overall costs and be accompanied by positive outcomes overall.
Abbreviations
ACCG = the 2002 Antihypertensive Current Care Guide-line [23]
ACE = angiotensin-converting enzyme
ATC = Anatomical Therapeutic Chemical classification system
BP = blood pressure (indirect measurement using an external measuring device)
BPG = blood pressure group (see Table 2)
C03EA = hydrochlorothiazide or trichlormethiazide and potassium-sparing agents
C07A = beta-blocking agents
C07B = combination of metoprolol or bisoprolol and thi-azides
C07F = atenolol or metoprolol and, e.g., calcium channel blockers
C08 = calcium channel blockers
C09A = ACE inhibitors
C09BA = combination of ACE inhibitors and diuretics
C09BB = combination of ACE inhibitors and calcium channel blockers
C09C = angiotensin II subtype 1 receptor antagonists
C09D = combination of angiotensin II subtype 1 receptor antagonists and diuretics
CHD = coronary heart disease
CVE = cerebrovascular event
DBP = diastolic blood pressure
H2000 = Health 2000 health examination/interview sur-vey (2000–2001)
HRQL = health-related quality of life
ICER = incremental cost-effectiveness ratio (see Addi-tional file 1, Table 2 for further details)
LSC = lifestyle counselling (only used in the ACCG sce-nario)
MF = Mini-Finland health examination/interview survey (1978–1980)
PCP = prior clinical practice (clinical practice prior to the publication of the ACCG)
SBP = systolic blood pressure
SII = Finnish Social Insurance Institution (KELA)
Competing interests
Antti Jula declares: 'I was the chair of the task force which developed the evidence-based antihypertensive guidelines [23] and continue to be involved in the updating of these guidelines.'
Minna Kaila declares: 'I was the chief editor of Current Care Guidelines at the time this economic evaluation was initiated. I am still an editor, though on a strictly part-time basis (one day per month), and I am not directly involved with guideline development.'
All other authors declare that they have no competing interests.
Authors' contributions
MM, AJ, PR, KK-H, MK, TK, HS, and NB designed the study; NB, AJ, AR, and TK collected the data; NB, PA, and AR conducted the data analysis; NB, AJ, HS, PA, AR, MK, and MM drafted the paper; and HS, KK-H, MM, MK, AR, PA, and PR critically revised the paper. All authors have read and approved the final version of the manuscript.
Additional material
Additional File 1
Extra Tables. Supplementary information in tablular form.
Click here for file
[http://www.biomedcentral.com/content/supplementary/1472-6963-7-172-S1.pdf]
Additional File 2
Current Care guidelines. Supplementary information describing the Cur-rent Care guideline process.
Click here for file
[http://www.biomedcentral.com/content/supplementary/1472-6963-7-172-S2.pdf]
Additional File 3
Extra Figures. Supplementary figures.
Click here for file
[http://www.biomedcentral.com/content/supplementary/1472-6963-7-172-S3.pdf]
Additional File 4
Details of cost calculations. Detailed calculations of the non-pharmacolog-ical treatment-related costs for the ACCG and PCP scenarios.
Click here for file
[http://www.biomedcentral.com/content/supplementary/1472-6963-7-172-S4.pdf]
Additional File 5
Sensitivity analysis. Full results of the sensitivity analysis undertaken on subgroups.
Click here for file
[http://www.biomedcentral.com/content/supplementary/1472-6963-7-172-S5.pdf]
Additional File 6
Population sizes. Supplementary details concerning the size of the study and target populations.
Click here for file
[http://www.biomedcentral.com/content/supplementary/1472-6963-7-172-S6.pdf]
Additional File 7
Transition probabilities. Supplementary details concerning transition probabilities.
Click here for file
[http://www.biomedcentral.com/content/supplementary/1472-6963-7-172-S7.pdf]
Additional File 8
Main assumptions in this study. Supplementary details of the main assumptions used in this study.
Click here for file
Acknowledgements
We thank Harri Rissanen (Department of Health and Functional Capacity, National Public Health Institute) and Hilkka Ruuska (Social Insurance Insti-tution) for their splendid efforts in obtaining data and statistics from regis-ter databases. This CEA study was funded by STAKES/FinOHTA and the Finnish Medical Society Duodecim. Funding in kind was provided by the Department of Health and Functional Capacity at the National Public Health Institute and the Social Insurance Institution.
We thank Terhi Ilonen for her contribution to preparation of the manu-script, and in addition to the staff of FinOHTA and the Tampere School of Public Health we extend our gratitude to numerous other members of the research community who have helped greatly during the course of this research.
References
1. Ortegon MM, Redekop WK, Niessen LW: Cost-effectiveness of prevention and treatment of the diabetic foot: a Markov analysis. Diabetes Care 2004, 27:901-907.
2. Issakidis C, Sanderson K, Corry J, Andrews G, Lapsley H: Modelling the population cost-effectiveness of current and evidence-based optimal treatment for anxiety disorders. Psychol Med
2004, 34:19-35.
3. Spiegel BM, Targownik L, Dulai GS, Karsan HA, Gralnek IM: Endo-scopic screening for esophageal varices in cirrhosis: Is it ever cost effective? Hepatology 2003, 37:366-377.
4. Philips Z, Barraza-Llorens M, Posnett J: Evaluation of the relative cost-effectiveness of treatments for infertility in the UK. Hum Reprod 2000, 15:95-106.
5. Moore RD: Cost effectiveness of combination HIV therapy: 3 years later. Pharmacoeconomics 2000, 17:325-330.
6. Macintyre CR, Plant AJ, Hendrie D: The cost-effectiveness of evi-dence-based guidelines and practice for screening and pre-vention of tuberculosis. Health Econ 2000, 9:411-421.
7. Elliott WJ, Weir DR, Black HR: Cost-effectiveness of the lower treatment goal (of JNC VI) for diabetic hypertensive patients. Joint National Committee on Prevention, Detec-tion, EvaluaDetec-tion, and Treatment of High Blood Pressure. Arch Intern Med 2000, 160:1277-1283.
8. Ramsey SD, Neil N, Sullivan SD, Perfetto E: An economic evalua-tion of the JNC hypertension guidelines using data from a randomized controlled trial. Joint National Committee. J Am Board Fam Pract 1999, 12:105-114.
9. Kemper AR, Bordley WC, Downs SM: Cost-effectiveness analysis of lead poisoning screening strategies following the 1997 guidelines of the Centers for Disease Control and Preven-tion. Arch Pediatr Adolesc Med 1998, 152:1202-1208.
10. Cromwell J, Bartosch WJ, Fiore MC, Hasselblad V, Baker T: Cost-effectiveness of the clinical practice recommendations in the AHCPR guideline for smoking cessation. Agency for Health Care Policy and Research. Jama 1997, 278:1759-1766. 11. Richardson G, Godfrey L, Gravelle H, Watt I: Cost-effectiveness of
implementing new guidelines for treatment of hypertension in general practice. Br J Gen Pract 2004, 54:765-771.
12. Weinstein MC, Stason WB: Hypertension: a Policy Perspective.
Cambridge, Harvard University Press; 1976.
13. Swedish Council on Technology Assessment in Health Care (SBU):
Moderately elevated blood pressure. J Intern Med Suppl 1995,
737:1-225.
14. Russell LB: Cost-effectiveness of antihypertensive treatment. General considerations. Hypertension 1989, 13:I141-4.
15. Edelson JT, Weinstein MC, Tosteson AN, Williams L, Lee TH, Gold-man L: Long-term cost-effectiveness of various initial mono-therapies for mild to moderate hypertension. Jama 1990,
263:407-413.
16. Johannesson M, Dahlof B, Lindholm LH, Ekbom T, Hansson L, Oden A, Schersten B, Wester PO, Jonsson B: The cost-effectiveness of treating hypertension in elderly people--an analysis of the Swedish Trial in Old Patients with Hypertension (STOP Hypertension). J Intern Med 1993, 234:317-323.
17. Johannesson M, Wikstrand J, Jonsson B, Berglund G, Tuomilehto J:
Cost–effectiveness of antihypertensive treatment: metopro-lol versus thiazide diuretics. Pharmacoeconomics 1993, 3:36-44. 18. Johannesson M: The cost-effectiveness of the switch towards
more expensive antihypertensive drugs. Health Policy 1994,
28:1-13.
19. Johannesson M: The cost effectiveness of hypertension treat-ment in Sweden. Pharmacoeconomics 1995, 7:242-250.
20. Andersson F, Kartman B, Andersson OK: Cost-effectiveness of felodipine-metoprolol (Logimax) and enalapril in the treat-ment of hypertension. Clin Exp Hypertens 1998, 20:833-846. 21. Mar J, Rodriguez-Artalejo F: Which is more important for the
efficiency of hypertension treatment: hypertension stage, type of drug or therapeutic compliance? J Hypertens 2001,
19:149-155.
22. Montgomery AA, Fahey T, Ben-Shlomo Y, Harding J: The influence of absolute cardiovascular risk, patient utilities, and costs on the decision to treat hypertension: a Markov decision analy-sis. Journal of Hypertension 2003, 21:1753-1759.
23. [Finnish Hypertension Society's task force]: [Treatment of hyper-tension]. Duodecim 2002, 118:110-126.
24. Jula A, Puukka P, Karanko H: Multiple clinic and home blood pressure measurements versus ambulatory blood pressure monitoring. Hypertension 1999, 34:261-266.
25. Wood D, De Backer G, Faergeman O, Graham I, Mancia G, Pyörälä K: Prevention of coronary heart disease in clinical practice: recommendations of the Second Joint Task Force of Euro-pean and other Societies on coronary prevention. Eur Heart J
1998, 19:1434-1503.
26. TreeAge Software: TreeAge Pro (2006). Williamstown, MA: TreeAge Software, Inc. 2006.
27. Annex to the decree of the Ministry of Social Affairs and Health concerning the Health Insurance Act. 2003. 28. Sintonen H: The 15D instrument of health-related quality of
life: properties and applications. Ann Med 2001, 33:328-336. 29. R Development Core Team: A Language and Environment for
Statistical Computing. R Foundation for Statistical Computing 2005. 30. SAS Institute: SAS user's guide, version 6.12. Cary, NC: SAS
Institute, Inc. 1996.
31. Aromaa A, Koskinen S: Health and functional capacity in Fin-land : baseline results of the Health 2000 health examination survey. Edited by: Aromaa AKS. Helsinki, Publications of the National Public Health Institute, B12; 2004.
32. Anderson KM, Wilson PW, Odell PM, Kannel WB: An updated cor-onary risk profile: a statement for health professionals. Circu-lation 1991, 83:356-362.
33. Aromaa A, Heliövaara M, Impivaara O, Knekt P, Maatela J, Joukamaa M, Klaukka T, Lehtinen V, Melkas T, Mälkiä E, Nyman K, Paunio I, Reunanen A, Sievers K, Kalimo E, Kallio V: Terveys, toimintakyky ja hoidontarve Suomessa. Mini-Suomi-terveystutkimuksen perustulokset (Health, functional limitations, and need for care in Finland: basic results from the Mini-Finland Health Survey, in Finnish with an English summary). In English sum-mary: Health, functional limitations and need for care in Finland Basic results from the Mini-Finland Health Survey Helsinki and Turku, Publica-tions of the Social Insurance Institution, AL:32; 1989:792.
34. Sonnenberg FA, Beck JR: Markov models in medical decision making: a practical guide. Med Decis Making 1993, 13:322-338. 35. MacMahon S, Peto R, Cutler J, Collins R, Sorlie P, Neaton J, Abbott R,
Godwin J, Dyer A, Stamler J: Blood pressure, stroke, and coro-nary heart disease. Part 1, Prolonged differences in blood pressure: prospective observational studies corrected for the regression dilution bias. Lancet 1990, 335:765-774. 36. Hujanen T: [Guidelines for health care unit costs in Finland
2003]. National Research and Development Centre for Welfare and Health (STAKES), Helsinki Aiheita 1/2003 .
37. Kastarinen MJ, Puska PM, Korhonen MH, Mustonen JN, Salomaa VV, Sundvall JE, Tuomilehto JO, Uusitupa MI, Nissinen AM: Non-phar-macological treatment of hypertension in primary health care: a 2-year open randomized controlled trial of lifestyle intervention against hypertension in eastern Finland. J Hyper-tens 2002, 20:2505-2512.
Publish with BioMed Central and every scientist can read your work free of charge
"BioMed Central will be the most significant development for disseminating the results of biomedical researc h in our lifetime."
Sir Paul Nurse, Cancer Research UK
Your research papers will be:
available free of charge to the entire biomedical community
peer reviewed and published immediately upon acceptance
cited in PubMed and archived on PubMed Central
yours — you keep the copyright
Submit your manuscript here:
http://www.biomedcentral.com/info/publishing_adv.asp
BioMedcentral
39. The Social Insurance Institution of Finland: Reimbursement of medicine costs: a glossary. [accessed 12.07.2006]. [http:// www.kela.fi/in/internet/english/english.nsf/NET/220703141254MP]. 40. Kastarinen MJ, Puska PM, Korhonen MH, Mustonen JN, Salomaa VV,
Sundvall JE, Tuomilehto JO, Uusitupa MI, Nissinen AM: Non–phar-macological treatment of hypertension in primary health care: a 2-year open randomized controlled trial of lifestyle intervention against hypertension in eastern Finland. J Hyper-tens 2002, 20:2505-2512.
41. Mullins CD, Sikirica M, Seneviratne V, Ahn J, Akhras KS: Compari-sons of hypertension-related costs from multinational clini-cal studies. Pharmacoeconomics 2004, 22:1001-1014.
42. Flack JM, Casciano R, Casciano J, Doyle J, Arikian S, Tang S, Arocho R: Cardiovascular disease costs associated with uncontrolled hypertension. Manag Care Interface 2002, 15:28-36.
43. Zethraeus N, Molin T, Henriksson P, Jonsson B: Costs of coronary heart disease and stroke: the case of Sweden. JInternMed 1999,
246:151-159.
44. Jonsson B: Measurement of health outcome and associated costs in cardiovascular disease. EurHeart J 1996, 17 Suppl A:2-7.
45. Russell MW, Huse DM, Drowns S, Hamel EC, Hartz SC: Direct medical costs of coronary artery disease in the United States. Am J Cardiol 1998, 81:1110-1115.
46. Fahey T, Schroeder K, Ebrahim S: Interventions used to improve control of blood pressure in patients with hypertension. Cochrane Database Syst Rev 2006:CD005182.
47. Krahn MD, Naglie G, Naimark D, Redelmeier DA, Detsky AS:
Primer on medical decision analysis: Part 4 – Analyzing the model and interpreting the results. Med Decis Making 1997,
17:142-151.
48. Law MR, Wald NJ, Morris JK, Jordan RE: Value of low dose com-bination treatment with blood pressure lowering drugs: analysis of 354 randomised trials. BMJ 2003, 326:1427-1434. 49. Canadian Agency for Drugs and Technologies in Health: Guidelines
for the economic evaluation of health technologies: Canada [3rd Edition]. 2006.
50. Black WC: The CE plane: a graphic representation of cost-effectiveness. Med Decis Making 1990, 10:212-214.
51. Doubilet P, Weinstein MC, McNeil BJ: Use and misuse of the term "cost effective" in medicine. N Engl J Med 1986,
314:253-256.
52. Sacks FM, Svetkey LP, Vollmer WM, Appel LJ, Bray GA, Harsha D, Obarzanek E, Conlin PR, Miller ER 3rd, Simons-Morton DG, Karanja N, Lin PH: Effects on blood pressure of reduced dietary sodium and the Dietary Approaches to Stop Hypertension (DASH) diet. DASH-Sodium Collaborative Research Group. N Engl J Med 2001, 344:3-10.
53. Jula AM, Karanko HM: Effects on left ventricular hypertrophy of long–term nonpharmacological treatment with sodium restriction in mild–to-moderate essential hypertension. Cir-culation 1994, 89:1023-1031.
54. Jula A, Ronnemaa T, Rastas M, Karvetti RL, Maki J: Long-term nop-harmacological treatment for mild to moderate hyperten-sion. J Intern Med 1990, 227:413-421.
55. Editors: English summary of the 2005-updated Hypertension Current Care guideline. Current Care Summaries [http://www.kay pahoito.fi/kh/kaypahoito?suositus=ccs00014].
56. Fretheim A, Aaserud M, Oxman AD: The potential savings of using thiazides as the first choice antihypertensive drug: cost-minimisation analysis. BMC Health Serv Res 2003, 3:18. 57. National Collaborating Centre for Chronic Conditions:
Hyperten-sion: management of hypertension in adults in primary care: partial update. 2006.
58. Gissler M: Routinely collected registers in Finnish health research. In Statistics, registries, and science - experiences from Finland
Edited by: Alho J. Keuruu, Statistics Finland; 1999:241–54.
59. Keskimäki I, Aro S: Accuracy of data on diagnoses, procedures and accidents in the Finnish Hospital Discharge Register. Internal Journal of Health Sciences 1991, 2:15-21.
60. Schneider JE, Peterson NA, Vaughn TE, Mooss EN, Doebbeling BN:
Clinical practice guidelines and organizational adaptation: a framework for analyzing economic effects. Int J Technol Assess Health Care 2006, 22:58-66.
61. Gold MR, Siegel JE, Russell LB, Weinstein MC: Cost-effectiveness in health and medicine. Oxford, Oxford University Press; 1996.
62. Kiiskinen U, Vartiainen E, Puska P, Aromaa A: Long-term cost and life–expectancy consequences of hypertension. Journal of Hypertension 1998, 16:1103-1112.
63. Barton P, Bryan S, Robinson S: Modelling in the economic evalu-ation of health care: selecting the appropriate approach. J Health Services Research and Health Policy 2004, 8:110-118.
64. Dowie J: Towards the equitably efficient and transparently decidable use of public funds in the deep blue millennium. Health Econ 1998, 7:93-103.
65. Birch S, Gafni A: Cost effectiveness/utility analyses. Do current decision rules lead us to where we want to be? J Health Econ
1992, 11:279-296.
Pre-publication history
The pre-publication history for this paper can be accessed here: