R E S E A R C H A R T I C L E
Open Access
Fast selection of miRNA candidates based on
large-scale pre-computed MFE sets of
randomized sequences
Sven Warris
1, Sander Boymans
2, Iwe Muiser
1, Michiel Noback
1, Wim Krijnen
1and Jan-Peter Nap
1*Abstract
Background:Small RNAs are important regulators of genome function, yet their prediction in genomes is still a major computational challenge. Statistical analyses of pre-miRNA sequences indicated that their 2D structure tends to have a minimal free energy (MFE) significantly lower than MFE values of equivalently randomized sequences with the same nucleotide composition, in contrast to other classes of non-coding RNA. The computation of many MFEs is, however, too intensive to allow for genome-wide screenings.
Results:Using a local grid infrastructure, MFE distributions of random sequences were pre-calculated on a large scale. These distributions follow a normal distribution and can be used to determine the MFE distribution for any given sequence composition by interpolation. It allows on-the-fly calculation of the normal distribution for any candidate sequence composition.
Conclusion:The speedup achieved makes genome-wide screening with this characteristic of a pre-miRNA sequence practical. Although this particular property alone will not be able to distinguish miRNAs from other sequences sufficiently discriminative, the MFE-based P-value should be added to the parameters of choice to be included in the selection of potential miRNA candidates for experimental verification.
Keywords:MicroRNA, Minimal free energy, Grid computing, Epstein-Barr virus
Background
Small RNAs are important molecules in the regulation of gene expression. Several classes of distinct small RNA molecules play vital roles in development, health and disease, as well as in many other biological pathways [1-4]. A particular class of regulatory small RNAs are the microRNA (miRNA) molecules. A miRNA is a ~20-23 nucleotide (nt) short, non-protein coding RNA. Together with several protein components, miRNAs reduce the amount of a target mRNA by physical interaction to not-ably the 3′-untranslated region (3′-UTR) of the mRNA, resulting in either degradation of that mRNA, or arrest of translation [4-6]. In rare cases, miRNAs can also upregu-late expression [4,7]. Well over 25 thousand miRNAs (miRBase Release 19; August 2012 [8]) have now been identified in many different species [9,10].
The overall biogenesis of miRNAs is well established [4,11], although details are still being discovered. In all cases except for intronic miRNAs [12], the miRNA is synthesized as a longer primary transcript known as primary miRNA (pri-miRNA), that is processed in the nucleus by the RNAse Drosha in animals and Dicer-like 1 in plants, to generate a precursor miRNA (pre-miRNA) of about 80–100 nt in animals, 60–300 nt in plants or 60–120 nt in (animal) viruses. The pre-miRNA sequence has degenerated palindromic sequence with the character-istic secondary structure of a stem-loop hairpin. The final verdict on the total number of miRNAs in a given genome is not out yet. The total count in Release 19 of miRBase is 25,141 for all organisms and many more miRNAs are de-scribed in the primary literature. Whereas the search for miRNAs in model genomes such as human or Arabidopsis will approach saturation, identification of the full miRNA complement in other genomes is still a challenge.
* Correspondence:[email protected] 1
Expertise Centre ALIFE, Institute for Life Science & Technology, Hanze University of Applied Sciences, Groningen, The Netherlands Full list of author information is available at the end of the article
As mature miRNAs are only ~22 nt in length, straight-forward alignment-based heuristic methods such as BLAST are less suitable for identifying miRNAs and their targets in a given genome or transcriptome [5,13]. The identification of miRNAs and their targets is therefore a challenge for computational pattern recognition [11,14]. Computational methods for miRNA identification focus on the typical extended stem-loop hairpin structure of the pre-miRNA, which is characterized by helical base pairing with a few internal bulges in the stem. To identify the stem-loop miRNA precursor structure from a given se-quence, RNA folding programs are used, such as mfold [15], its update UNAfold [16], or RNAfold (also known as the Vienna package [17,18], to establish the minimal free energy (MFE) of the stem-loop structure.
Increasingly sophisticated computational approaches have been proposed for the identification of pre-miRNAs, the mature miRNA sequence and its presumed target(s) [19-21], many of which are available online [22]. Many ap-proaches are based on supposed or derived characteristics of miRNA sequences or combinations thereof [23-26]. Although all miRNAs are thought to have such properties in common, not a single property individually seems able to distinguish miRNAs sufficiently accurately from other RNA molecules with sufficient accuracy [27]. Several approaches therefore include evolutionary conservation of miRNA sequences between different species [1,28]. In these evolution-based strategies, species-specific and non -or less- conserved pre-miRNA molecules are likely to escape identification. Overall, methods available tend to show relatively high rates of false positives [22] and are possibly hampered by the use of inappropriate controls [29]. They generally result in lists too long to be feasible for experimental validation.
We here revisit a selective criterion proposed earlier, but largely unexplored because of computational costs. Statistical analyses of pre-miRNA hairpins indicated that such hairpins tend to have MFE values which are signifi-cantly lower than the MFE values based on randomized sequences with the same length and nucleotide compos-ition, in contrast to other classes of RNA, such as transfer RNA, ribosomal RNA and messenger RNA [30-32]. In MFE analysis, the sequence composition of each candidate sequence is randomized and the MFE value based on the candidate is compared to the MFE distribution based on the randomized sequences. These data are used to calculate the probability that the MFE of the candidate is sufficiently small compared to randomized sequences [30]. This probability is here coined the empirical P-value (PE). This PE establishes a useful discriminating criterion
for pre-miRNA identification. It is implemented in the MiPred prediction tool [33], that helps to decide for a sin-gle sequence whether it is a pre-miRNA hairpin. However, the computation of large numbers of MFE values per
candidate sequence to be able to calculate PEis
compu-tationally demanding, which precludes application to genome-wide analyses. Solutions proposed in the litera-ture are a probabilistic implementation of the MFE computation [34] or asymptotic Z-scores of the MFE distribution based on precomputed tables [35]. We here present a novel approach that requires the computation of only the MFE based on the candidate sequence. This approach enables the routine evaluation of potential miRNA structures on a genome-wide scale that could be integrated as part of an existing approach for pro-cessing potential miRNA sequences [20,36].
Methods Data
The miRNA data set was downloaded from the miRbase repository [8-10] (releases 9.2 and 15), consisting of 4,584 and 15,172 pre-miRNA sequences respectively. The genomic sequence of the Epstein Barr virus type 1 [37] was downloaded from Genbank NCBI [gi|82503188|ref| NC_007605.1]. The test set with 250,000 random se-quences was generated with a small C program.
Hardware
Computations were performed on a 200 +−node Debian Linux-based network. A dedicated server is running Network File System (NFS)-based software for file man-agement and Condor software ([38]; version 7.6.1) for grid management [39].
RNA folding software
The minimal free energy of a sequence was computed with a local implementation of the Hybrid software (version 2.5) of the UNAFold software package [16,40]. UNAFold extends and replaces the earlier mfold application [15]. The software was adjusted to enhance the performance about three-fold by optimizing computation-intensive computational steps without changing the underlying algorithm. All RNA molecules were folded as single strands at 30°C, a sodium concentration of 1.0 M and the option –E (energy only, no plots). In case of se-quences that are not able to fold properly, the Hybrid software assigns an MFE of +∞.
Randomization and visualization
Distribution fitting, P-values and other statistics were computed with the software suite R (version 2.7.1.) [41]. To randomize sequences while maintaining the nucleotide composition, the Fisher-Yates shuffling procedure for se-lection without replacement was implemented in C, with appropriate unbiased randomization [42]. For any candi-date sequence, the empirical P-value PEwas computed as
PE= X/(N + 1) [30], where X is the number of sequences
the candidate sequence and N is the number of random-ized sequences considered. In this study, N is taken as 1,000, in correspondence with an earlier study [30]. As a consequence, the lower bound of PEis zero (for X = 0) and
the next lowest value is 0.000999 (for X = 1). There are no additional assumptions necessary with respect to the shape of the distribution of the MFE values [30]. The com-puted MFE values based on the randomized sequences were transformed into a normal (Gaussian) distribution defined by the mean and standard deviation of the MFE values. The normal distribution-derived PN of the MFE
based on the given candidate sequence is being com-puted using the mean and standard deviation of that distribution. Results were visualized with R and MatLab (release 13).
Multidimensional interpolation
A database of entry RNA sequences, with a length of 50 to 300 nt and a step size of 5 nt, was generated by computer. This range covers the length of most known pre-miRNAs, except for some plant miRNAs [43]. For each sequence length, the nucleotide composition of the sequence was varied in such a way that each of the four nucleotides oc-curs at least once (for sequences < 100 nt) or at least at 1% (for sequences > 100 nt). Per sequence length, individual sequences were generated with a step size for an individ-ual nucleotide of 2%, except in the range from 20-70% for an individual nucleotide where a step size of 1% was used. The procedure in numbers is as follows: for a population of sequences with a length of 50nt, the first nucleotide composition consists of 1% A, 1% U, 1% C and 97% G. In the next step the composition is 2% A, 1% U, 1% C and 96% G and so on. Then the length is increased to 55 nt and the procedure is repeated for the nucleotide compos-ition, etc. This procedure generated a set of 1.4 × 10⁶entry sequences. For each of the individual entry sequences, a sequence set of thousand randomized shuffles was gener-ated by Fisher-Yates randomization [42]. This procedure represents a selection without replacement, therefore maintains the nucleotide composition (mononucleotide shuffling). Sequence sets in which one or more shuffled sequences had an MFE of +∞were discarded and only the sequence sets with 1,000 MFE values were considered to maintain statistical validity. This way, a total of 1.05 × 10⁶ sequence sets were generated. For each population, the mean MFE and standard deviation were computed and stored in a MySQL database together with the sequence composition in absolute nucleotide counts. To calculate the mean and standard deviation for any candidate se-quence, an interpolation algorithm was implemented in C++ using sparse matrix data management for optimal memory use [44]. A sparse matrix contains only the values of interest and all zero or unknown values are not stored. The resulting data structure contains only
the nucleotide composition analysed and not all possible compositions, therefore the data can be stored in memory and searched efficiently. The Hybrid software used for RNA folding [16] was integrated within this application to enhance performance.
Sliding window analysis
To analyse whole genomes for the presence of potential pre-miRNA candidates using the pre-computed MFE data outlined above, a sliding window approach was im-plemented in C++. The smallest window length was set at 50 nt, incremented with a step size of 10 nt to a maximum of 300 nt. For each window length, the step size for sliding was set at 10% of the window length. For each window, the MFE was computed and the nucleotide composition of the sequence was determined. Based on the sequence composition, the appropriate mean and standard deviation were estimated by interpolation (see Results) using the data search space generated. The normal distribution function was used to calculate PN of the MFE of the
window.
Results and discussion
In the identification of potential pre-miRNA candidates in genomic sequences, the MFE based on the sequence relative to the distribution of random sequences with the same nucleotide composition is a potentially valuable criterion. However, the estimation of the empirical PE
as parameter for the distance between the MFE based on a candidate sequence and the MFEs of randomized sequences is computationally intensive. It requires the computation of the MFE for all randomized sequences. To use the MFE distribution as criterion more comfort-ably, computations should be considerably faster. We here show the feasibility of the use of the normal distribution for the computation of PNas approximation of PEand for
the interpolation of the distribution for any given se-quence with the help of pre-computed MFE distributions of random sequences.
0.2 sec CPU time. The 1.4 × 106 × 1,000 computations would therefore have taken about 8.8 CPU years on a standard PC. Using idle CPU cycles on our grid, it took about 2 months grid time to complete all computa-tions. All MFE values were computed for an annealing temperature of 30°C, but as MFE values and distributions change in a linear way with temperature (results not shown), the approach presented and data generated are, if so desired, suitable for, or comparable with, other folding temperatures.
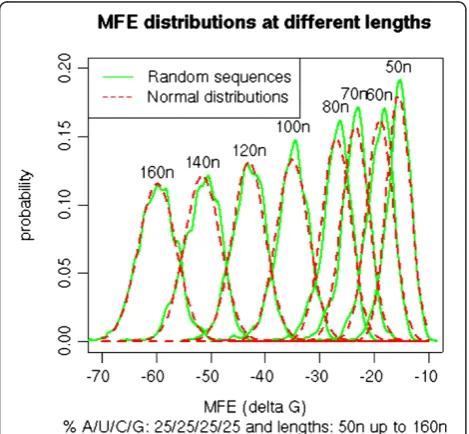
Randomized sequence sets can reasonably be consid-ered to reflect a normal distribution. The examples for sets with 25% nucleotide composition are shown in Figure 1. Other compositions give similar results (data not shown). Such a normal distribution was demonstrated earlier for randomized sequences [45], although the distribution may not be an exact Gaussian distribution [34]. The MFE data of random sequences are therefore suitable for deriving the normal estimate PN of PE, based on mean, standard
deviation and the normal distribution function. This way, PNis equivalent to theZ-score of the MFE, defined as the
number of standard deviations by which the MFE based on a candidate sequence deviates from the mean MFE of the set of shuffled sequences [31,45].
For each sequence set, the mean and standard deviation was stored in a database together with the sequence com-position. An example of the distribution of the mean MFE value of all sequence sets of 100 nt in length with different sequence compositions is shown in Figure 2. The 3D con-tour plot shows that the sets of sequences with high per-centages of C and G nucleotides have low mean MFE values, which reflects the higher energy in C-G pairing. RNA molecules with an abundance of for example A and G are much less likely to form a stable structure and the set of 1,000 random sequences will therefore have a high mean MFE. The plot shows that the mean MFE values decrease in an almost linear fashion from the low values for sequences with high C and G compositions to the outer edges.
Multidimensional interpolation for candidate sequences For the on-the-fly computation of the MFE distribution based on a given candidate sequence, the pre-computed data are used for multidimensional interpolation. For each candidate sequence, the composition of the sequence is determined by counting nucleotides. Sequence compo-sitions with a squared Euclidean distance up to 5 in the surrounding search space are identified: the length of the sequence is therefore not taken into account. This value was selected on the basis of the analysis of known miRNAs. These analyses showed this threshold gives the smallest difference in P-value (data not shown) when comparing the PN to the PE of mirbase entries. For
se-quence compositions that have no points within this distance no prediction can be made and a PN of 1.0 is
given. From the selected near-by sequences, the mean and standard deviations are retrieved from the database. For the candidate sequence, both mean and standard deviation of the MFE distribution are determined by interpolation using the data from the nearby sequence compositions, weighted based on their Euclidean distance to the candidate sequence. The sum of the weighted values gives the estimated mean and standard deviation of the MFE distribution based on the randomized sequences from the candidate sequence. Mathematically, the formu-lae to derive the estimated averageμeare expressed as:
μe¼
XN−1
i¼0ωiμi
XN−1
i¼0ωi
with ωi¼dt−di
dt ;
di¼
ffiffiffiffiffiffiffiffiffiffiffiffiffiffiffiffiffiffiffiffiffiffiffi X3
i¼0
xi−yi
ð Þ2 v
u u
t and dt¼XN−1
i¼0
di
wherewiis the weight per data point based on Euclidean
distance,di is the distance per point, for which xiand yi
[image:4.595.57.292.396.613.2]are the nucleotide counts of the sequence in the search Figure 1Distribution of PEand PNof sequences of different
lengths.For a candidate sequence with the given length in nucleotidesn(50 to 160) and a composition of 25% of each nucleotide (AUGC), the MFE of 1000 randomized sequences was calculated. The distribution was computed and plotted (green) using the distribution density function in R. The average mean and standard deviation of the resulting MFE sequence set was used to define the normal distribution function (red). The good
space anddtis the total distance over N points. N varies
per candidate sequence. Even in the case were the
dis-tance to a point is zero (di= 0), more points are used to
estimate the population average. Testing on sequences with the same compositions during computations would
slow the software down and this situation is unlikely therefore it was not included in the software.
The use of PN as normal approximation of PE was
[image:5.595.54.538.91.605.2]PE(green) and PN(red) is shown for a range of sequences
with different lengths but the same nucleotide composi-tions. Other compositions give similar results (data not shown). The excellent goodness-of-fit demonstrates the suitability of the normal approximation PN as criterion
for the evaluation of pre-miRNA candidate sequences. The estimation of the standard deviation of the MFE distribution based on the candidate sequence is based on the approach for estimating the mean as described in the previous section. The mean and standard deviation uniquely define the normal distribution function of the candidate sequence. With the two values, PNis computed
as the normal probability of MFE values smaller than the MFE based on the candidate sequence. This way, for each candidate sequence, only the MFE of the structure based on this sequence needs to be computed, speeding up com-putations approximately a thousand-fold when thousand shuffled sequences are used. As the calculations of the es-timated mean, standard deviation and the P-value based on this normal distribution take time as well, the software is at least several hundred times faster for short sequences and faster for long candidates: the Hybrid software used is slower for longer sequences, as there are more secondary structures. Calculating the structures of 1000 candidates takes therefore considerably more time than the estima-tion process. Based on the running time of an example
run it would take over 260 seconds to calculate 1000 MFE values. The calculation of PNtakes approximate a second,
including the calculation of the MFE.
We evaluated the performance of PN compared to PE
for selection with respect to the entries in the MiRBase registry. In Figure 3, the distribution of PEover the
pre-miRNA molecules as published previously [30] is com-pared with the PE computed of the current pre-miRNAs
from miRbase with the same method [30] and the PN as
estimated by interpolation. It shows that the interpolation approach performs well. The difference between PE and
PNreflects that the PNdistribution is continuous, whereas
with 1,000 randomizations, the PE distribution is discrete
with a step size of 1/1001 = 0.000999. Although also PN
is estimated on the basis of 1,000 randomizations, the continuity of the distribution allows more strict settings for PNand allows a more sensitive ranking in the lower
P-value ranges. In Table 1, the percentages of pre-miRNAs that conform to given settings of the P-value are shown. With a threshold of PN= 1×10⁻⁴, about 66.8% of all known
pre-miRNAs are characterized by an MFE value well outside the distribution of MFE values of randomized sequences. Only 1% could not be estimated: the sequence was either too long or had no populations in the data set within the given distance.
To verify the performance of the applications on random sequences, a test set of 250,000 sequences was generated; all of different lengths and composition. The MFE and PN
were calculated for each of these sequences. The calcula-tions were finished in 20 minutes. In Table 1 the results are shown. Of these random sequences, 4% had no stable structure and hence no MFE and 17% had no populations in the data set within the given distance. Of the remaining sequences only 3% had a PN< 0.05.
Shuffling inconsistencies
In the analyses above, a mononucleotide randomization method (Fisher-Yates algorithm) was used [42], whereas in the literature a dinucleotide randomization method was recommended and used [30,31,46]. In genome-wide analyses of candidate sequences based on PN, we observed
that several candidate sequences behaved oddly: whereas dinucleotide shuffling yielded PN= 0,98, reflecting not a
[image:6.595.57.291.89.206.2]likely candidate, mononucleotide shuffling as performed Figure 3Relative performance of MFE-based P-value
estimations.The percentage of pre-miRNAs with a P-value smaller than indicated is plotted for data previously published [30], newly computed values from release 9.2 of MirBase based on the same method and computed based on the interpolation method developed here. The previously published percentages based on PE were 97%, 91% and 76%, respectively, whereas based on the release 9.2 it is 95%, 87% and 65%, and PN96%, 93% and 87%, respectively.
Table 1 Percentage of sequences with low P-values
Data set Total # sequences
analyzed
% sequences with an error/not found
% sequences with P <0.05
% sequences with P <0.01
% sequences with P < =0.001
% sequences with P < =0.0001
Random 250000 21.3 3.0 1.5 0.8 0.5
MirBase 15172 1.0 89.9 84.4 75.9 66.8
EBV known miRNAs 25 0.0 96.0 92.0 88.0 76.0
EBV genome 566988 0.1 19.1 10.7 5.7 3.6
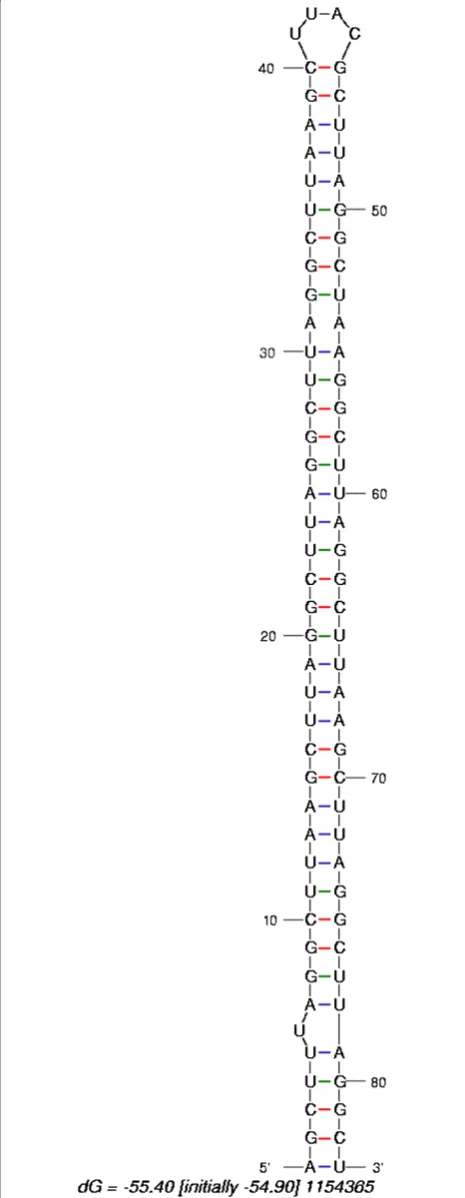
[image:6.595.56.540.639.715.2]here resulted in a PN< < 0.001, indicating a possible
candi-date. An example of such a sequence is given in Figure 4, which shows a predicted hairpin structure for this sequence. To prevent such sequences interfering with the analysis of the distribution, the mononucleotide randomization method was used.
Added value for miRNA prediction
Having validated the PNinterpolation method with known
miRNAs, we now show the added value for whole genome screening. We have evaluated a small viral genome for putative pre-miRNAs regions. According to miRBase (both in release 15 and 19), this viral genome has 25 known pre-miRNA sequences. Of the 25 known Epstein-Barr virus (EBV) miRNAs, 24 have a PN< 0.05 with 22
having a PN< = 0.001 (Table 1). Both strands of the
dsDNA genome sequence of the human Epstein-Barr virus type 1 [37] were converted into RNA and investi-gated for potential pre-miRNA sequence. For each of the total 566,988 windows of length 50–230 nt, the MFE and the PN were computed. In contrast to the test set with
random sequences, in EBV only 0.05% of the windows could not be estimated due to no sequence compositions within the given distance or because the sequence did not have a Stable 2D structure. This shows that the application performs very well for viral genomic DNA. The percent-age of windows with a PN< =0.001 is higher than in the
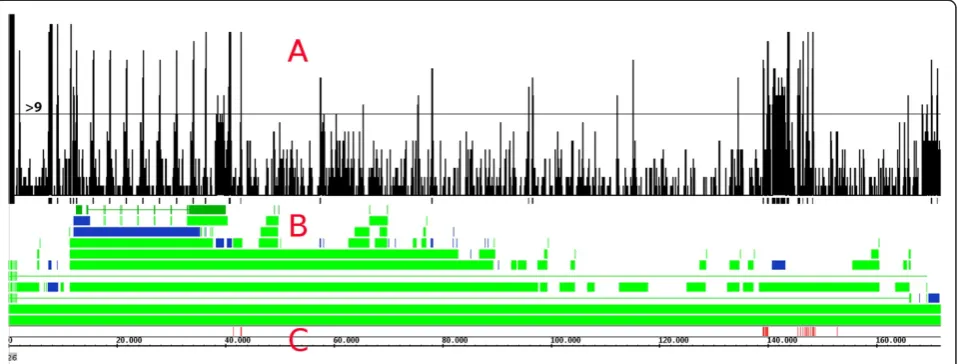
test set with random sequences (Table 1). There is also the effect of overlapping windows: a pre-miRNA of length 150 will be found in several windows of length 200. Many of these candidate windows are in repeat regions (Figure 5). These windows can be discarded as not being viable loca-tions for miRNAs: there are no known miRNAs within the EBV repeat regions. Although current research shows that in some organisms miRNAs can be found in repeat regions [47], we suggest inspection of other regions first to limit the number of relevant candidate regions.
To visualize regions of interest, the windows with a PN< = 0.001 are placed in a separate data set and
marked with a value of one. The windows of different lengths are then combined in the Integrated Genome Browser [48] (Figure 5). With 19 different window lengths, the maximum of the resulting graph is 19. This indicates that all windows covering this location have a PN< =0.001. The peaks in the graph show regions of
interest which require further research. The graph shows 18 regions-of-interest in the plus strand where 9 or more windows have PN< = 0.001. Using these selection
[image:7.595.305.538.93.693.2]criteria, the regions of 12 known miRNAs are found (Figure 5). Using less than 9 windows will give more regions-of-interest and will also show more known miRNA regions, but will introduce more false positives as well. The analysis of the EBV genome shows that a (small) whole genome screening using PN-estimation
results in a limited number of regions-of-interest for further investigation.
Conclusion
Previous research has indicated that the MFE based on a miRNA sequence is significantly lower than the MFE based on shuffled sequences with the same compos-ition, in contrast to the MFE of other non-coding RNAs [30,31,49]. As the computation of an MFE is demanding, this characteristic of miRNAs precludes genome screening of sequences for their MFE distribution. With thousand randomizations per candidate sequence, the genome-wide screening of a million (106) candidates would require a billion (109) computations. These would take well over six year to finish on a current standard desktop computer.
We have presented a method to speed up analyses of the MFE distribution considerably, based on the normal approximation of pre-calculated MFE distributions based on random sequences, combined with a fast implementa-tion of a multidimensional interpolaimplementa-tion of distribuimplementa-tions in sequence space. The data cover the search space for all RNA molecules with a length from 50 to 300 nt, in total roughly equaling the sum over 4i for i = 50….300≈ 5.5.10180 sequences. With three data points per sequence (mean, standard deviation and composition), this would generate an immense database, whereas the resulting data space here established is based on 1.1 × 10⁶sequences and takes about 30 Mb. The latter is easily handled by stand-ard amounts of RAM. The results show that although the newer miRNAs added to miRBase since 2006 seems to comply somewhat less with this criterion than the
miRNAs analyzed before [50], the new approach developed here performs well on known pre-miRNAs (Figure 3).
Sequence sets of 1,000 with at least one non-folding member were discarded. Yet, it could be argued that higher accuracy would be gained with more sets. The data is well distributed over the sequence data space (Figure 2). The interpolation of MFE distributions is based on a threshold of the Euclidian distance of the surrounding data points. This implies that for different candidate sequences different amounts of pre-computed data are used to estimate the MFE distribution. This pre-vents interpolation issues at the boundaries of the data space where less points are available. The data reduction and interpolation results in considerably faster computa-tion of the likelihood that the MFE of the sequence is markedly lower than equivalent randomized sequences. This obviates the need for on-the-fly computation of the MFE values based on the randomized sequences.
[image:8.595.60.540.90.272.2]respect to dinucleotide shuffling (Figure 4) and may dis-tort the distribution derived from the computed MFE values. Inspection of such sequences indicated that these sequences contain a particular combination of repeat units in such a way that the dinucleotide shuffling is not chan-ging the sequence in terms of MFE distribution. As a re-sult, the candidate MFE is part of the distribution of shuffled sequences. As Fisher-Yates shuffling is the most random, this would seem to be the better method. We have followed the earlier recommendation of performing at least 1,000 randomizations [30], whereas other investi-gations use 500 [31] or 10,000 [51]. As few as 100 ran-domizations were recommended as sufficient to establish a reasonable Gaussian distribution [45].
In view of the gain in computing speed accomplished with PN, it has become feasible to consider genome-wide
screenings for pre-miRNA candidates based on PN. The
analyses here presented for the relatively small Epstein Barr virus demonstrate that indeed such analysis is now within reach. For a human genome, however, the approach will still ask a considerable computational effort. More-over, the MFE alone is not able to distinguish miRNAs from other sequences sufficiently discriminative: it has to be integrated with other parameters. The PN approach
presented here can therefore be better implemented as part of, or next to, other approaches [20,22]. Such ap-proach would generate added value for such miRNA identification algorithms or pipelines. The application of this criterion will add to enhanced selectivity of miRNA discovery pipelines and help to limit the number of candidates for experimental validation and confirmation.
The advent of high throughput DNA sequencing technologies were shown to be particularly suitable for the analyses of the small RNA complement of RNA populations [4]. The identification of true miRNAs in such data sets is still a challenge to which the PN
ana-lysis may contribute. The possibility of a one-time effort to pre-compute sequence parameters that will facilitate future analyses should be considered an approach that could generate considerable added value for larger grid environments in future bioinformatics.
Competing interests
The authors declare that they have no competing interests.
Authors’contributions
SW invented the prediction method, performed most of the data analyses, including the EBV analyses, wrote the software and the manuscript. SB and IM created part of the data set and performed quality checks. MN and WK provided statistical and biological interpretations and analyses. JPN directed the research, provided additional biological interpretations and was involved in drafting the manuscript. All authors contributed to, read and approved the manuscript.
Acknowledgements
We would like to thank Piet Plomp, MSc and Marcel Kempenaar, BASc for help with the computer grid, Dr. Peter Terpstra (Department of Genetics, University Medical Center Groningen, The Netherlands) and Rudi van Bavel
BASc (now at Keygene NV) for sharing ideas and Dr. Mark Fiers at Plant Research International, Wageningen University and Research Centre, Wageningen, The Netherlands (now at VIB Center for the Biology of Disease, KU Leuven, Belgium), for valuable discussion and input. This research was funded in part by a PhD fellowship (SW) from Hanze University of Applied Sciences Groningen.
Author details
1Expertise Centre ALIFE, Institute for Life Science & Technology, Hanze University of Applied Sciences, Groningen, The Netherlands.2Hubrecht Institute, Utrecht, The Netherlands.
Received: 6 August 2013 Accepted: 7 January 2014 Published: 13 January 2014
References
1. Chapman EJ, Carrington JC:Specialization and evolution of endogenous small RNA pathways.Nat. Rev. Genet.2007,8:884–896.
2. Almeida MI, Reis RM, Calin GA:MicroRNA history: Discovery, recent applications, and next frontiers.Res: Mutat; 2011.
3. Abbott AL:Uncovering new functions for microRNAs in Caenorhabditis elegans.Curr. Biol.2011,21:R668–R671.
4. Pasquinelli AE:MicroRNAs and their targets: recognition, regulation and an emerging reciprocal relationship.Nat. Rev. Genet.2012,13:271–282. 5. Bartel DP:MicroRNAs: Target Recognition and Regulatory Functions.
Cell2009,136:215–233.
6. Bartel DP:MicroRNAs: genomics, biogenesis, mechanism, and function. Cell2004,116:281–297.
7. Vasudevan S, Tong Y, Steitz JA:Switching from repression to activation: MicroRNAs can up-regulate translation.Science2007,318(80):1931–1934. 8. MirBase: [http://www.mirbase.org]
9. Griffiths-Jones S, Saini HK, van Dongen S, Enright AJ:miRBase: tools for microRNA genomics.Nucleic Acids Res.2008,36:D154–D158.
10. Kozomara A, Griffiths-Jones S:miRBase: integrating microRNA annotation and deep-sequencing data.Nucleic Acids Res.2011,39:D152–D157. 11. Ghosh Z, Chakrabarti J, Mallick B:miRNomics-The bioinformatics of microRNA genes.Biochem. Biophys. Res. Commun.2007,363:6–11. 12. Westholm JO, Lai EC:Mirtrons: microRNA biogenesis via splicing.
Biochimie2011,93:1897–1904.
13. Freyhult EK, Bollback JP, Gardner PP:Exploring genomic dark matter: A critical assessment of the performance of homology search methods on noncoding RNA.Genome Res.2007,17:117–125.
14. Lindow M, Gorodkin J:Principles and limitations of computational microRNA gene and target finding.DNA Cell Biol.2007,26:339–351. 15. Zuker M:Mfold web server for nucleic acid folding and hybridization
prediction.Nucleic Acids Res.2003,31:3406–3415.
16. Markham NR, Zuker M:DINAMelt web server for nucleic acid melting prediction.Nucleic Acids Res.2005,33:W577–W581.
17. Hofacker IL:Vienna RNA secondary structure server.Nucleic Acids Res. 2003,31:3429–3431.
18. Gorodkin J, Hofacker IL:From Structure Prediction to Genomic Screens for Novel Non-Coding RNAs.PLoS Comput. Biol.2011,7:e1002100.
19. Oulas A, Karathanasis N, Louloupi A, Poirazi P:Finding cancer-associated miRNAs: methods and tools.Mol. Biotechnol.2011,49:97–107. 20. Sarker R, Bandyopadhyay S, Maulik U:An Overview of Computational
Approaches for Prediction of miRNA Genes and their Targets.Curr. Bioinform.2011,6:15.
21. Krzyzanowski PM, Muro EM, Andrade-Navarro MA:Computational approaches to discovering noncoding RNA.Wiley Interdiscip. Rev. RNA 2012,3:567–579.
22. Tan Gana NH, Victoriano AFB, Okamoto T:Evaluation of online miRNA resources for biomedical applications.Genes Cells2012,17:11–27. 23. Zheng Y, Hsu W, Lee ML, Wong L:Exploring essential attributes for
detecting MicroRNA Precursors from background sequences.Lect. Notes Bioinforma.2006,4316:131–145.
24. Van der Burgt A, Fiers MWJE, Nap J-P, van Ham RCHJ:In silico miRNA prediction in metazoan genomes: balancing between sensitivity and specificity.BMC Genomics2009,10:204.
26. Liu X, He S, Skogerbø G, Gong F, Chen R:Integrated sequence-structure motifs suffice to identify microRNA precursors.PLoS One2012,7:e32797. 27. Bentwich I:Identifying human microRNAs.Curr. Top. Microbiol. Immunol.
2008,320:257–269.
28. Lindow M, Jacobsen A, Nygaard S, Mang Y, Krogh A:Intragenomic matching reveals a huge potential for miRNA-mediated regulation in plants.PLoS Comput Biol2007,3:e238.
29. Ritchie W, Gao D, Rasko JEJ:Defining and providing robust controls for microRNA prediction.Bioinformatics2012,28:1058–1061.
30. Bonnet E, Wuyts J, Rouze P, Van de Peer Y:Evidence that microRNA precursors, unlike other non-coding RNAs, have lower folding free energies than random sequences.Bioinformatics2004,20:2911–2917. 31. Freyhult E, Gardner PP, Moulton V:A comparison of RNA folding
measures.BMC Bioinformatics2005,6:241.
32. Ng KLS, Mishra SK:De novo SVM classification of precursor microRNAs from genomic pseudo hairpins using global and intrinsic folding measures.Bioinformatics2007,23:1321–1330.
33. Jiang P, Wu H, Wang W, Ma W, Sun X, Lu Z:MiPred: classification of real and pseudo microRNA precursors using random forest prediction model with combined features.Nucleic Acids Res.2007,35:W339–W344. 34. Rivas E, Eddy SR:Secondary structure alone is generally not statistically
significant for the detection of noncoding RNAs.Bioinformatics2000, 16:583–605.
35. Clote P, Ferre F, Kranakis E, Krizanc D:Structural RNA has lower folding energy than random RNA of the same dinucleotide frequency.RNA2005, 11:578–591.
36. Gomes CPC, Cho J-H, Hood L, Franco OL, Pereira RW, Wang K:A Review of Computational Tools in microRNA Discovery.Front. Genet.2013,4:81. 37. De Jesus O, Smith PR, Spender LC, Karstegl CE, Niller HH, Huang D, Farrell
PJ:Updated Epstein-Barr virus (EBV) DNA sequence and analysis of a promoter for the BART (CST, BARFO) RNAs of EBV.J. Gen. Virol.2003, 84:1443–1450.
38. Condor software website: [http://www.cs.wisc.edu/condor]
39. Thain D, Tannenbaum T, Livny M:Distributed computing in practice: The Condor experience.Conc Comp Pr. Exp2005,17:323–356.
40. UnaFold Package: [http://mfold.rna.albany.edu/?q=DINAMelt/software] 41. R Project: [http://www.r-project.org]
42. Black PE:Fisher-Yates shuffle.National Institute of Standards and Technology: In Dict. Algorithms Data Struct. edited by Black PE U.S; 2005.
43. Thakur V, Wanchana S, Xu M, Bruskiewich R, Quick WP, Mosig A, Zhu X-G: Characterization of statistical features for plant microRNA prediction. BMC Genomics2011,12:108.
44. Arnold G, Hölzl J, Köksal AS, Berkeley UC:Specifying and Verifying Sparse Matrix Codes.Discovery; 2010:1–13.
45. Le SY, Maizel JV:A method for assessing the statistical significance of RNA folding.J. Theor. Biol.1989,138:495–510.
46. Workman C, Krogh A:No evidence that mRNAs have lower folding free energies than random sequences with the same dinucleotide distribution.Nucleic Acids Res.1999,27:4816–4822.
47. Zhao Y, Xu H, Yao Y, Smith LP, Kgosana L, Green J, Petherbridge L, Baigent SJ, Nair V:Critical role of the virus-encoded microRNA-155 ortholog in the induction of Marek’s disease lymphomas.PLoS Pathog.2011, 7:e1001305.
48. Integrated Genome Browser: [http://bioviz.org/igb/]
49. Niu QW, Lin SS, Reyes JL, Chen KC, Wu HW, Yeh SD, Chua NH:Expression of artificial microRNAs in transgenic Arabidopsis thaliana confers virus resistance.Nat. Biotechnol.2006,24:1420–1428.
50. Bonnet E, Van De Peer Y, Rouze P:The small RNA world of plants.New Phytol.2006,171:451–468.
51. Ng KLS, Mishra SK:Unique folding of precursor microRNAs: quantitative evidence and implications for de novo identification.RNA2007, 13:170–187.
52. Parisien M, Major F:The MC-Fold and MC-Sym pipeline infers RNA structure from sequence data.Nature2008,452:51–55.
doi:10.1186/1756-0500-7-34
Cite this article as:Warriset al.:Fast selection of miRNA candidates
based on large-scale pre-computed MFE sets of randomized sequences.
BMC Research Notes20147:34.
Submit your next manuscript to BioMed Central and take full advantage of:
• Convenient online submission
• Thorough peer review
• No space constraints or color figure charges
• Immediate publication on acceptance
• Inclusion in PubMed, CAS, Scopus and Google Scholar
• Research which is freely available for redistribution

![Figure 3 Relative performance of MFE-based P-valueestimations. The percentage of pre-miRNAs with a P-value smallerthan indicated is plotted for data previously published [30], newlycomputed values from release 9.2 of MirBase based on the samemethod and com](https://thumb-us.123doks.com/thumbv2/123dok_us/8289961.285958/6.595.56.540.639.715/performance-valueestimations-percentage-smallerthan-indicated-previously-newlycomputed-samemethod.webp)