Open Access
Vol 11 No 1
Research article
Gene expression profiling of the tumor microenvironment during
breast cancer progression
Xiao-Jun Ma
1, Sonika Dahiya
2, Elizabeth Richardson
2, Mark Erlander
1and Dennis C Sgroi
21bioTheranostics, Inc., 11025 Roselle Street, Suite 200, San Diego, CA 92121, USA
2Molecular Pathology Unit and Center for Cancer Research, Massachusetts General Hospital, 149 13th Street, Charlestown, MA 02129, USA
Corresponding author: Dennis C Sgroi, [email protected]
Received: 3 Jun 2008 Revisions requested: 14 Jul 2008 Revisions received: 16 Jan 2009 Accepted: 2 Feb 2009 Published: 2 Feb 2009
Breast Cancer Research 2009, 11:R7 (doi:10.1186/bcr2222)
This article is online at: http://breast-cancer-research.com/content/11/1/R7 © 2009 Ma et al.; licensee BioMed Central Ltd.
This is an open access article distributed under the terms of the Creative Commons Attribution License (http://creativecommons.org/licenses/by/2.0), which permits unrestricted use, distribution, and reproduction in any medium, provided the original work is properly cited.
Abstract
Introduction The importance of the tumor microenvironment in breast cancer has been increasingly recognized. Critical molecular changes in the tumor stroma accompanying cancer progression, however, remain largely unknown. We conducted a comparative analysis of global gene expression changes in the stromal and epithelial compartments during breast cancer progression from normal to preinvasive to invasive ductal carcinoma.
Methods We combined laser capture microdissection and gene expression microarrays to analyze 14 patient-matched normal epithelium, normal stroma, tumor epithelium and tumor-associated stroma specimens. Differential gene expression and gene ontology analyses were performed.
Results Tumor-associated stroma undergoes extensive gene expression changes during cancer progression, to a similar extent as that seen in the malignant epithelium. Highly upregulated genes in the tumor-associated stroma include
constituents of the extracellular matrix and matrix metalloproteases, and cell-cycle-related genes. Decreased expression of cytoplasmic ribosomal proteins and increased expression of mitochondrial ribosomal proteins were observed in both the tumor epithelium and the stroma. The transition from preinvasive to invasive growth was accompanied by increased expression of several matrix metalloproteases (MMP2, MMP11 and MMP14). Furthermore, as observed in malignant epithelium, a gene expression signature of histological tumor grade also exists in the stroma, with high-grade tumors associated with increased expression of genes involved in immune response.
Conclusions Our results suggest that the tumor microenvironment participates in tumorigenesis even before tumor cells invade into stroma, and that it may play important roles in the transition from preinvasive to invasive growth. The immune cells in the tumor stroma may be exploited by the malignant epithelial cells in high-grade tumors for aggressive invasive growth.
Introduction
The tumor microenvironment or the stroma hosting the malig-nant breast epithelial cells is comprised of multiple cell types, including fibroblasts, myoepithelial cells, endothelial cells and various immune cells [1-4]. One prevailing view is that tumor-associated stroma is activated by the malignant epithelial cells to foster tumor growth – for example, by secreting growth fac-tors, increasing angiogenesis, and facilitating cell migration, ultimately resulting in metastasis to remote organ sites [3]. For example, two chemokines (chemokine (C-X-C motif) ligand (CXCL) 12 and CXCL14) that bind to tumor epithelial cells to promote proliferation, migration and invasion have recently
been shown to be overexpressed by the activated tumor fibroblasts and myoepithelial cells [5-7]. Genes involved in tumor-microenvironment interactions may therefore provide novel targets for diagnostic development and therapeutic intervention. Our understanding of the interactions between epithelial and stromal components of breast cancer, however, remains limited at the molecular level. Using the serial analysis of gene expression technique, Allinen and coworkers per-formed the first systematic profiling of the various stromal cell types isolated via cell-type-specific cell surface markers and magnetic beads [7]. They demonstrated gene expression alterations in all cell types within the tumor microenvironment
accompanying progression from normal breast tissue to ductal carcinoma in situ (DCIS) to invasive ducal carcinoma (IDC) [8], providing evidence that these cell types all participate in tumorigenesis.
Using laser capture microdissection (LCM), we previously per-formed gene expression analysis of the epithelial compartment of the malignant lesions during breast cancer progression. We discovered that most of the gene expression changes take place prior to local invasion (even in atypical ductal hyperpla-sia) and that there are no major changes in gene expression accompanying the in situ to invasive growth transition [9]. In the present article we extend this analysis to the tumor stromal microenvironment and demonstrate that, like the tumor epithe-lium, the tumor stromal microenvironment undergoes extensive gene expression alterations even at the preinvasive stage of DCIS, supporting the view that cell-cell communication via paracrine mechanisms between the two compartments plays an important role in tumor progression.
Materials and methods
Clinical specimen
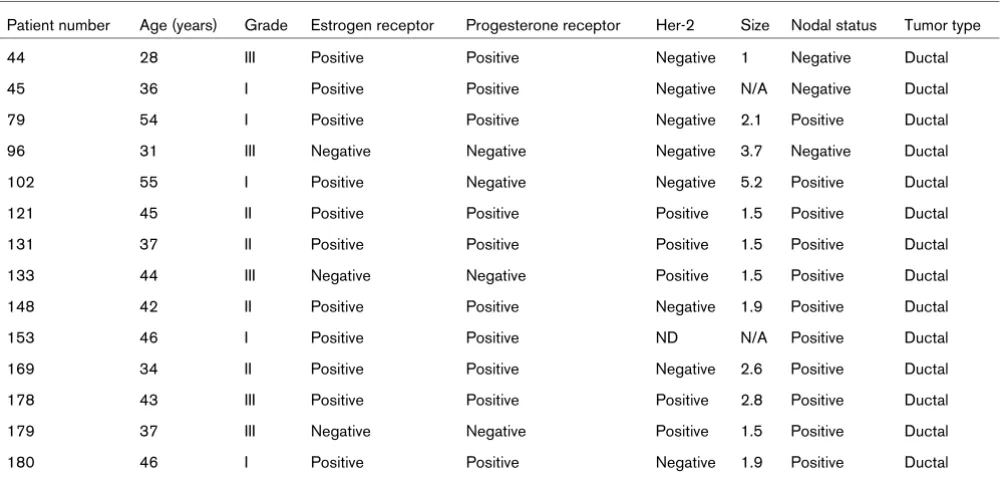
All breast cancer specimens were fresh-frozen biopsies obtained from the Massachusetts General Hospital between 1998 and 2001. The diagnostic criteria and tumor grading were described previously [9]. Patient and tumor characteris-tics of the 14 tumor specimens in this study are presented in Table 1. Patients were selected in which patient-matched nor-mal and tumor samples were available and the nornor-mal breast lobules did not show fibrocystic change. The research was
deemed exempt from informed consent as the samples are unidentifiable to the research team. The study was approved by the Massachusetts General Hospital human research com-mittee in accordance with National Institutes of Health human research study guidelines.
Laser capture microdissection, RNA extraction and microarray analysis
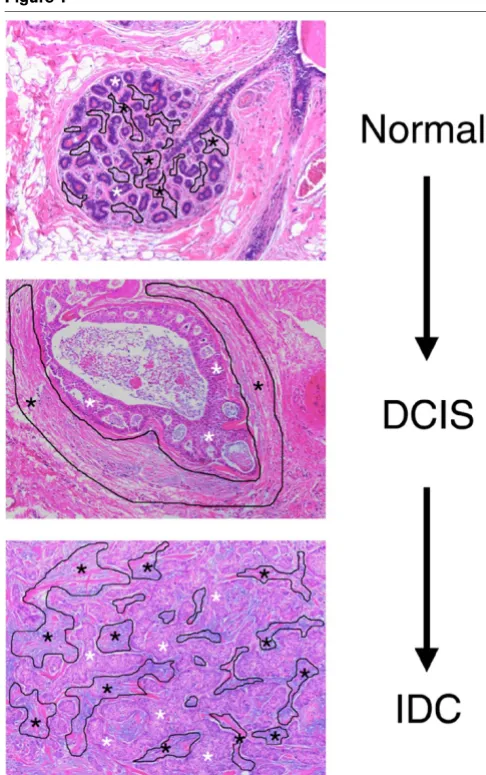
Highly enriched populations of patient-matched normal or malignant epithelial cells and of normal stroma or tumor-asso-ciated stroma from the different stages of breast cancer pro-gression were procured by LCM using a PixCell IIe system (Molecular Devices, Mountain View, CA, USA) as previously described [9]. Enrichment for cells of interest was verified by microscopic examination of the LCM cap after microdissec-tion. The microdissected normal stromal compartment con-sisted of the intralobular, rather than the extralobular, stromal compartment of normal breast tissue that was a minimum 0.3 cm from any premalignant or malignant lesion (Figure 1). The DCIS-associated stroma (DCIS-S) consisted of a 25 μm rim of cells that surrounded the DCIS; for cases in which synchro-nous DCIS and IDC were present, the DCIS-S was obtained from areas of DCIS that were at least 0.3 cm from the invasive component. The IDC-associated stroma (IDC-S) consists of stromal cells predominantly within the invasive tumor mass.
Total RNA was isolated from captured cells using the Picop-ure™ RNA isolation kit (Molecular Devices), amplified by T7 RNA amplification (RiboAmp™; Molecular Devices), labeled and hybridized to the whole genome array U133X3P
(3'-Table 1
Patient and tumor characteristics of samples in the study
Patient number Age (years) Grade Estrogen receptor Progesterone receptor Her-2 Size Nodal status Tumor type
44 28 III Positive Positive Negative 1 Negative Ductal
45 36 I Positive Positive Negative N/A Negative Ductal
79 54 I Positive Positive Negative 2.1 Positive Ductal
96 31 III Negative Negative Negative 3.7 Negative Ductal
102 55 I Positive Negative Negative 5.2 Positive Ductal
121 45 II Positive Positive Positive 1.5 Positive Ductal
131 37 II Positive Positive Positive 1.5 Positive Ductal
133 44 III Negative Negative Positive 1.5 Positive Ductal
148 42 II Positive Positive Negative 1.9 Positive Ductal
153 46 I Positive Positive ND N/A Positive Ductal
169 34 II Positive Positive Negative 2.6 Positive Ductal
178 43 III Positive Positive Positive 2.8 Positive Ductal
179 37 III Negative Negative Positive 1.5 Positive Ductal
180 46 I Positive Positive Negative 1.9 Positive Ductal
[image:2.612.57.559.478.717.2]biased design) according to the manufacturer's instructions (Affymetrix, Santa Clara, CA, USA). The hybridized microar-rays were then washed, stained and scanned as per the man-ufacturer's protocols (Affymetrix).
Data analysis
Raw data from the U133X3P arrays were processed using the Bioconductor rma package with default parameters for back-ground correction, quantile normalization and signal summa-tion [10,11]. Differential gene expression analyses were performed using linear regression models in the limma pack-age [12]. For comparing normal and tumor samples, we used the patient identification as a blocking variable. For tumor grade comparison, we used the tumor stage (in situ or
inva-sive) as the blocking variable. Statistical significance was cor-rected for multiple testing using the Benjamini-Hochberg procedure [13]. All procedures were performed in the R statis-tical environment [14]. For gene ontology analysis, ranked gene lists were first generated according to the moderated t
statistics from linear models and then examined for enriched ontology terms using the Gene Set Enrichment Analysis soft-ware [15]. The data discussed in this publication have been deposited in the NCBI Gene Expression Omnibus [16] and are accessible [GEO:GSE14548] [17].
Quantitative real-time PCR and immunohistochemistry
TaqMan™ real-time PCR was performed on amplified RNA used for microarray analysis as previously described [9]. Briefly, amplified RNA was converted to double-stranded cDNA, and the cDNA was quantitated with PicoGreen (Molec-ular Probes, Eugene, OR, USA) using a spectrofluorometer (Molecular Devices). Each gene was analyzed in triplicate in a 96-well plate using ABI 7900 HT (Applied Biosystems, Foster City, CA., USA).
For each gene, the sequences of the PCR primer pairs and the fluorogenic MGB or TAMRA probe (5' to 3'), respectively, are as follows: ESR1, ATGATCAACTGGGCGAAGA, GGTGGACCT-GATCATGGA and VIC-TGCCAGGCTTTGTGGA; RRM2, CCTTTAACCAGCACAGCCAGTT, TTATTTGTTTGTAAAGT-GCCAGGTTT and VIC-TGCAGCCTCACTGCTTCAACGCA-TAMRA; gremlin 1 (GREM1), ACGGCAAAGAATTATATAGAC-TATGAGGTA, TTTTATGAGACTATCAACTCCCCTTTC and VIC-CTTGCTGTGTAGGAGGA; and WNT inhibitory factor 1(WIF1), CACTGTGGTAGTGGCATTTAAACAATA, GCCAAT-GCAAAAAGTTCATACATT and VIC-TTCTAAACACAAT-GAAATAGGGA.
Estrogen receptor and progesterone receptor immunohisto-chemistry staining was performed as previously described, using the rabbit monoclonal antibody (SP1) from Lab Vision (Fremont, CA, USA) for the estrogen receptor (1:50 dilution) and using the mouse monoclonal antibody (PgR 636) from Dako (Carpinteria, CA, USA) for the progesterone receptor (1:50 dilution) [18].
Results
Experimental design
[image:3.612.54.297.90.478.2]The present study included 14 patients with primary ductal breast cancer (Table 1). These patients were primarily estro-gen receptor positive (78.6%), lymph node positive (78.6%), and premenopausal (mean age 41 years). We used LCM to isolate the epithelial and stroma compartments separately from each of the 14 fresh-frozen biopsies. In the epithelial compartment, we captured normal and malignant epithelium from DCIS and/or IDC. In the stromal compartment, we cap-tured normal stroma at least 3 mm from the malignant lesion and the DCIS-S and/or IDC-S whenever possible. An example of the microdissected compartments is shown in Figure 1. As
Figure 1
Laser capture microdissection experimental design
shown in Table 2, in the epithelial compartment four cases had all three stages (normal breast epithelium, DCIS, and IDC) available, five cases had normal breast epithelium and IDC only, and five cases had normal breast epithelium and DCIS only; in the stroma, six cases had all three stages available, five cases had normal stromal compartment and DCIS-S, and three cases had the normal stromal compartment and IDC-S. RNA was isolated from the captured cells and interrogated with the Affymetrix whole-genome array U133X3P.
Gene expression changes in the stromal and epithelial compartments during breast cancer progression
We compared the gene expression patterns of the tumor epi-thelium and stroma at each stage of progression (DCIS or IDC) with their respective normal state using the limma (linear models of microarrays) software package [12]. The resulting P
values for differential gene expression in each pair-wise com-parison were adjusted for multiple testing [13], and the genes with a significant adjusted P value (P <0.05) were extracted.
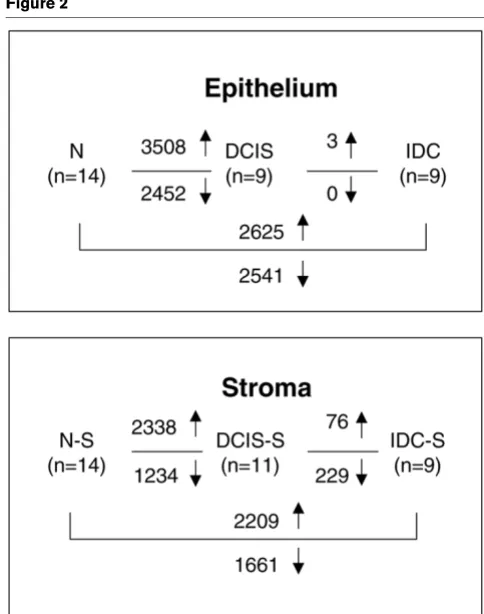
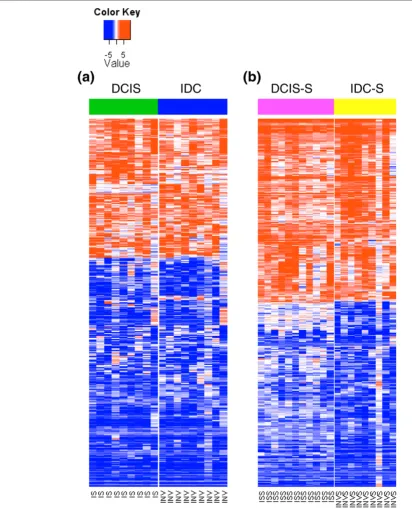
The DCIS and IDC stages were each associated with thou-sands of gene expression alterations relative to their respec-tive normal state in both the tumor epithelium and the stroma (Figure 2). Furthermore, within each compartment, the expres-sion patterns of DCIS-associated and IDC-associated genes were highly similar to each other (Figure 3).
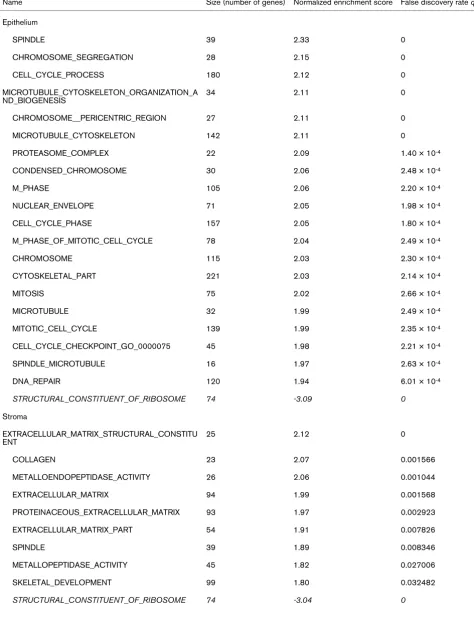
To gain an overview of the biological processes in which these differentially expressed genes are involved, we performed gene set enrichment analysis [19] using the gene ontology database [20]. Table 3 presents the top 20 gene ontology terms significantly enriched within genes upregulated in the invasive stage in the epithelium and the stroma. In the epithe-lium, the genes were dominated by those associated with the cell cycle (mitosis in particular). In the stroma, the genes prom-inently featured the components of the extracellular matrix and the matrix metalloproteases responsible for remodeling the extracellular matrix. Additionally, the stromal genes also included those related to the cell cycle, indicating increased proliferation as a common feature in both the tumor epithelium and the stroma.
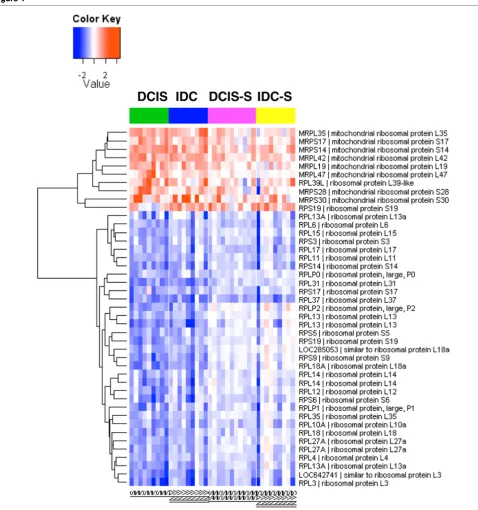
[image:4.612.313.555.87.394.2]In both compartments, the single gene ontology term STRUCTURAL_CONSTITUENT_OF_RIBOSOME was signif-icantly enriched within the downregulated genes (Table 3). To examine this further, we extracted all ribosomal protein-encod-ing genes that were differentially expressed between DCIS or IDC versus the normal breast in the epithelium and visualized
Table 2
Laser capture microdissection of 14 primary breast cancer patients
Tumor Stroma
Patient Normal In situ Invasive Normal In situ Invasive
44 x x x x x x
45 x x x x x
79 x x x x x
96 x x x x x x
102 x x x x x x
121 x x x x x x
131 x x x x
133 x x x x
148 x x x x
153 x x x x
169 x x x x
178 x x x x
179 x x x x
180 x x x x
x, component captured.
Figure 2
Comparative analysis of gene expression changes in tumor and stroma
Figure 3
Heatmap of expression patterns of ductal carcinoma in situ-associated and invasive ductal carcinoma-associated genes
Heatmap of expression patterns of ductal carcinoma in situ-associated and invasive ductal carcinoma-associated genes. (a) Heatmap of 849 genes with >3-fold differential expression in either ductal carcinoma in situ (DCIS) versus normal breast or invasive ductal carcinoma (IDC) versus normal breast in the epithelium. (b) Heatmap of 557 genes with >3-fold differential expression in either ductal carcinoma in situ-associated stroma (DCIS-S) versus normal stromal compartment or invasive ductal carcinoma-associated stroma (IDC-(DCIS-S) versus normal stromal compartment. Data shown are log2(fold change) relative to the average expression in normal controls (normal breast epithelium or normal stromal compartment). In each heatmap,
Table 3
Top 20 gene ontology terms enriched in tumor epithelium and stroma
Name Size (number of genes) Normalized enrichment score False discovery rate q value
Epithelium
SPINDLE 39 2.33 0
CHROMOSOME_SEGREGATION 28 2.15 0
CELL_CYCLE_PROCESS 180 2.12 0
MICROTUBULE_CYTOSKELETON_ORGANIZATION_A ND_BIOGENESIS
34 2.11 0
CHROMOSOME__PERICENTRIC_REGION 27 2.11 0
MICROTUBULE_CYTOSKELETON 142 2.11 0
PROTEASOME_COMPLEX 22 2.09 1.40 × 10⁻⁴
CONDENSED_CHROMOSOME 30 2.06 2.48 × 10⁻⁴
M_PHASE 105 2.06 2.20 × 10⁻⁴
NUCLEAR_ENVELOPE 71 2.05 1.98 × 10⁻⁴
CELL_CYCLE_PHASE 157 2.05 1.80 × 10⁻⁴
M_PHASE_OF_MITOTIC_CELL_CYCLE 78 2.04 2.49 × 10⁻⁴
CHROMOSOME 115 2.03 2.30 × 10⁻⁴
CYTOSKELETAL_PART 221 2.03 2.14 × 10⁻⁴
MITOSIS 75 2.02 2.66 × 10⁻⁴
MICROTUBULE 32 1.99 2.49 × 10⁻⁴
MITOTIC_CELL_CYCLE 139 1.99 2.35 × 10⁻⁴
CELL_CYCLE_CHECKPOINT_GO_0000075 45 1.98 2.21 × 10⁻⁴
SPINDLE_MICROTUBULE 16 1.97 2.63 × 10⁻⁴
DNA_REPAIR 120 1.94 6.01 × 10⁻⁴
STRUCTURAL_CONSTITUENT_OF_RIBOSOME 74 -3.09 0
Stroma
EXTRACELLULAR_MATRIX_STRUCTURAL_CONSTITU ENT
25 2.12 0
COLLAGEN 23 2.07 0.001566
METALLOENDOPEPTIDASE_ACTIVITY 26 2.06 0.001044
EXTRACELLULAR_MATRIX 94 1.99 0.001568
PROTEINACEOUS_EXTRACELLULAR_MATRIX 93 1.97 0.002923
EXTRACELLULAR_MATRIX_PART 54 1.91 0.007826
SPINDLE 39 1.89 0.008346
METALLOPEPTIDASE_ACTIVITY 45 1.82 0.027006
SKELETAL_DEVELOPMENT 99 1.80 0.032482
Figure 4
Heatmap of differential expression of ribosomal protein genes in the malignant epithelium and tumor stroma
Heatmap of differential expression of ribosomal protein genes in the malignant epithelium and tumor stroma. Differential expression of ribosomal pro-tein genes in ductal carcinoma in situ (DCIS), invasive ductal carcinoma (IDC), ductal carcinoma in situ-associated stroma (DCIS-S) and invasive ductal carcinoma-associated stroma (IDC-S). Data shown are log2(fold change) relative to the average expression level in the normal controls
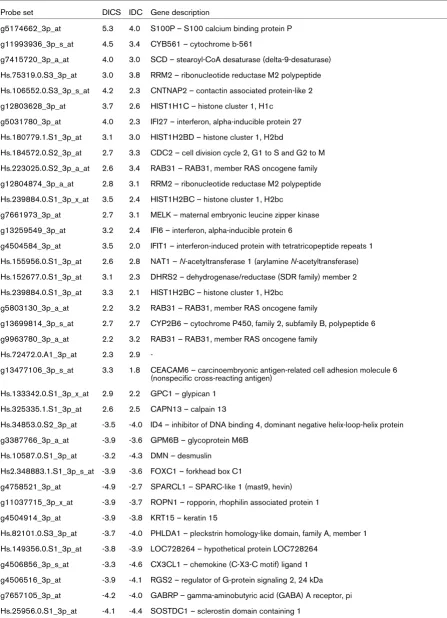
Table 4
Top 50 genes differentially expressed in tumor epithelium
Probe set DICS IDC Gene description
g5174662_3p_at 5.3 4.0 S100P – S100 calcium binding protein P
g11993936_3p_s_at 4.5 3.4 CYB561 – cytochrome b-561
g7415720_3p_a_at 4.0 3.0 SCD – stearoyl-CoA desaturase (delta-9-desaturase)
Hs.75319.0.S3_3p_at 3.0 3.8 RRM2 – ribonucleotide reductase M2 polypeptide
Hs.106552.0.S3_3p_s_at 4.2 2.3 CNTNAP2 – contactin associated protein-like 2
g12803628_3p_at 3.7 2.6 HIST1H1C – histone cluster 1, H1c
g5031780_3p_at 4.0 2.3 IFI27 – interferon, alpha-inducible protein 27
Hs.180779.1.S1_3p_at 3.1 3.0 HIST1H2BD – histone cluster 1, H2bd
Hs.184572.0.S2_3p_at 2.7 3.3 CDC2 – cell division cycle 2, G1 to S and G2 to M
Hs.223025.0.S2_3p_a_at 2.6 3.4 RAB31 – RAB31, member RAS oncogene family
g12804874_3p_a_at 2.8 3.1 RRM2 – ribonucleotide reductase M2 polypeptide
Hs.239884.0.S1_3p_x_at 3.5 2.4 HIST1H2BC – histone cluster 1, H2bc
g7661973_3p_at 2.7 3.1 MELK – maternal embryonic leucine zipper kinase
g13259549_3p_at 3.2 2.4 IFI6 – interferon, alpha-inducible protein 6
g4504584_3p_at 3.5 2.0 IFIT1 – interferon-induced protein with tetratricopeptide repeats 1
Hs.155956.0.S1_3p_at 2.6 2.8 NAT1 – N-acetyltransferase 1 (arylamine N-acetyltransferase) Hs.152677.0.S1_3p_at 3.1 2.3 DHRS2 – dehydrogenase/reductase (SDR family) member 2
Hs.239884.0.S1_3p_at 3.3 2.1 HIST1H2BC – histone cluster 1, H2bc
g5803130_3p_a_at 2.2 3.2 RAB31 – RAB31, member RAS oncogene family
g13699814_3p_s_at 2.7 2.7 CYP2B6 – cytochrome P450, family 2, subfamily B, polypeptide 6
g9963780_3p_a_at 2.2 3.2 RAB31 – RAB31, member RAS oncogene family
Hs.72472.0.A1_3p_at 2.3 2.9
-g13477106_3p_s_at 3.3 1.8 CEACAM6 – carcinoembryonic antigen-related cell adhesion molecule 6 (nonspecific cross-reacting antigen)
Hs.133342.0.S1_3p_x_at 2.9 2.2 GPC1 – glypican 1
Hs.325335.1.S1_3p_at 2.6 2.5 CAPN13 – calpain 13
Hs.34853.0.S2_3p_at -3.5 -4.0 ID4 – inhibitor of DNA binding 4, dominant negative helix-loop-helix protein
g3387766_3p_a_at -3.9 -3.6 GPM6B – glycoprotein M6B
Hs.10587.0.S1_3p_at -3.2 -4.3 DMN – desmuslin
Hs2.348883.1.S1_3p_s_at -3.9 -3.6 FOXC1 – forkhead box C1
g4758521_3p_at -4.9 -2.7 SPARCL1 – SPARC-like 1 (mast9, hevin)
g11037715_3p_x_at -3.9 -3.7 ROPN1 – ropporin, rhophilin associated protein 1
g4504914_3p_at -3.9 -3.8 KRT15 – keratin 15
Hs.82101.0.S3_3p_at -3.7 -4.0 PHLDA1 – pleckstrin homology-like domain, family A, member 1
Hs.149356.0.S1_3p_at -3.8 -3.9 LOC728264 – hypothetical protein LOC728264
g4506856_3p_s_at -3.3 -4.6 CX3CL1 – chemokine (C-X3-C motif) ligand 1
g4506516_3p_at -3.9 -4.1 RGS2 – regulator of G-protein signaling 2, 24 kDa
g7657105_3p_at -4.2 -4.0 GABRP – gamma-aminobutyric acid (GABA) A receptor, pi
their expression patterns in both compartments. Interestingly, there was an almost complete bipartite partitioning of these genes (Figure 4): while the downregulated genes were all those encoding for the cytoplasmic ribosomal proteins, the upregulated genes were mostly those encoding for the mito-chondrial ribosomal proteins.
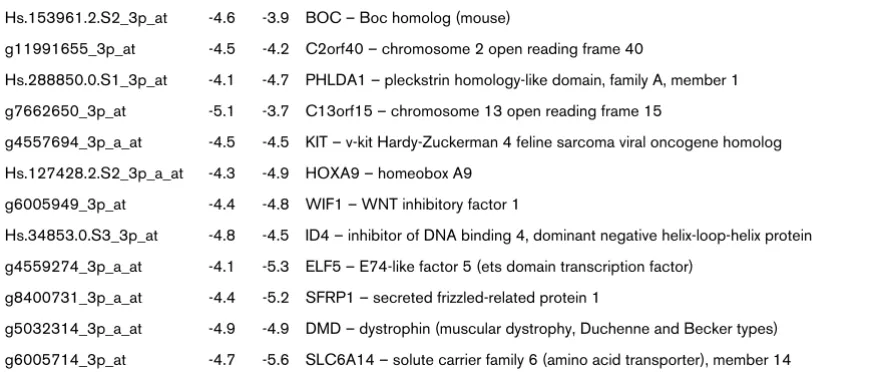
In addition to these global patterns, Tables 4 and 5 present the top 50 differentially expressed genes in the epithelium and the stroma, respectively. In these tables, besides the dominant features of cell-cycle-related genes in the epithelium and extra-cellular matrix genes in the stroma discussed earlier, we note several additional genes important in cell signaling pathways. Two antagonists of WNT receptor signaling, WIF1 and secreted frizzled-related protein 1 (SFRP1), were downregu-lated in both the tumor epithelium and the stroma. In addition, two members of the transforming growth factor beta super-family, GREM1 and inhibin beta A (INHBA), showed markedly increased expression specifically in the tumor stroma (Table 5).
Stromal gene expression signature associated with tumor invasion
We next compared the gene expression patterns associated with the DCIS to IDC transition within each compartment. In the tumor epithelium, there were only three genes (POSTN, periostin; SPARC, osteoconectin; SPARCL1, SPARC-like 1) that were significantly upregulated in IDC relative to DCIS. All three genes are known to be specifically expressed in the stroma [21-23] and were indeed strongly expressed in the stroma samples in our dataset. Their apparent overexpression in IDC relative to DCIS might therefore be due to contaminat-ing stromal cells in the procured epithelial cell populations in the IDC samples but not in DCIS samples. In the stroma, how-ever, there were more significant changes in comparing
IDC-S with DCIIDC-S-IDC-S, with 76 upregulated genes and 229 downreg-ulated genes (Figure 2). The lack of significant changes in gene expression in the epithelium associated with the DCIS-IDC transition seen here was consistent with that in our previ-ous study [9].
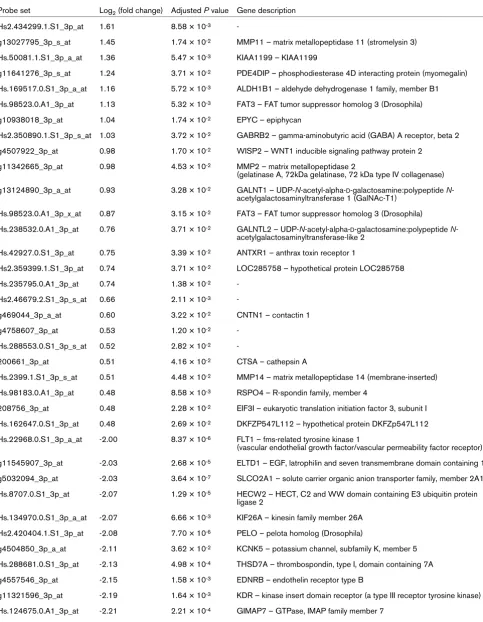
Table 6 presents the top 50 differentially expressed genes between DICS-S and IDC-S (see Additional data file 1). Among genes with increased expression in IDC-S, three matrix metalloproteases (MMP11, MMP2 and MMP14) were nota-ble. In fact, one additional matrix metalloprotease (MMP13) had higher expression in IDC-S than in DCIS-S, with adjusted
P = 0.06. These genes have been known to be involved in tumor invasion [3]. On the other hand, genes with decreased expression in IDC-S included many genes involved in vascula-ture development (for example, EMCN, FLT1, KDR, SELE, MYH11, EDNRB and PODXL), a process expected to increase in invasive cancer. This paradoxical result might reflect the decreased vascular density in the leading invasive front where we microdissected the stroma relative to the stroma surrounding DCIS.
Stromal gene expression signature associated with tumor grade
We have previously shown that tumor grade is associated with a strong gene expression signature in malignant breast epithe-lial cells [9]. We therefore examined whether a similar signa-ture also exists in the tumor stroma. Comparing grade I (n = 8) and grade III (n = 7) tumor-associated stroma samples (DCIS-S and IDC-(DCIS-S), we identified 526 upregulated genes and 94 downregulated genes in grade III samples (Figure 5; see also Additional data file 2). The gene set enrichment analysis indi-cated that the tumor stroma in grade III tumors were associ-ated with a strong immune response signature (interferon
Hs.153961.2.S2_3p_at -4.6 -3.9 BOC – Boc homolog (mouse)
g11991655_3p_at -4.5 -4.2 C2orf40 – chromosome 2 open reading frame 40
Hs.288850.0.S1_3p_at -4.1 -4.7 PHLDA1 – pleckstrin homology-like domain, family A, member 1
g7662650_3p_at -5.1 -3.7 C13orf15 – chromosome 13 open reading frame 15
g4557694_3p_a_at -4.5 -4.5 KIT – v-kit Hardy-Zuckerman 4 feline sarcoma viral oncogene homolog
Hs.127428.2.S2_3p_a_at -4.3 -4.9 HOXA9 – homeobox A9
g6005949_3p_at -4.4 -4.8 WIF1 – WNT inhibitory factor 1
Hs.34853.0.S3_3p_at -4.8 -4.5 ID4 – inhibitor of DNA binding 4, dominant negative helix-loop-helix protein
g4559274_3p_a_at -4.1 -5.3 ELF5 – E74-like factor 5 (ets domain transcription factor)
g8400731_3p_a_at -4.4 -5.2 SFRP1 – secreted frizzled-related protein 1
g5032314_3p_a_at -4.9 -4.9 DMD – dystrophin (muscular dystrophy, Duchenne and Becker types)
g6005714_3p_at -4.7 -5.6 SLC6A14 – solute carrier family 6 (amino acid transporter), member 14
[image:9.612.58.496.109.295.2]Ductal carcinoma in situ (DCIS) and invasive ductal carcinoma (IDC) data presented as log2(fold changes) relative to normal epithelium. Table 4 (Continued)
Table 5
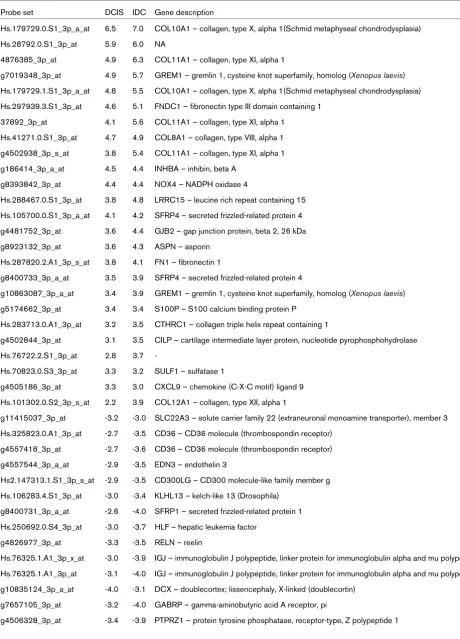
Top 50 genes differentially expressed in tumor-associated stroma
Probe set DCIS IDC Gene description
Hs.179729.0.S1_3p_a_at 6.5 7.0 COL10A1 – collagen, type X, alpha 1(Schmid metaphyseal chondrodysplasia)
Hs.28792.0.S1_3p_at 5.9 6.0 NA
4876385_3p_at 4.9 6.3 COL11A1 – collagen, type XI, alpha 1
g7019348_3p_at 4.9 5.7 GREM1 – gremlin 1, cysteine knot superfamily, homolog (Xenopus laevis) Hs.179729.1.S1_3p_a_at 4.8 5.5 COL10A1 – collagen, type X, alpha 1(Schmid metaphyseal chondrodysplasia)
Hs.297939.3.S1_3p_at 4.6 5.1 FNDC1 – fibronectin type III domain containing 1
37892_3p_at 4.1 5.6 COL11A1 – collagen, type XI, alpha 1
Hs.41271.0.S1_3p_at 4.7 4.9 COL8A1 – collagen, type VIII, alpha 1
g4502938_3p_s_at 3.8 5.4 COL11A1 – collagen, type XI, alpha 1
g186414_3p_a_at 4.5 4.4 INHBA – inhibin, beta A
g8393842_3p_at 4.4 4.4 NOX4 – NADPH oxidase 4
Hs.288467.0.S1_3p_at 3.8 4.8 LRRC15 – leucine rich repeat containing 15
Hs.105700.0.S1_3p_a_at 4.1 4.2 SFRP4 – secreted frizzled-related protein 4
g4481752_3p_at 3.6 4.4 GJB2 – gap junction protein, beta 2, 26 kDa
g8923132_3p_at 3.6 4.3 ASPN – asporin
Hs.287820.2.A1_3p_s_at 3.8 4.1 FN1 – fibronectin 1
g8400733_3p_a_at 3.5 3.9 SFRP4 – secreted frizzled-related protein 4
g10863087_3p_a_at 3.4 3.9 GREM1 – gremlin 1, cysteine knot superfamily, homolog (Xenopus laevis) g5174662_3p_at 3.4 3.4 S100P – S100 calcium binding protein P
Hs.283713.0.A1_3p_at 3.2 3.5 CTHRC1 – collagen triple helix repeat containing 1
g4502844_3p_at 3.1 3.5 CILP – cartilage intermediate layer protein, nucleotide pyrophosphohydrolase
Hs.76722.2.S1_3p_at 2.8 3.7
-Hs.70823.0.S3_3p_at 3.3 3.2 SULF1 – sulfatase 1
g4505186_3p_at 3.3 3.0 CXCL9 – chemokine (C-X-C motif) ligand 9
Hs.101302.0.S2_3p_s_at 2.2 3.9 COL12A1 – collagen, type XII, alpha 1
g11415037_3p_at -3.2 -3.0 SLC22A3 – solute carrier family 22 (extraneuronal monoamine transporter), member 3
Hs.325823.0.A1_3p_at -2.7 -3.5 CD36 – CD36 molecule (thrombospondin receptor)
g4557418_3p_at -2.7 -3.6 CD36 – CD36 molecule (thrombospondin receptor)
g4557544_3p_a_at -2.9 -3.5 EDN3 – endothelin 3
Hs2.147313.1.S1_3p_s_at -2.9 -3.5 CD300LG – CD300 molecule-like family member g
Hs.106283.4.S1_3p_at -3.0 -3.4 KLHL13 – kelch-like 13 (Drosophila)
g8400731_3p_a_at -2.6 -4.0 SFRP1 – secreted frizzled-related protein 1
Hs.250692.0.S4_3p_at -3.0 -3.7 HLF – hepatic leukemia factor
g4826977_3p_at -3.3 -3.5 RELN – reelin
Hs.76325.1.A1_3p_x_at -3.0 -3.9 IGJ – immunoglobulin J polypeptide, linker protein for immunoglobulin alpha and mu polypeptides
Hs.76325.1.A1_3p_at -3.1 -4.0 IGJ – immunoglobulin J polypeptide, linker protein for immunoglobulin alpha and mu polypeptides
g10835124_3p_a_at -4.0 -3.1 DCX – doublecortex; lissencephaly, X-linked (doublecortin)
g7657105_3p_at -3.2 -4.0 GABRP – gamma-aminobutyric acid A receptor, pi
signaling, activation of leukocytes and T cells) and with increased mitotic activity (Table 7).
Validation of selected differentially expressed genes
We next used quantitative real-time PCR to validate selected genes differentially expressed in the various comparisons pre-sented above. Quantitative real-time PCR analysis of the same samples as used in the microarray analysis confirmed the marked downregulation of WIF1 in both neoplastic epithelium and tumor stroma (Figure 6a) and the marked upregulation of GREM1 in both DCIS-associated and IDC-associated stroma (Figure 6b). In addition, two representative genes (ESR1, estrogen receptor alpha; and RRM2, ribonucleotide reductase M2 subunit) differentially expressed in the stroma between grade III and grade I tumors (see Additional data file 2) were also confirmed by quantitative real-time PCR. In both the epi-thelium and stroma, RRM2, a cell proliferation marker, was more highly expressed in grade III tumors (Figure 6c), whereas ESR1 was more highly expressed in grade I tumors (Figure 6d). Although expression of estrogen receptor alpha is thought to be restricted to the tumor epithelial cells in human breast cancer [24], we confirmed the low but detectable levels of estrogen receptor alpha expression in stromal fibroblasts by immunohistochemical staining (Figure 6e).
Discussion
Exploratory genome-wide analysis of the tumor microenviron-ment in breast cancer has been limited to date. Using serial analysis of gene expression coupled with antibody-based ex vivo tissue fractionation, Allinen and colleagues identified a limited set of 417 cell-type-specific genes among the most prominent cell types in breast cancer (epithelial, myoepithelial, and endothelial cells, fibroblasts, and leukocytes) [7]. Finak and colleagues more recently obtained gene expression pro-files of both epithelial and stromal compartments from the same tumor biopsy via LCM [25]. These workers only analyzed
the morphologically normal epithelium and normal stroma, however, leaving the gene expression changes in the tumor-activated stroma unexplored. Our work therefore provides the first comprehensive comparative analysis of in vivo gene expression changes in the tumor epithelium and its stromal microenvironment during breast cancer progression from nor-mal to DCIS to IDC.
We observed extensive gene expression changes in the stroma associated with DCIS and IDC, suggesting that tumor-adjacent stroma coevolves with the tumor epithelium, even before tumor invasion occurs. These alterations included many components of the extracellular matrix and the extracellular-matrix-remodeling matrix metalloproteases. Increased mitotic gene expression occurred both in the malignant epithelium and adjacent stroma, which may reflect the often observed desmoplastic reaction around the tumor cells. Expression of cytoplasmic ribosomal proteins was generally decreased in both compartments during cancer progression. While this result may seem paradoxical in that increased protein synthe-sis is considered a hallmark of cancer, it is supported by sev-eral different lines of studies. First, decreased expression of many ribosomal proteins has also been observed in colorectal cancer compared with normal mucosal epithelium [26]. Sec-ondly, many ribosomal protein genes have been found to be haploinsufficient tumor suppressors in zebrafish [27]. Thirdly, the oncogenic activity of c-Myc is inhibited by the ribosomal protein L11, and inactivation of the L11 gene by small interfer-ing RNA increases c-Myc-induced transcription and cell prolif-eration [28].
The mechanism by which ribosomal proteins contribute to tumorigenesis is unknown. Decreased expression of ribos-omal proteins in cancer may reflect a qualitative change in ribosomal structure, which may allow differential translation of gene products required for rapid tumor growth. Alternatively, it
g4758377_3p_at -3.9 -3.4 FIGF – c-fos induced growth factor (vascular endothelial growth factor D)
g12707575_3p_at -3.3 -4.1 OXTR – oxytocin receptor
g13518036_3p_a_at -2.5 -4.9 MATN2 – matrilin 2
g4559274_3p_a_at -3.9 -3.6 ELF5 – E74-like factor 5 (ets domain transcription factor)
Hs.10587.0.S1_3p_at -2.5 -5.1 DMN – desmuslin
Hs.49696.0.A1_3p_at -3.7 -4.0 SCARA5 – scavenger receptor class A, member 5 (putative)
g4557578_3p_at -3.4 -4.4 FABP4 – fatty acid binding protein 4, adipocyte
g13186315_3p_a_at -3.5 -4.3 CAPN6 – calpain 6
g11991655_3p_at -3.2 -5.3 C2orf40 – chromosome 2 open reading frame 40
g562105_3p_a_at -4.9 -4.5 DLK1 – delta-like 1 homolog (Drosophila)
g6005949_3p_at -5.0 -4.8 WIF1 – WNT inhibitory factor 1
Ductal carcinoma in situ (DCIS) and invasive ductal carcinoma (IDC) data presented as log2(fold changes) relative to normal stroma. Table 5 (Continued)
Table 6
Top 50 genes differentially expressed in invasive stroma compared to in situ stroma Probe set Log2 (fold change) Adjusted P value Gene description Hs2.434299.1.S1_3p_at 1.61 8.58 × 10⁻³
-g13027795_3p_s_at 1.45 1.74 × 10⁻² MMP11 – matrix metallopeptidase 11 (stromelysin 3)
Hs.50081.1.S1_3p_a_at 1.36 5.47 × 10⁻³ KIAA1199 – KIAA1199
g11641276_3p_s_at 1.24 3.71 × 10⁻² PDE4DIP – phosphodiesterase 4D interacting protein (myomegalin)
Hs.169517.0.S1_3p_a_at 1.16 5.72 × 10⁻³ ALDH1B1 – aldehyde dehydrogenase 1 family, member B1
Hs.98523.0.A1_3p_at 1.13 5.32 × 10⁻³ FAT3 – FAT tumor suppressor homolog 3 (Drosophila)
g10938018_3p_at 1.04 1.74 × 10⁻² EPYC – epiphycan
Hs2.350890.1.S1_3p_s_at 1.03 3.72 × 10⁻² GABRB2 – gamma-aminobutyric acid (GABA) A receptor, beta 2
g4507922_3p_at 0.98 1.70 × 10⁻² WISP2 – WNT1 inducible signaling pathway protein 2
g11342665_3p_at 0.98 4.53 × 10⁻² MMP2 – matrix metallopeptidase 2
(gelatinase A, 72kDa gelatinase, 72 kDa type IV collagenase)
g13124890_3p_a_at 0.93 3.28 × 10⁻² GALNT1 – UDP-N-acetyl-alpha-D-galactosamine:polypeptide N
-acetylgalactosaminyltransferase 1 (GalNAc-T1)
Hs.98523.0.A1_3p_x_at 0.87 3.15 × 10⁻² FAT3 – FAT tumor suppressor homolog 3 (Drosophila)
Hs.238532.0.A1_3p_at 0.76 3.71 × 10⁻² GALNTL2 – UDP-N-acetyl-alpha-D-galactosamine:polypeptide N
-acetylgalactosaminyltransferase-like 2
Hs.42927.0.S1_3p_at 0.75 3.39 × 10⁻² ANTXR1 – anthrax toxin receptor 1
Hs2.359399.1.S1_3p_at 0.74 3.71 × 10⁻² LOC285758 – hypothetical protein LOC285758
Hs.235795.0.A1_3p_at 0.74 1.38 × 10⁻²
-Hs2.46679.2.S1_3p_s_at 0.66 2.11 × 10⁻³
-g469044_3p_a_at 0.60 3.22 × 10⁻² CNTN1 – contactin 1
g4758607_3p_at 0.53 1.20 × 10⁻²
-Hs.288553.0.S1_3p_s_at 0.52 2.82 × 10⁻²
-200661_3p_at 0.51 4.16 × 10⁻² CTSA – cathepsin A
Hs.2399.1.S1_3p_s_at 0.51 4.48 × 10⁻² MMP14 – matrix metallopeptidase 14 (membrane-inserted)
Hs.98183.0.A1_3p_at 0.48 8.58 × 10⁻³ RSPO4 – R-spondin family, member 4
208756_3p_at 0.48 2.28 × 10⁻² EIF3I – eukaryotic translation initiation factor 3, subunit I
Hs.162647.0.S1_3p_at 0.48 2.69 × 10⁻² DKFZP547L112 – hypothetical protein DKFZp547L112
Hs.22968.0.S1_3p_a_at -2.00 8.37 × 10⁻⁶ FLT1 – fms-related tyrosine kinase 1
(vascular endothelial growth factor/vascular permeability factor receptor)
g11545907_3p_at -2.03 2.68 × 10⁻⁵ ELTD1 – EGF, latrophilin and seven transmembrane domain containing 1
g5032094_3p_at -2.03 3.64 × 10⁻⁷ SLCO2A1 – solute carrier organic anion transporter family, member 2A1
Hs.8707.0.S1_3p_at -2.07 1.29 × 10⁻⁵ HECW2 – HECT, C2 and WW domain containing E3 ubiquitin protein
ligase 2
Hs.134970.0.S1_3p_a_at -2.07 6.66 × 10⁻³ KIF26A – kinesin family member 26A
Hs2.420404.1.S1_3p_at -2.08 7.70 × 10⁻⁶ PELO – pelota homolog (Drosophila)
g4504850_3p_a_at -2.11 3.62 × 10⁻² KCNK5 – potassium channel, subfamily K, member 5
Hs.288681.0.S1_3p_at -2.13 4.98 × 10⁻⁴ THSD7A – thrombospondin, type I, domain containing 7A
g4557546_3p_at -2.15 1.58 × 10⁻³ EDNRB – endothelin receptor type B
g11321596_3p_at -2.19 1.64 × 10⁻³ KDR – kinase insert domain receptor (a type III receptor tyrosine kinase)
may reflect some unknown nonribosomal functions by these proteins. In contrast to the decreased expression of these cytoplasmic ribosomal protein genes, we observed increased expression of a number of mitochondrial ribosomal protein genes in both the tumor epithelium and the stroma. The human mitochondrial ribosomes are responsible for the production of several key proteins in bioenergetics including subunits of the ATP synthase. Given the importance of mitochondria in cancer [29,30], our novel finding suggests that the mitochondrial ribosome may be a potential therapeutic target and thus war-rants further study.
The top differentially expressed genes between tumor-associ-ated stroma and the adjacent normal stroma included several signaling molecules known to be important for tumorigenesis. Two antagonists of WNT receptor signaling, WIF1 and SFRP1, were consistently downregulated both in the tumor epithelium and stroma. The WNT signaling pathway plays an important role in development and tissue homeostasis, and its aberrant activation by loss of expression WIF1 or SFRP1 has been shown to be an important early event in breast cancer progression [31-33]. Two transforming growth factor beta superfamily members (GREM1 and INHBA) are strongly induced in the tumor-associated stroma. GREM1 is a bone morphogenetic protein antagonist, and it is overexpressed in cancer-associated stromal cells in many solid tumors [34]. It has been hypothesized that bone morphogenetic proteins and bone morphogenetic protein antagonists may play opposing roles in the maintenance of a niche of self-renewing stem cells, with bone morphogenetic protein antagonists such as GREM1 blocking cell differentiation [34]. WNT3A was recently demonstrated in human fibroblasts to markedly
increase the expression of GREM2, a close paralog of GREM1 – raising the possibility that the significant downreg-ulation of WNT antagonists (WIF1 and SFRP1) and upregula-tion of GREM1 in the stroma [35] we observed here may be functionally linked.
INHBA is the gene for the beta A subunit of inhibin and activin, which are pleiotropic growth factors regulating the growth and differentiation of many cell types via autocrine and paracrine mechanisms [36]. Although its role in breast cancer remains unclear, circulating levels of INHBA has been shown to be higher in breast cancer patients with bone metastasis [37]. These signaling molecules could serve as key messengers between the tumor and its microenvironment, as shown for CXCL12 and CXCL14, which are overexpressed in tumor-associated myoepithelial cells and myofibroblasts [6,7,38]. We note that in our dataset, however, CXCL12 and CXCL14 were also expressed in normal stroma. This discrepancy could be due to the fact that Allinen and colleagues used purified stromal cell types [7] and we used the whole stroma compart-ment in our study.
A watershed event in breast cancer progression is the invasion of tumor cells into the stromal compartment. The only morpho-logical diagnostic criterion distinguishing DCIS from IDC is the association of DCIS with a complete basement membrane. Understanding the molecular events that drive the DCIS-IDC transition has been of great interest. We have previously shown [9], and confirm in the present study, that the malignant epithelium of DCIS and IDC are very similar without significant differences at the transcriptome level. This conclusion is sup-ported by the recent demonstration that MCFDCIS cells, a cell
Hs.211388.0.S1_3p_at -2.24 5.72 × 10⁻³ RUNDC3B – RUN domain containing 3B
g4885556_3p_at -2.25 2.13 × 10⁻³ PODXL – podocalyxin-like
Hs.26530.0.S2_3p_at -2.30 1.60 × 10⁻³ SDPR – serum deprivation response (phosphatidylserine binding protein)
g13518036_3p_a_at -2.41 7.19 × 10⁻³ MATN2 – matrilin 2
Hs.102415.0.S1_3p_at -2.43 2.67 × 10⁻⁸ EMCN – endomucin
Hs.61935.0.S1_3p_at -2.45 2.68 × 10⁻⁵ PCDH17 – protocadherin 17
g8547214_3p_at -2.46 3.74 × 10⁻⁵ EMCN – endomucin
g4520327_3p_at -2.48 2.67 × 10⁻³ IL33 – interleukin 33
Hs.10587.0.S1_3p_at -2.66 2.29 × 10⁻³ DMN – desmuslin
g3644039_3p_a_at -2.67 1.43 × 10⁻² TP63 – tumor protein p63
Hs.78344.1.S2_3p_a_at -2.87 2.13 × 10⁻³ MYH11 – myosin, heavy chain 11, smooth muscle
g6580814_3p_s_at -2.93 8.90 × 10⁻⁵ INMT – indolethylamine N-methyltransferase
Hs.173560.0.S1_3p_at -2.94 3.58 × 10⁻² ODZ2 – odz, odd Oz/ten-m homolog 2 (Drosophila)
[image:13.612.50.565.106.335.2]g4506870_3p_at -3.23 1.80 × 10⁻³ SELE – selectin E (endothelial adhesion molecule 1)
Table 6 (Continued)
line model for DCIS, make the DCIS-IDC transition spontane-ously without further molecular changes in the malignant epi-thelial cells themselves [39]. Instead, this transition is driven by fibroblasts and blocked by myoepithelial cells.
In the present article we demonstrated that the stromal com-partment is associated with a relatively small number of signif-icant changes accompanying the DCIS-IDC transition. In particular, several matrix metalloproteases (MMP2, MMP11 and MMP14) showed significantly increased expression in IDC-associated stroma. MMP14, a membrane-type matrix metalloprotease, can activate MMP2 protease activity, which degrades type IV collagen, the major structural component of the basement membrane [40,41]. MMP11 has recently been shown to exhibit protease activity towards type VI collagen and to promote tumor progression [42]. MMP11 has been shown to be differentially expressed in IDC relative to DCIS in two other studies. Schuetz and colleagues conducted a study similar to ours, using LCM and microarrays to profile the epi-thelium of patient-matched DCIS and IDC, and found MMP11 to be upregulated in IDC relative to DCIS [43]. Their result
dif-fers from ours, however, in that we observed upregulation of MMP11 in the IDC-associated stroma but not in the epithe-lium. A stromal origin of MMP11 expression had been estab-lished previously [44]. The result by Schuetz and coworkers might be due to contaminating nonepithelial cells in their LCM samples, a possibility acknowledged by these authors [43]. In another study, Hannemann and colleagues identified a gene expression signature including MMP11 to be able to distin-guish IDC from DCIS [45]. Since no microdissection was per-formed in that study, the gene expression profiles they obtained were from mixtures of tumor epithelium and stroma. Nevertheless, our results together with these other studies support the notion that stroma-produced matrix metallopro-teases may be key players driving the DCIS-IDC transition.
Finally, we showed that – like the epithelial compartment [9] – tumor stroma also exhibited a robust gene expression signa-ture correlating with the histological tumor grade. These genes are primarily involved in immune response and cell-cycle pro-gression. The association of an immune response signature with the more aggressive high-grade tumors is seemingly
par-Table 7
Top 20 gene sets enriched in grade III-associated stroma
Name Size (number of genes) Normalized enrichment score False discovery rate q value
CELLULAR_DEFENSE_RESPONSE 52 2.31 0
IMMUNE_RESPONSE 220 2.17 0
IMMUNE_SYSTEM_PROCESS 312 2.16 0
T_CELL_ACTIVATION 42 2.14 0
LEUKOCYTE_ACTIVATION 67 2.09 0
JAK_STAT_CASCADE 28 2.05 6.82 × 10⁻⁴
LYMPHOCYTE_ACTIVATION 59 2.05 5.85 × 10⁻⁴
CELL_ACTIVATION 73 2.04 5.12 × 10⁻⁴
M_PHASE_OF_MITOTIC_CELL_CYCLE 78 2.04 4.55 × 10⁻⁴
RESPONSE_TO_VIRUS 48 2.04 5.12 × 10⁻⁴
SPINDLE 39 2.03 5.60 × 10⁻⁴
MITOSIS 75 2.02 5.99 × 10⁻⁴
INTERLEUKIN_RECEPTOR_ACTIVITY 20 2.01 6.33 × 10⁻⁴
POSITIVE_REGULATION_OF_IMMUNE_RESPONSE 28 2.00 7.35 × 10⁻⁴
REGULATION_OF_IMMUNE_SYSTEM_PROCESS 66 1.99 7.54 × 10⁻⁴
POSITIVE_REGULATION_OF_IMMUNE_SYSTEM_PRO CESS
50 1.99 7.07 × 10⁻⁴
RESPONSE_TO_BIOTIC_STIMULUS 112 1.99 6.65 × 10⁻⁴
REGULATION_OF_I_KAPPAB_KINASE_NF_KAPPAB_ CASCADE
89 1.99 6.85 × 10⁻⁴
MRNA_PROCESSING_GO_0006397 67 1.97 0.001135
[image:14.612.60.550.125.472.2]adoxical. The interactions between tumor cells and the various immune cells are complex, however, ranging from tumor growth-suppressing effects to tumor growth-promoting effects [46-48]. Perhaps the immune response signature associated with high-grade tumors represents the escape phase [48], when the cancer cells become resistant to
[image:15.612.80.505.95.591.2]immune attack and hijack the abundant cytokines and chem-okines made by the immune cells to grow, invade and spread to distant organs.
Figure 5
Heatmap of gene expression signature correlated with tumor grade in the stroma
Figure 6
Validation of selected genes
Conclusions
The present study provides the first comparative analysis of the in situ gene expression profiles of patient-matched normal and neoplastic breast epithelial and stromal compartments of both preinvasive and invasive stages of human breast cancer progression. This study of the breast cancer microenvironment at the transcriptome level and previous studies at the genomic [49,50] and epigenetic [51,52] levels support the view that the tumor microenvironment is an important co-conspirator rather than a passive bystander during tumorigenesis. Molec-ular alterations within the stroma offer novel avenues for ther-apeutic interventions and disease prognosis [53]. This gene expression dataset of carefully procured in situ tumor epithe-lium and stroma should be a timely and valuable addition to the resources for the breast cancer research community.
Competing interests
XJM and ME are employees of BioTheranostics, Inc. ME, X-JM and DCS are named inventors on a patent application relating to the contents of the manuscript.
Authors' contributions
DCS, XJM and ME conceived of the study, participated in its design and coordination, and helped draft the manuscript. DCS and SD performed microdissection and RNA extraction. XJM and ME performed the microarray experiments and micro-array data analysis. ER performed the real-time PCR assays. All authors have read and approved the final manuscript.
Additional files
Acknowledgements
The present study was supported by NIH RO1-1CA112021-01 (to DCS), the Department of Defense grants W81XWH-04-1-0606 and DAMD170310428 (to DCS), Susan G. Komen Breast Cancer Founda-tion grant BCTR0402932 (to DCS), and the Avon FoundaFounda-tion (to DCS). The authors thank Erica Chatfield for technical assistance in microdis-section and RNA extraction, and they thank Sridhar Ramaswamy and E. Schmidt for helpful discussions and reading of the manuscript.
References
1. Bissell MJ, Radisky D: Putting tumours in context. Nat Rev Can-cer 2001, 1:46-54.
2. de Visser KE, Coussens LM: The inflammatory tumor microen-vironment and its impact on cancer development. Contrib Microbiol 2006, 13:118-137.
3. Liotta LA, Kohn EC: The microenvironment of the tumour-host interface. Nature 2001, 411:375-379.
4. Egeblad M, Littlepage LE, Werb Z: The fibroblastic coconspira-tor in cancer progression. Cold Spring Harb Symp Quant Biol
2005, 70:383-388.
5. Muller A, Homey B, Soto H, Ge N, Catron D, Buchanan ME, McClanahan T, Murphy E, Yuan W, Wagner SN, Barrera JL, Mohar A, Verastegui E, Zlotnik A: Involvement of chemokine receptors in breast cancer metastasis. Nature 2001, 410:50-56. 6. Orimo A, Gupta PB, Sgroi DC, Arenzana-Seisdedos F, Delaunay
T, Naeem R, Carey VJ, Richardson AL, Weinberg RA: Stromal fibroblasts present in invasive human breast carcinomas pro-mote tumor growth and angiogenesis through elevated SDF-1/CXCL12 secretion. Cell 2005, 121:335-348.
7. Allinen M, Beroukhim R, Cai L, Brennan C, Lahti-Domenici J, Huang H, Porter D, Hu M, Chin L, Richardson A, Schnitt S, Sellers WR, Polyak K: Molecular characterization of the tumor micro-environment in breast cancer. Cancer Cell 2004, 6:17-32. 8. Allred DC, Mohsin SK, Fuqua SA: Histological and biological
evolution of human premalignant breast disease. Endocr Relat Cancer 2001, 8:47-61.
9. Ma XJ, Salunga R, Tuggle JT, Gaudet J, Enright E, McQuary P, Pay-ette T, Pistone M, Stecker K, Zhang BM, Zhou YX, Varnholt H, Smith B, Gadd M, Chatfield E, Kessler J, Baer TM, Erlander MG, Sgroi DC: Gene expression profiles of human breast cancer progression. Proc Natl Acad Sci USA 2003, 100:5974-5979. 10. Gentleman RC, Carey VJ, Bates DM, Bolstad B, Dettling M, Dudoit
S, Ellis B, Gautier L, Ge Y, Gentry J, Hornik K, Hothorn T, Huber W, Iacus S, Irizarry R, Leisch F, Li C, Maechler M, Rossini AJ, Saw-itzki G, Smith C, Smyth G, Tierney L, Yang JY, Zhang J: Biocon-ductor: open software development for computational biology and bioinformatics. Genome Biol 2004, 5:R80.
11. Bolstad BM, Irizarry RA, Astrand M, Speed TP: A comparison of normalization methods for high density oligonucleotide array data based on variance and bias. Bioinformatics 2003, 19:185-193.
12. Wettenhall JM, Smyth GK: limmaGUI: a graphical user interface for linear modeling of microarray data. Bioinformatics 2004, 20:3705-3706.
13. Benjamin RS, Hochberg Y: Controlling the false discovery rate: a practical and powerful approach to multiple testing. J R Stat Soc Ser B 1995, 57:289-300.
14. R Project for Statistical Computing [http://www.r-project.org] 15. Subramanian A, Kuehn H, Gould J, Tamayo P, Mesirov JP:
GSEA-P: a desktop application for Gene Set Enrichment Analysis.
Bioinformatics 2007, 23:3251-3253.
16. Edgar R, Domrachev M, Lash AE: Gene Expression Omnibus: NCBI gene expression and hybridization array data repository.
Nucleic Acids Res 2002, 30:207-210.
17. Gene Expression Omnibus [http://www.ncbi.nlm.nih.gov/geo/ query/acc.cgi?acc=GSE14548]
18. Ma XJ, Wang Z, Ryan PD, Isakoff SJ, Barmettler A, Fuller A, Muir B, Mohapatra G, Salunga R, Tuggle JT, Tran Y, Tran D, Tassin A, Amon P, Wang W, Enright E, Stecker K, Estepa-Sabal E, Smith B, Younger J, Balis U, Michaelson J, Bhan A, Habin K, Baer TM, Brugge J, Haber DA, Erlander MG, Sgroi DC: A two-gene expres-sion ratio predicts clinical outcome in breast cancer patients treated with tamoxifen. Cancer Cell 2004, 5:607-616. 19. Subramanian A, Tamayo P, Mootha VK, Mukherjee S, Ebert BL,
Gillette MA, Paulovich A, Pomeroy SL, Golub TR, Lander ES, Mesirov JP: Gene set enrichment analysis: a knowledge-based approach for interpreting genome-wide expression profiles.
Proc Natl Acad Sci USA 2005, 102:15545-15550.
20. Ashburner M, Ball CA, Blake JA, Botstein D, Butler H, Cherry JM, Davis AP, Dolinski K, Dwight SS, Eppig JT, Harris MA, Hill DP, Issel-Tarver L, Kasarskis A, Lewis S, Matese JC, Richardson JE, Ringwald M, Rubin GM, Sherlock G: Gene ontology: tool for the unification of biology. The Gene Ontology Consortium. Nat Genet 2000, 25:25-29.
The following Additional files are available online:
Additional file 1
An Excel file containing a table that lists the genes differentially expressed between DCIS-S and IDC-S. See http://www.biomedcentral.com/content/ supplementary/bcr2222-S1.xls
Additional file 2
An Excel file containing a table that lists the genes differentially expressed between grade III and grade I samples.
21. Kanno A, Satoh K, Masamune A, Hirota M, Kimura K, Umino J, Hamada S, Satoh A, Egawa S, Motoi F, Unno M, Shimosegawa T: Periostin, secreted from stromal cells, has biphasic effect on cell migration and correlates with the epithelial to mesenchy-mal transition of human pancreatic cancer cells. Int J Cancer
2008, 122:2707-2718.
22. Coutu DL, Wu JH, Monette A, Rivard GE, Blostein MD, Galipeau J: Periostin, a member of a novel family of vitamin K-depend-ent proteins, is expressed by mesenchymal stromal cells. J Biol Chem 2008, 283:17991-18001.
23. Framson PE, Sage EH: SPARC and tumor growth: where the seed meets the soil? J Cell Biochem 2004, 92:679-690. 24. Jensen EV, Cheng G, Palmieri C, Saji S, Makela S, Van Noorden
S, Wahlstrom T, Warner M, Coombes RC, Gustafsson JA: Estro-gen receptors and proliferation markers in primary and recur-rent breast cancer. Proc Natl Acad Sci USA 2001, 98:15197-15202.
25. Finak G, Sadekova S, Pepin F, Hallett M, Meterissian S, Halwani F, Khetani K, Souleimanova M, Zabolotny B, Omeroglu A, Park M: Gene expression signatures of morphologically normal breast tissue identify basal-like tumors. Breast Cancer Res 2006, 8:R58.
26. Kasai H, Nadano D, Hidaka E, Higuchi K, Kawakubo M, Sato TA, Nakayama J: Differential expression of ribosomal proteins in human normal and neoplastic colorectum. J Histochem Cyto-chem 2003, 51:567-574.
27. Amsterdam A, Sadler KC, Lai K, Farrington S, Bronson RT, Lees JA, Hopkins N: Many ribosomal protein genes are cancer genes in zebrafish. PLoS Biol 2004, 2:E139.
28. Dai MS, Arnold H, Sun XX, Sears R, Lu H: Inhibition of c-Myc activity by ribosomal protein L11. EMBO J 2007, 26:3332-3345.
29. Carew JS, Huang P: Mitochondrial defects in cancer. Mol Can-cer 2002, 1:9.
30. Hagland H, Nikolaisen J, Hodneland LI, Gjertsen BT, Bruserud O, Tronstad KJ: Targeting mitochondria in the treatment of human cancer: a coordinated attack against cancer cell energy metabolism and signalling. Expert Opin Ther Targets 2007, 11:1055-1069.
31. Ugolini F, Charafe-Jauffret E, Bardou VJ, Geneix J, Adelaide J, Labat-Moleur F, Penault-Llorca F, Longy M, Jacquemier J, Birn-baum D, Pebusque MJ: WNT pathway and mammary carcino-genesis: loss of expression of candidate tumor suppressor gene SFRP1 in most invasive carcinomas except of the med-ullary type. Oncogene 2001, 20:5810-5817.
32. Wissmann C, Wild PJ, Kaiser S, Roepcke S, Stoehr R, Woenck-haus M, Kristiansen G, Hsieh JC, Hofstaedter F, Hartmann A, Knuechel R, Rosenthal A, Pilarsky C: WIF1, a component of the Wnt pathway, is down-regulated in prostate, breast, lung, and bladder cancer. J Pathol 2003, 201:204-212.
33. Klopocki E, Kristiansen G, Wild PJ, Klaman I, Castanos-Velez E, Singer G, Stohr R, Simon R, Sauter G, Leibiger H, Essers L, Weber B, Hermann K, Rosenthal A, Hartmann A, Dahl E: Loss of SFRP1 is associated with breast cancer progression and poor prognosis in early stage tumors. Int J Oncol 2004, 25:641-649. 34. Sneddon JB, Zhen HH, Montgomery K, Rijn M van de, Tward AD, West R, Gladstone H, Chang HY, Morganroth GS, Oro AE, Brown PO: Bone morphogenetic protein antagonist gremlin 1 is widely expressed by cancer-associated stromal cells and can promote tumor cell proliferation. Proc Natl Acad Sci USA
2006, 103:14842-14847.
35. Klapholz-Brown Z, Walmsley GG, Nusse YM, Nusse R, Brown PO: Transcriptional program induced by Wnt protein in human fibroblasts suggests mechanisms for cell cooperativity in defining tissue microenvironments. PLoS ONE 2007, 2:e945. 36. Reis FM, Luisi S, Carneiro MM, Cobellis L, Federico M, Camargos AF, Petraglia F: Activin, inhibin and the human breast. Mol Cell Endocrinol 2004, 225:77-82.
37. Mylonas I, Jeschke U, Shabani N, Kuhn C, Friese K, Gerber B: Inhibin/activin subunits (inhibin-alpha, -betaA and -betaB) are differentially expressed in human breast cancer and their metastasis. Oncol Rep 2005, 13:81-88.
38. Burger JA, Kipps TJ: CXCR4: a key receptor in the crosstalk between tumor cells and their microenvironment. Blood 2006, 107:1761-1767.
39. Hu M, Yao J, Carroll DK, Weremowicz S, Chen H, Carrasco D, Richardson A, Violette S, Nikolskaya T, Nikolsky Y, Bauerlein EL,
Hahn WC, Gelman RS, Allred C, Bissell MJ, Schnitt S, Polyak K: Regulation of in situ to invasive breast carcinoma transition.
Cancer Cell 2008, 13:394-406.
40. Rozanov DV, Savinov AY, Williams R, Liu K, Golubkov VS, Krajew-ski S, Strongin AY: Molecular signature of MT1-MMP: transacti-vation of the downstream universal gene network in cancer.
Cancer Res 2008, 68:4086-4096.
41. Egeblad M, Werb Z: New functions for the matrix metallopro-teinases in cancer progression. Nat Rev Cancer 2002, 2:161-174.
42. Motrescu ER, Blaise S, Etique N, Messaddeq N, Chenard MP, Stoll I, Tomasetto C, Rio MC: Matrix metalloproteinase-11/ stromelysin-3 exhibits collagenolytic function against collagen VI under normal and malignant conditions. Oncogene 2008, 27:6347-55.
43. Schuetz CS, Bonin M, Clare SE, Nieselt K, Sotlar K, Walter M, Fehm T, Solomayer E, Riess O, Wallwiener D, Kurek R, Neubauer HJ: Progression-specific genes identified by expression profil-ing of matched ductal carcinomas in situ and invasive breast tumors, combining laser capture microdissection and oligonu-cleotide microarray analysis. Cancer Res 2006, 66:5278-5286. 44. Basset P, Bellocq JP, Wolf C, Stoll I, Hutin P, Limacher JM, Pod-hajcer OL, Chenard MP, Rio MC, Chambon P: A novel metallo-proteinase gene specifically expressed in stromal cells of breast carcinomas. Nature 1990, 348:699-704.
45. Hannemann J, Velds A, Halfwerk JB, Kreike B, Peterse JL, Vijver MJ van de: Classification of ductal carcinoma in situ by gene expression profiling. Breast Cancer Res 2006, 8:R61. 46. de Visser KE, Eichten A, Coussens LM: Paradoxical roles of the
immune system during cancer development. Nat Rev Cancer
2006, 6:24-37.
47. Clement JF, Meloche S, Servant MJ: The IKK-related kinases: from innate immunity to oncogenesis. Cell Res 2008, 18:889-899.
48. Strausberg RL: Tumor microenvironments, the immune system and cancer survival. Genome Biol 2005, 6:211.
49. Fukino K, Shen L, Matsumoto S, Morrison CD, Mutter GL, Eng C: Combined total genome loss of heterozygosity scan of breast cancer stroma and epithelium reveals multiplicity of stromal targets. Cancer Res 2004, 64:7231-7236.
50. Patocs A, Zhang L, Xu Y, Weber F, Caldes T, Mutter GL, Platzer P, Eng C: Breast-cancer stromal cells with TP53 mutations and nodal metastases. N Engl J Med 2007, 357:2543-2551. 51. Fiegl H, Millinger S, Goebel G, Muller-Holzner E, Marth C, Laird
PW, Widschwendter M: Breast cancer DNA methylation pro-files in cancer cells and tumor stroma: association with HER-2/neu status in primary breast cancer. Cancer Res 2006, 66:29-33.
52. Hu M, Yao J, Cai L, Bachman KE, Brule F van den, Velculescu V, Polyak K: Distinct epigenetic changes in the stromal cells of breast cancers. Nat Genet 2005, 37:899-905.