T E C H N I C A L N O T E
Open Access
Analysis of quality raw data of second generation
sequencers with Quality Assessment Software
Rommel TJ Ramos
1, Adriana R Carneiro
1, Jan Baumbach
3, Vasco Azevedo
2, Maria PC Schneider
1and Artur Silva
1*Abstract
Background:Second generation technologies have advantages over Sanger; however, they have resulted in new challenges for the genome construction process, especially because of the small size of the reads, despite the high degree of coverage. Independent of the program chosen for the construction process, DNA sequences are
superimposed, based on identity, to extend the reads, generating contigs; mismatches indicate a lack of homology and are not included. This process improves our confidence in the sequences that are generated.
Findings:We developed Quality Assessment Software, with which one can review graphs showing the distribution of quality values from the sequencing reads. This software allow us to adopt more stringent quality standards for sequence data, based on quality-graph analysis and estimated coverage after applying the quality filter, providing acceptable sequence coverage for genome construction from short reads.
Conclusions:Quality filtering is a fundamental step in the process of constructing genomes, as it reduces the frequency of incorrect alignments that are caused by measuring errors, which can occur during the construction process due to the size of the reads, provoking misassemblies. Application of quality filters to sequence data, using the software Quality Assessment, along with graphing analyses, provided greater precision in the definition of cutoff parameters, which increased the accuracy of genome construction.
Background
The introduction of second-generation genome sequen-cing has reduced the cost and time required for genome construction; this method generates large amounts of data and increased sequencing coverage when compared to the dideoxy terminal Sanger method [1]. However, this new methodology reduces the size of the readings and has brought challenges to the genome assembly process, such as a need to develop efficient algorithms to reconstruct the genome [2]. Several examples of pro-grams suitable for genome assembly from short reads are Velvet [3], Edena [4], SHARCGS [5], VCAKE [6], ALLPATHS [7], Euler-SR [8], and Quality-value guided Short Read Assembler (QSRA) [9]. All of them involve a process of connecting overlapping DNA sequences; however, only QRSA considers the quality of the reads during the assembly process.
Regardless of the assembly method used, data prepara-tion is necessary. One step in this preparaprepara-tion is the quality filter, whenever readings are taken with a lower phred quality [10]. Independent of the genome con-struction system, it is necessary to prepare the data. One of the steps in data preparation is a quality filter, with which reads with low phred quality are removed. This improves the alignment of the sequences to avoid problems due to mismatches [11]. Li et al. (2010) observed a 50% decrease in alignment errors when bases screened for quality were used; this is an important part of the preparation required for producing accurate results.
The cutoff value for read quality affects the coverage and especially the quality of sequencing. Very stringent parameters can reduce the coverage of the genome and hinder the assembly process. Also, using poor-quality bases that are products of mismatches can lead to less accurate results. To address this problem, we developed the software Quality Assessment (QA), with which one can review graphs showing the distribution of quality values from the sequencing reads, including the average * Correspondence: [email protected]
1
Instituto de Ciências Biológicas, Universidade Federal do Pará, Belém-PA, Brazil
Full list of author information is available at the end of the article
quality, and the accumulated quality for each of the bases; this information can be used to estimate the cov-erage and quantity of the readings that pass through the quality filter.
Input format
QA receives two files as input: the first with standard-only Phred quality values for each base of a read, and the second containing the sequences in nucleotides or color space (SOLiD). The input files must have equal size sequences such as those generated by the SOLiD and Illumina platforms in order to be used for the gen-eration of quality graphs.
Sample Data
The data that we tested with this software were obtained from sequencing ofCorynebacterium pseudotuberculosis
(Cp162) and Exiguobacterium antarcticum (B7) with
SOLiD system, using a library of fragments with read-ings of 35 base pairs (bp) and a mate-pair library with 25 bp for each tag, F3 and R3, respectively [12]. We obtained 21,102,241 readings from the Cp162 data, and 44,171,676 and 45,024,226 readings, from the B7 tags F3 and R3, respectively.
The estimated genome coverage was obtained using the formulaC= (n*L)/S, whereCis the estimated cov-erage, n is the number of readings, Lis the size of the
reads and S is the expected size of the genome [13]. The expected sizes for the genomes used in this study were defined based on phylogenetically-related organ-isms deposited in Genbank. For Cp162, a size of 2.3 mega bases (Mb) was obtained based on Corynebacter-ium pseudotuberculosisFRC41 (CP002097), and for B7,
about 3 Mb was obtained based on Exiguobacterium
sibiricum 255-15(CP001022).
Implementation
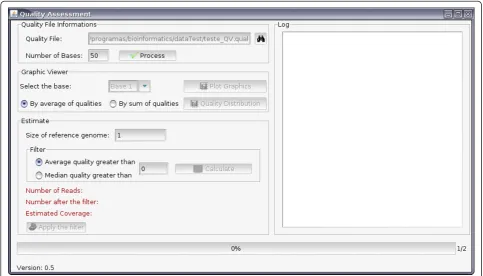
[image:2.595.56.540.427.703.2]The software was developed in JAVA programming lan-guage http://java.sun.com/, using the paradigm of object orientation and the graph library Swing http://java.sun. com/docs/books/tutorial/uiswing. Input is raw files from the sequencing machine (multifasta format): (i) files containing the quality values of phred for the readings [14] and (ii) sequences in color space [15] or nucleotide format; this information is solicited only at the time that the quality filter is applied to the data. The software (Figure 1) offers an option in which the size of the expected reads is informed, and when processing is fin-ished it generates a log that shows the multifasta-file-sequence formatting problems: invalid characters, blank lines, and reads that are not of the expected size; these are eliminated in the processing. Optionally, the soft-ware can be run without the graphing interface; how-ever, in this option it is not possible to estimate the
coverage of the genome, and the phred quality values need to be previously defined.
The raw data file, which includes information on the quality of the sequences, is processed, and the frequen-cies of the mean and median values for each base are stored in ahash table, to be used to calculate the esti-mated coverage of the sequencing and for the
generation of the graphs that show the distribution of the base quality values and means, using the library
JfreeCharthttp://www.jfree.org/jfreechart/.
[image:3.595.60.539.193.696.2]Applying the filter to the raw data files requires a large memory; for this reason, after the first file is gen-erated, the memory reserved for the execution of the process is liberated to the operational system through
the Java language resource know as garbage collection, run by the program itself. The filtered files are stored in the same original directories, with the extension.new
added to each file name.
Results and Discussion
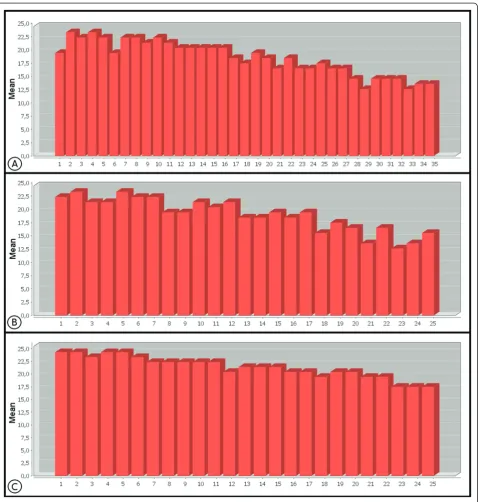
The mean quality of each of the 35 sequence bases from the Cp162 data can be observed in Figure 2a; 17 of these
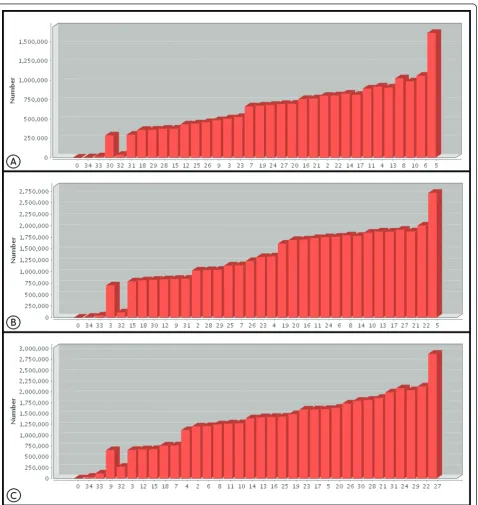
[image:4.595.61.540.195.701.2]gave a mean quality equal to or greater than phred 20, while the terminal bases of the reads had a mean quality of less than 20 [16]. Figure 3a shows the frequency of the quality values of the 35thbase of Cp162, with phred 5 being the most common value, which influences the reduction in mean quality observed for this base in Fig-ure 2a. When a cut off filter of phred 20 was applied, the number of reads was reduced by about 43% (Table 1),
resulting in a sequence coverage of 172×. Based on the data in Table 2, application of a filter with phred 23 values would give sequence coverage above 100× and a high degree of accuracy of the reads, which would reduce the possibility of misassemblies [17].
In the case of IB7 with the tags F3 and R3, both with 25 bp, the mean quality of the bases was above 20, except for the terminal bases shown in Figures 2b and 2c, with tag R3 presenting better quality than F3, except at the 12thbase. The terminal bases, Figures 3b and 3c, had the highest frequencies of quality levels at phred 5 and 26 for F3 and R3, respectively, which allows more stringent filters to be applied to tag R3, without exces-sive loss of coverage, when compared to F3 (Table 2). After applying the quality filter to F3 and R3, with a cutoff at phred 20, the percentage reads discarded for F3 was greater than for R3 (Table 1).
Defining quality values above phred 20 reduced the coverage of the sequences, but it increased data quality, as can be seen in Table 2, in which phred values of 23 and 25 were used as quality cutoff values.
To apply the filter, one can use mean or median qual-ity values observed in the read. When the mean is used, low quality bases can provoke elimination of the read, which can reduce the coverage of the sequencing, though it will also increase the quality [17]. Variation in the quality values of the bases does not influence the median, which could result in a tendency to accept low quality bases, increasing the probability of errors in the genome construction process.
In Figure 4a, we can see a reading with a median value of 23 and a mean of 19; consequently, if we apply
a quality filter with phred 20 based on the median, the read would be considered as having six bases with qual-ity below 10. In Figure 4b, if the same filter were applied, the read would be discarded, even though it has a mean quality value of 22.
Conclusions
Applying a quality filter to raw sequencing data is required in order to reduce sequence construction error, given that the methodologies available for constructing genomes are based on sequence alignment, in which a wrong base can cause a mismatch, making alignment impossible.
The software Quality Assessment allows the operator to visualize quality graphs of the bases in the reads and estimate the coverage based on means or medians, mak-ing it possible to select more precise cutoff parameters, reducing the possibility of eliminating high-quality reads or including low-quality reads, which increases the accu-racy of the process of constructing genomes from sec-ond-generation sequencers.
Availability and Requirements Project name:QA - Quality Assessment
Project home page:http://qualevaluato.sourceforge. net
Operating system(s):Platform independent Programming language:Java
Other requirements:Java JDK 1.6 or higher
[image:5.595.308.538.90.178.2]License:GNU GPL
Table 1 Results of applying the Phred quality filter
Raw data Filter by Mean Filter by Median
Cp162 21,102,241 11,349,208(53.78%) 13,140,825(62.27%)
B7(F3) 44,171,676 24,927,365(56.46%) 28,216,025(63.87%)
B7(R3) 45,024,226 31,809,614(70.64%) 33,765,330 (74.99%)
Cp162-Corynebacterium pseudotuberculosisstrain (fragment library). B7 -Exiguobacterium antarticumstrain (mate-paired library). R3 e F3 - Reads generated by mate-paired library.
[image:5.595.56.289.100.152.2]Number of reads generated during the sequencing of Cp162 and B7 (tag F3 and R3) taking into account both the raw data and filtered data, based on the average and median Phred quality, whose cutoff was taken to be 20.
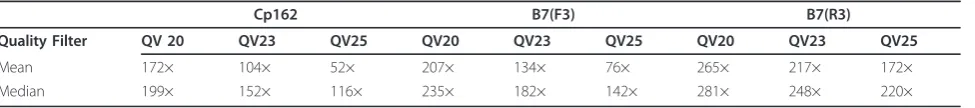
Table 2 Genome coverage analysis for different Phred quality values
Cp162 B7(F3) B7(R3)
Quality Filter QV 20 QV23 QV25 QV20 QV23 QV25 QV20 QV23 QV25
Mean 172× 104× 52× 207× 134× 76× 265× 217× 172×
Median 199× 152× 116× 235× 182× 142× 281× 248× 220×
Genomic sequencing coverage of Cp162 and B7 (tag F3 and R3) for different Phred quality value cutoffs based on the mean and median.
[image:5.595.58.546.640.694.2]Restrictions for use: Permission must be obtained from the author for non-academic/non-public use.
Acknowledgements
This work was part of the Rede Paraense de Genômica e Proteômica supported by Fundação de Amparo a Pesquisa do Estado do Pará. V.A.C.A., A.S. and A.C were supported by Conselho Nacional de Desenvolvimento Científico e Tecnológico (CNPq). R.T.J.R. acknolwedges support from the Coordenação de Aperfeiçoamento de Pessoal de Nível Superior (CAPES). We are also grateful to Silvanira Barbosa for her help with sequencing of samples.
Author details
1Instituto de Ciências Biológicas, Universidade Federal do Pará, Belém-PA,
Brazil.2Instituto de Ciências Biológicas, Universidade Federal de Minas Gerais,
Belo Horizonte-MG, Brazil.3Institute for Genome Research and Systems
Biology. Center for Biotechnology. Germany Institute for Genome Research, Bielefeld University, Bielefeld, Germany.
Authors’contributions
RTJR developed the program, made the performance tests and contributed to data analysis. ARC tested the program and contributed to the analysis of the results. JB provided critical advice on analysis outputs. MPCS, VA and AS coordinated the work and finalized the manuscript. All authors read and approved the final manuscript.
Competing interests
The authors declare that they have no competing interests.
Received: 6 January 2011 Accepted: 18 April 2011 Published: 18 April 2011
References
1. Bentley S:Taming the Next-gen Beast.Nature Reviews Microbiology2010, 8:161.
2. Schuster SC:Next-generation sequencing transform today’s biology.Nat Method2008,5:16-18.
3. Zerbino DR, Birney E:Algorithms for de novo short read assembly using de Bruijn graphs.Genome Research2008,18:821-829.
4. Hernandez D, Francois P, Farinelli L, Osteras M, Schrenzel J:De Novo bacterial genome sequencing: millions of very short reads assembled on a desktop computer.Genome Research2008,18:802-809.
5. Dohm J, Lottaz C, Borodina T, Himmelbaurer H:SHARCGS, a fast and highly accurate short-read assembly algorithm for de novo genomic sequencing.Genome Research2007,17:1697-1706.
6. Jeck W, Reinhardt J, Baltrus D, Hickenbotham M, Magrini V, Mardis E, Dangl J, Jones C:Extending assembly of short DNA sequences to handle error.BMC Bioinformatics2007,23:2942-2944.
7. Butler J, MacCallum L, Kleber M, Shlyakhter I, Belmonte M, Lander E, Nusbaum C, Jaffe D:ALLPATHS: De novo assembly of whole-genome shotgun microreads.Genome Research2008,18:810-820.
8. Chaisson M, Pevzner P:Short read fragment assembly of bacterial genomes.Genome Research2008,18:324-330.
9. Bryant DW, Wong W-K, Mockler TC:QSRA - a quality-value guided de novo short read assembler.BMC Bioinformatics2009,10:69. 10. Ewing B, Hillier L, Wendl M, Green P:Base-Calling of Automated
Sequencer Traces Phred. I. Using Accuracy Assessment.Genome Research
1998,8:175-185.
11. Smith A, Xuan Z, Zhang M:Using quality scores and longer reads improves accuracy of Solexa read mapping.BMC Bioinformatics2008, 9:128.
12. Pandey V, Nutter R, Prediger E:Applied SOLiD System: Ligation-Based Sequencing.InNext Generation Genome Sequencing: Towards Personalized Medicine. Volume 1..1 edition. Edited by: Janitz M. Berlin: Wiley; 2008:29-41. 13. Lande E, Waterman M:Genomic mapping by fingerprinting random
clones: A mathematical analysis.Genomics1988,2:231-239.
14. Ewing B, Green P:Base-Calling of Automated Sequencer Traces Using Phred. II. Error Probabilities.BMC Bioinformatics1998,8:186-194.
15. SOLiD Sequencing and 2-Base Encoding.[http://www3.appliedbiosystems. com/cms/groups/mcb_marketing/documents/general documents/ cms_057810.pdf].
16. Gordon D, C A, P G:A graphical tool for sequence finishing.Genome Research1998,8:195-202.
17. Li H, Homer N:A survey of sequence alignment algorithms for next-generation sequencing.Briefings Bioinformatics2010,11:181-197.
doi:10.1186/1756-0500-4-130
Cite this article as:Ramoset al.:Analysis of quality raw data of second generation sequencers with Quality Assessment Software.BMC Research Notes20114:130.
Submit your next manuscript to BioMed Central and take full advantage of:
• Convenient online submission
• Thorough peer review
• No space constraints or color figure charges
• Immediate publication on acceptance
• Inclusion in PubMed, CAS, Scopus and Google Scholar
• Research which is freely available for redistribution