Article
Characterisation of Physical and Mechanical
Properties of Unthinned and Unpruned
Plantation-Grown
Eucalyptus nitens
H.Deane &
Maiden Lumber
Mohammad Derikvand1,* , Nathan Kotlarewski1, Michael Lee2, Hui Jiao3and Gregory Nolan1,2
1 Australian Research Council, Centre for Forest Value, University of Tasmania, Launceston, TAS 7250,
Australia; [email protected] (N.K.); [email protected] (G.N.)
2 Centre for Sustainable Architecture with Wood (CSAW), University of Tasmania, Launceston, TAS 7250,
Australia; [email protected]
3 School of Engineering, AMC, College of Sciences and Engineering, University of Tasmania, Hobart,
TAS 7005, Australia; [email protected]
* Correspondence: [email protected]; Tel.: +61-498-722-516
Received: 22 January 2019; Accepted: 20 February 2019; Published: 21 February 2019
Abstract:The use of fast-growing plantation eucalypt (i.e., pulpwood eucalypt) in the construction of high-value structural products has received special attention from the timber industry in Australia and worldwide. There is still, however, a significant lack of knowledge regarding the physical and mechanical properties of the lumber from such plantation resources as they are mainly being managed to produce woodchips. In this study, the physical and mechanical properties of lumber from a 16-year-old pulpwoodEucalyptus nitensH.Deane & Maiden resource from the northeast of Tasmania, Australia was evaluated. The tests were conducted on 318 small wood samples obtained from different logs harvested from the study site. The tested mechanical properties included bending modulus of elasticity (10,377.7 MPa) and modulus of rupture (53 MPa), shear strength parallel (5.5 MPa) and perpendicular to the grain (8.5 MPa), compressive strength parallel (42.8 MPa) and perpendicular to the grain (4.1 MPa), tensile strength perpendicular to the grain (3.4 MPa), impact bending (23.6 J/cm2), cleavage (1.6 kN) and Janka hardness (23.2 MPa). Simple linear regression models were developed using density and moisture content to predict the mechanical properties. The variations in the moisture content after conventional kiln drying within randomly selected samples in each test treatment were not high enough to significantly influence the mechanical properties. A relatively high variation in the density values was observed that showed significant correlations with the changes in the mechanical properties. The presence of knots increased the shear strength both parallel and perpendicular to the grain and significantly decreased the tensile strength of the lumber. The results of this study created a profile of material properties for the pulpwood E. nitenslumber that can be used for numerical modelling of any potential structural product from such a plantation resource.
Keywords: static bending; impact bending; tensile strength; compressive strength; shear strength; cleavage; hardness; wood failure modes
1. Introduction
The interest in fast-growing plantation species such as eucalypt is increasing as they may have the potential to ensure a sustainable supply of raw materials for producing mass laminated timber
products for different structural building applications [1–6]. The goal of this study was to characterise the physical and mechanical properties of lumber obtained from a 16-year-old pulpwoodEucalyptus nitens(E. nitens) H.Deane & Maiden resource. This resource is currently under investigation by the Australian timber industry as a potential raw material for the production of structural mass laminated timber.
Eucalypt includes around 900 different species that are almost all endemic to Australia [7]. The plantation hardwood estate in Australia is mainly comprised ofEucalyptus globulusLabill. and E. nitens. The two species of eucalypt are primarily managed in short rotation harvest cycles for pulplog production [8]. Tasmania has the second largest estate of hardwood plantations in Australia. Around 90 per cent of the estate is fibre-grownE. nitensplantations that are managed under unthinned and unpruned forestry regimes. In recent years, there has been a growing interest by the timber industry in using this resource for different structural and non-structural products such as sawn lumber [9], plywood [10], laminated veneer lumber [11], and mass laminated timber [12]. The latter case has recently been considered as a potential product option for using pulpwoodE. nitensin structural building applications at a commercial scale.
Mass laminated timber includes different engineered products that are directly constructed by laminating sawn lumber together using either structural adhesives or mechanical fasteners—such as cross-laminated timber and nail-laminated timber. The production of mass laminated timber from the pulpwoodE. nitens,however, requires a robust understanding of the structural performance of the lumber from this resource. Due to the forestry managements procedures used that are based on pulplog production, E. nitens lumber contains substantial amount of growth defects such as knots [12,13]. When dealing with plantation resources of this character, understanding the impact of knots on different mechanical properties of lumber is critical and plays a major role at the design stage of structural elements.
The use of a new plantation resource for structural applications also requires establishing its relevant strength groups. This is achievable by testing small clear wood samples from the resource and obtaining the average and lower 5th percentile values for different mechanical properties. These values are already known for commercially available hardwoods and softwoods and can be obtained through relevant standard design codes such as AS 1720.1 [14]. To establish these values for the pulpwood E. nitenslumber, an appropriate sampling and testing system needs to be developed. It is therefore necessary to understand how the physical and mechanical properties of the resource are affected by different natural and processing parameters.
In a number of previous studies, the bending properties and basic density of sawn boards fromE. nitensplantations were examined as functions of parameters related to the characteristics of plantation site, tree age and applied forestry management regimes [9,15–18]. There is still a significant lack of knowledge around the other physical and mechanical properties of this plantation resource. The available information to date is limited to a few basic mechanical properties of the resource including hardness, bending modulus of elasticity (MOE) and bending modulus of rupture (MOR) under short-term loading conditions [9,17]. Additional experimental works are required to establish relevant design codes and specifications for using this resource in the production of structural products for building applications.
The specific objectives of this study:
• Determined the MOE, MOR, shear strength parallel (SPA) and perpendicular (SPE) to the grain, tensile strength perpendicular to the grain (TPE), compressive strength parallel (CPA) and perpendicular (CPE) to the grain, cleavage, impact bending strength (IBS) and Janka hardness of the pulpwoodE. nitenslumber.
• Determined the impacts of variations in basic density and minor variations in moisture content (MC)after conventional kiln drying on the mechanical properties.
Forests2019,10, 194 3 of 13
• Developed and examined different linear-regression models to predict the mechanical properties of the resource.
• Evaluated the coefficient of variation (COV) in the different physical and mechanical properties of the resource to create a basis for the establishment of an appropriate testing system for obtaining allowable design stress values of the resource in future studies.
2. Materials and Methods
2.1. Lumber
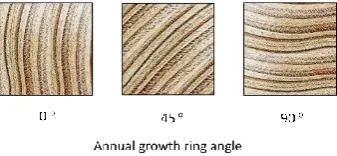
The test samples in this study were extracted from randomly selected lumber obtained from a 16-year-oldE. nitenspulpwood resource in the northeast of Tasmania, Australia. The plantation site is located in the Woolnorth region with a maximum altitude of 190 m. The required lumbers was obtained from six different logs with an average small-end diameter of 359 mm. These logs were randomly selected from 44 logs originally harvested in 2016 for a research project at University of Tasmania that was aimed to develop structural products from this plantation resource for building applications. The harvested logs represent the butt log and come from different tress. After harvesting, the logs were sawn at a local mill using conventional plain sawing method. The sawn lumbers was dried in an industrial hardwood kiln and then finished/dressed at a nominal thickness of 35 mm. The finished lumbers had a substantial number of knots, surface checks and end splits. The clear wood samples in this study were cut from randomly selected lumber from different logs to ensure a good range of variations in the density andMCvalues. Variation inMCin this study refers to the differences betweenMCvalues of the lumber after the conventional kiln drying. Such differences might be minor. However, there is a lack of information regarding how these minor variations in theMCvalues can influence the physical and mechanical properties of the lumber. The clear wood samples were taken from different annual growth ring angles (Figure1) and straight grain wood to reduce the impact of sloping grain on the results obtained.
Forests 2019, 10, x FOR PEER REVIEW 3 of 14
2. Materials and Methods
2.1. Lumber
[image:3.595.213.382.451.529.2]The test samples in this study were extracted from randomly selected lumber obtained from a 16-year-old E. nitens pulpwood resource in the northeast of Tasmania, Australia. The plantation site is located in the Woolnorth region with a maximum altitude of 190 m. The required lumbers was obtained from six different logs with an average small-end diameter of 359 mm. These logs were randomly selected from 44 logs originally harvested in 2016 for a research project at University of Tasmania that was aimed to develop structural products from this plantation resource for building applications. The harvested logs represent the butt log and come from different tress. After harvesting, the logs were sawn at a local mill using conventional plain sawing method. The sawn lumbers was dried in an industrial hardwood kiln and then finished/dressed at a nominal thickness of 35 mm. The finished lumbers had a substantial number of knots, surface checks and end splits. The clear wood samples in this study were cut from randomly selected lumber from different logs to ensure a good range of variations in the density and MC values. Variation in MC in this study refers to the differences between MC values of the lumber after the conventional kiln drying. Such differences might be minor. However, there is a lack of information regarding how these minor variations in the MC values can influence the physical and mechanical properties of the lumber. The clear wood samples were taken from different annual growth ring angles (Figure 1) and straight grain wood to reduce the impact of sloping grain on the results obtained.
Figure 1. The arrangement of the three general annual growth ring orientations in the cross-section of the samples.
2.2. Sample and Test Descriptions
2.2.1. Static Bending Test
The MOE and MOR values of the pulpwood E. nitens lumber were determined on clear wood samples with the dimensions of 25 mm × 25 mm × 410 mm using a three-point test set-up and a span length of 360 mm according to American Society for Testing and Materials (ASTM) D 143 [19]. The loading rate was set at 1.3 mm/min. The MOE and MOR under three-point bending load were calculated using the following equations:
𝑀𝑂𝐸 =
𝐿
3
(𝑃
2
− 𝑃
1)
4𝑏𝑑
3(𝜑
2
− 𝜑
1)
,
(1)𝑀𝑂𝑅 =
3𝑃𝐿
2𝑏𝑑
2,
(2)where, b and d are the width (breadth) and depth of the sample (mm), L is the span length (mm), (P2 -P1) is the load increment on the load-deflection curve in the linear-elastic range with P2 and P1 being
approximately 40% and 10% of the maximum applied load (P) at failure point (N), φ2 and φ1 are the
maximum mid-span deflections (mm) at P2 and P1 loads, respectively.
2.2.2. Janka Hardness Test
Figure 1.The arrangement of the three general annual growth ring orientations in the cross-section of the samples.
2.2. Sample and Test Descriptions 2.2.1. Static Bending Test
TheMOEandMORvalues of the pulpwoodE. nitenslumber were determined on clear wood samples with the dimensions of 25 mm×25 mm×410 mm using a three-point test set-up and a span length of 360 mm according to American Society for Testing and Materials (ASTM) D 143 [19]. The loading rate was set at 1.3 mm/min. TheMOEandMORunder three-point bending load were calculated using the following equations:
MOE= L
3(P 2−P1) 4bd3(ϕ
2−ϕ1)
, (1)
MOR= 3PL
where,banddare the width (breadth) and depth of the sample (mm),Lis the span length (mm), (P2−P1) is the load increment on the load-deflection curve in the linear-elastic range withP2andP1 being approximately 40% and 10% of the maximum applied load (P) at failure point (N),ϕ2andϕ1are the maximum mid-span deflections (mm) atP2andP1loads, respectively.
2.2.2. Janka Hardness Test
The Janka hardness was assessed on clear wood samples with nominal dimensions of 35 mm×50 mm × 150 mm. The tests were conducted according to ASTM D 143 [19] with the speed of loading of 6 mm/min using a ball bearing fixture with 11.3 mm diameter. The loading of the samples continued until a penetration depth equal to one half of the diameter of the ball bearing was achieved. The test on each sample was repeated six times—twice on the widest surface, twice on the narrowest surface and twice on cross-sections of the samples. In total, sixty tests were conducted for measuring hardness on different surfaces of the samples. The overall Janka hardness was calculated as an average value from all the measurements on different surfaces. The average hardness on the widest and narrowest surfaces (referred to as side hardness) and the two cross-sections (referred to as axial hardness) of the samples were also analysed and reported separately.
2.2.3. IBS Test
The IBS was determined using Charpy Impact Test (CIT) with a 20-kilogram hammer/striker. The dimensions of the test samples were 25 mm×25 mm×100 mm. The samples were V-notched in the mid-span to a depth of 3 mm. The samples were hit by the Charpy striker in the mid-span. The energy required to break each sample was determined by measuring the height of the Charpy hammer before and after hitting the sample. TheIBSwas then calculated using Equation (3).
IBS= ε
b×d, (3)
where,IBSis the impact bending strength (J/cm2);εis the energy absorbed by the sample at failure
point (J);banddare the breadth and the depth of the sample (cm).
The results obtained from the CIT must be converted to the MCof 12% [20]. However, as examining the effect of variation inMCon theIBSwas one of the objectives of this study, the results obtained from the CIT were remained at their original values without any conversion.
2.2.4. Cleavage Test
The samples for cleavage test had the dimensions of 35 mm×50 mm×90 mm. The samples were constructed using a computer numerical control (CNC) router. The tests were conducted according to the procedures of ASTM D 143 [19] at the loading rate of 2.5 mm/min.
2.2.5. Shear Test
Forests2019,10, 194 5 of 13
Forests 2019, 10, x FOR PEER REVIEW 4 of 14
The Janka hardness was assessed on clear wood samples with nominal dimensions of 35 mm × 50 mm × 150 mm. The tests were conducted according to ASTM D 143 [19] with the speed of loading of 6 mm/min using a ball bearing fixture with 11.3 mm diameter. The loading of the samples continued until a penetration depth equal to one half of the diameter of the ball bearing was achieved. The test on each sample was repeated six times—twice on the widest surface, twice on the narrowest surface and twice on cross-sections of the samples. In total, sixty tests were conducted for measuring hardness on different surfaces of the samples. The overall Janka hardness was calculated as an average value from all the measurements on different surfaces. The average hardness on the widest and narrowest surfaces (referred to as side hardness) and the two cross-sections (referred to as axial hardness) of the samples were also analysed and reported separately.
2.2.3. IBS Test
The IBS was determined using Charpy Impact Test (CIT) with a 20-kilogram hammer/striker. The dimensions of the test samples were 25 mm × 25 mm × 100 mm. The samples were V-notched in the mid-span to a depth of 3 mm. The samples were hit by the Charpy striker in the mid-span. The energy required to break each sample was determined by measuring the height of the Charpy hammer before and after hitting the sample. The IBS was then calculated using Equation 3.
𝐼𝐵𝑆 =
𝜀𝑏×𝑑, (3)
where, IBS is the impact bending strength (J/cm2); ε is the energy absorbed by the sample at failure
point (J); b and d are the breadth and the depth of the sample (cm).
The results obtained from the CIT must be converted to the MC of 12% [20]. However, as examining the effect of variation in MC on the IBS was one of the objectives of this study, the results obtained from the CIT were remained at their original values without any conversion.
2.2.4. Cleavage Test
The samples for cleavage test had the dimensions of 35 mm × 50 mm × 90 mm. The samples were constructed using a computer numerical control (CNC) router. The tests were conducted according to the procedures of ASTM D 143 [19] at the loading rate of 2.5 mm/min.
2.2.5. Shear Test
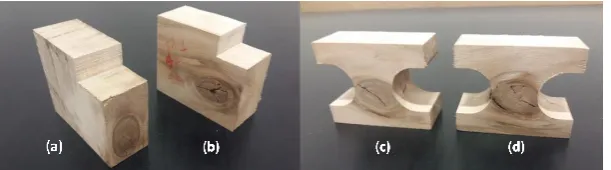
[image:5.595.147.453.89.174.2]Shear strength is a critical property in almost all structural building applications such as bending members, shear walls, trusses and connections. The shear strength of the pulpwood E. nitens lumber was measured both parallel and perpendicular to the grain direction. The block shear specimens were constructed in accordance with the procedures described in ASTM D 143 [19]—except for the thickness of the samples that was limited by the thickness of the available boards (i.e., 35 mm). The samples were identically constructed using a CNC router. The impacts of presence of knots and variations in density and MC on the SPA and SPE of the samples were evaluated. For samples that contained a knot (knotted samples), the location of the feature was on the centre line of the applied load in the shear area of the sample (Figure 2). The overall average SPA and SPE were determined on clear wood samples—with no knots or any other defects. The test samples were loaded in shear according to the test procedure of ASTM D 143 [19] at a loading rate of 0.6 mm/min.
Figure 2. The location of knot in samples prepared for shear strength parallel (SPA) test (a), perpendicular (SPE) test (b) and tensile strength perpendicular (TPE) test (c,d).
2.2.6. Tension Test
The tensile strength of the lumber was determined perpendicular to the grain (i.e., TPE). The dimension of the test samples was 35 mm×50 mm×50 mm. The test samples were fabricated using a CNC router in order to improve the repeatability of the tests and reduce the standard deviation (SD) in the results caused by any variation in the shape and dimensions of the samples. The impacts of presence of knots and variations in density andMCon theTPEof the samples were assessed. For the knotted samples, the location of the knot was on the centre line of the test sample (Figure2). TheTPE samples were tested to ASTM D 143 [19] with a loading rate of 2.5 mm/min.
2.2.7. Compression Test
Compressive strength is an important mechanical property in all contact points between structural elements in buildings, especially in compression members such as columns and in contact points where the reaction forces are present (e.g., floor bearers and joists). The compressive strength was evaluated both parallel and perpendicular to the grain direction. The dimensions of the samples were 25 mm×25 mm×100 mm for theCPAtest and 35 mm×50 mm×150 mm for theCPEtest. Two samples were extracted from each selected board to test theCPAandCPEof the lumber. The tests were conducted according to the procedures of ASTM D 143 [19]. The speed of loading was 0.3 mm/min for both tests. For theCPEtest, the samples were loaded using a square metal bearing plate with the width of 50 mm. The CPE test was continued until a minimum of 2.5 mm deflection was achieved. TheCPAtest was conducted to the failure point of the samples. The impacts of variations in density andMCon bothCPAandCPEwere evaluated.
2.2.8. Basic Density andMCMeasurement
The basic density andMCwere measured for each sample tested for the different mechanical properties using the oven-dry weight. In total, 159 specimens were collected from the tested samples and assessed. TheMCof the samples was calculated using according to AS/NZS 1080.1 [21].
The basic density of the samples was calculated using the following equation:
ρ= m1
V ×
100
(100+MC), (4)
where,MCis the moisture content (%),ρis the basic density (kg/m3),m0is the weight of the sample before oven-drying (kg),m1is the weight of the sample after oven-drying (kg),Vis the volume of the samples before oven-drying (m3).
2.3. Statistical Analysis
Table 1. Experimental design of the study. Abbreviations: shear strength parallel (SPA) and perpendicular (SPE); tensile strength perpendicular to the grain (TPE); compressive strength parallel (CPA) and perpendicular (CPE) to the grain, cleavage; impact bending strength (IBS); Janka hardness (JH); moisture content (MC).
Test Method Test Schematic Total Number of Samples
Static bending a 15
SPA b 23 (4 knotted samples)
SPE b 23 (5 knotted samples)
TPE c 22 (4 knotted samples)
CPA d 15
CPE e 15
Cleavage f 21
IBS - 15
JH g 10
Basic density andMC 159
Total number of samples 318
Forests 2019, 10, x FOR PEER REVIEW 6 of 14
TPE c 22 (4 knotted samples)
CPA d 15
CPE e 15
Cleavage f 21
IBS - 15
JH g 10
Basic density and
MC 159
Total number of samples 318
(a) (b) (c) (d) (e) (f) (g)
The results obtained were statistically analysed using IBM SPSS Statistics software (version 23, IBM Corporation, New York, NY, USA). The normal distribution of the data set was examined using the Skewness Test. Analysis of variance (ANOVA) was used to determine the significance of differences between knotted and clear wood samples. Linear-regression models were developed using density and MC as regressors to predict the mechanical properties of the pulpwood E. nitens
H.Deane & Maiden lumber. The coefficient of determination (R2) was used to evaluate the
significance of correlations between density, MC and the mechanical properties of the resource.
3. Results and Discussions
3.1. Basic Density and MC
The overall average MC and basic density values obtained from the tested samples are shown in Table 2. The results showed a high variation in the density of the samples with more than 239.6
kg/m3 difference between the minimum and maximum values. However, the COV (i.e., SD divided
by mean value) for density was still in the standard range at only 8.5%. Around 67% of the samples showed a density greater than 500 kg/m3. The density of the pulpwood E. nitens lumber in this study
was 9.2% higher than that of the same plantation resource (480.6 kg/m3) reported by Derikvand et al.
[13] and significantly lower than that of E. nitens lumber from native forests (670 kg/m3) indicated in
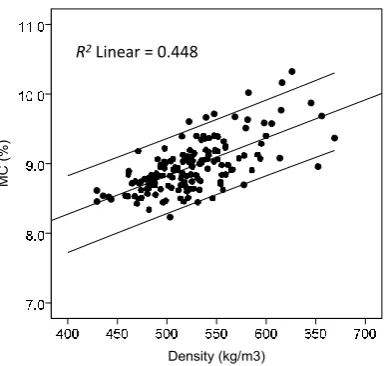
[image:6.595.114.484.707.750.2]AS 2082 [22]. The correlation between MC and density of the plantation E. nitens was positive and highly significant (p < 0.00). The results indicated that the basic density could explain more than 44% of the variations in the MC values of the samples (Figure 3). The COV for the MC values within all the samples tested in this study was low at less than 4.5%.
Table 2. Average MC and basic density values.
N Minimum Maximum Mean SD
Density (kg/m3) 159 429.4 669.0 523.6 44.6
MC (%) 159 8.2 10.5 9.0 0.4
Forests 2019, 10, x FOR PEER REVIEW 6 of 14
TPE c 22 (4 knotted samples)
CPA d 15
CPE e 15
Cleavage f 21
IBS - 15
JH g 10
Basic density and
MC 159
Total number of samples 318
(a) (b) (c) (d) (e) (f) (g)
The results obtained were statistically analysed using IBM SPSS Statistics software (version 23, IBM Corporation, New York, NY, USA). The normal distribution of the data set was examined using the Skewness Test. Analysis of variance (ANOVA) was used to determine the significance of differences between knotted and clear wood samples. Linear-regression models were developed using density and MC as regressors to predict the mechanical properties of the pulpwood E. nitens
H.Deane & Maiden lumber. The coefficient of determination (R2) was used to evaluate the
significance of correlations between density, MC and the mechanical properties of the resource.
3. Results and Discussions
3.1. Basic Density and MC
The overall average MC and basic density values obtained from the tested samples are shown in Table 2. The results showed a high variation in the density of the samples with more than 239.6
kg/m3 difference between the minimum and maximum values. However, the COV (i.e., SD divided
by mean value) for density was still in the standard range at only 8.5%. Around 67% of the samples showed a density greater than 500 kg/m3. The density of the pulpwood E. nitens lumber in this study
was 9.2% higher than that of the same plantation resource (480.6 kg/m3) reported by Derikvand et al.
[13] and significantly lower than that of E. nitens lumber from native forests (670 kg/m3) indicated in
AS 2082 [22]. The correlation between MC and density of the plantation E. nitens was positive and highly significant (p < 0.00). The results indicated that the basic density could explain more than 44% of the variations in the MC values of the samples (Figure 3). The COV for the MC values within all the samples tested in this study was low at less than 4.5%.
Table 2. Average MC and basic density values.
N Minimum Maximum Mean SD
Density (kg/m3) 159 429.4 669.0 523.6 44.6
MC (%) 159 8.2 10.5 9.0 0.4
Forests 2019, 10, x FOR PEER REVIEW 6 of 14
TPE c 22 (4 knotted samples)
CPA d 15
CPE e 15
Cleavage f 21
IBS - 15
JH g 10
Basic density and
MC 159
Total number of samples 318
(a) (b) (c) (d) (e) (f) (g)
The results obtained were statistically analysed using IBM SPSS Statistics software (version 23, IBM Corporation, New York, NY, USA). The normal distribution of the data set was examined using the Skewness Test. Analysis of variance (ANOVA) was used to determine the significance of differences between knotted and clear wood samples. Linear-regression models were developed using density and MC as regressors to predict the mechanical properties of the pulpwood E. nitens
H.Deane & Maiden lumber. The coefficient of determination (R2) was used to evaluate the
significance of correlations between density, MC and the mechanical properties of the resource.
3. Results and Discussions
3.1. Basic Density and MC
The overall average MC and basic density values obtained from the tested samples are shown in Table 2. The results showed a high variation in the density of the samples with more than 239.6
kg/m3 difference between the minimum and maximum values. However, the COV (i.e., SD divided
by mean value) for density was still in the standard range at only 8.5%. Around 67% of the samples showed a density greater than 500 kg/m3. The density of the pulpwood E. nitens lumber in this study
was 9.2% higher than that of the same plantation resource (480.6 kg/m3) reported by Derikvand et al.
[13] and significantly lower than that of E. nitens lumber from native forests (670 kg/m3) indicated in
AS 2082 [22]. The correlation between MC and density of the plantation E. nitens was positive and highly significant (p < 0.00). The results indicated that the basic density could explain more than 44% of the variations in the MC values of the samples (Figure 3). The COV for the MC values within all the samples tested in this study was low at less than 4.5%.
Table 2. Average MC and basic density values.
N Minimum Maximum Mean SD
Density (kg/m3) 159 429.4 669.0 523.6 44.6
MC (%) 159 8.2 10.5 9.0 0.4
Forests 2019, 10, x FOR PEER REVIEW 6 of 14
TPE c 22 (4 knotted samples)
CPA d 15
CPE e 15
Cleavage f 21
IBS - 15
JH g 10
Basic density and
MC 159
Total number of samples 318
(a) (b) (c) (d) (e) (f) (g)
The results obtained were statistically analysed using IBM SPSS Statistics software (version 23, IBM Corporation, New York, NY, USA). The normal distribution of the data set was examined using the Skewness Test. Analysis of variance (ANOVA) was used to determine the significance of differences between knotted and clear wood samples. Linear-regression models were developed using density and MC as regressors to predict the mechanical properties of the pulpwood E. nitens
H.Deane & Maiden lumber. The coefficient of determination (R2) was used to evaluate the
significance of correlations between density, MC and the mechanical properties of the resource.
3. Results and Discussions
3.1. Basic Density and MC
The overall average MC and basic density values obtained from the tested samples are shown in Table 2. The results showed a high variation in the density of the samples with more than 239.6
kg/m3 difference between the minimum and maximum values. However, the COV (i.e., SD divided
by mean value) for density was still in the standard range at only 8.5%. Around 67% of the samples showed a density greater than 500 kg/m3. The density of the pulpwood E. nitens lumber in this study
was 9.2% higher than that of the same plantation resource (480.6 kg/m3) reported by Derikvand et al.
[13] and significantly lower than that of E. nitens lumber from native forests (670 kg/m3) indicated in
AS 2082 [22]. The correlation between MC and density of the plantation E. nitens was positive and highly significant (p < 0.00). The results indicated that the basic density could explain more than 44% of the variations in the MC values of the samples (Figure 3). The COV for the MC values within all the samples tested in this study was low at less than 4.5%.
Table 2. Average MC and basic density values.
N Minimum Maximum Mean SD
Density (kg/m3) 159 429.4 669.0 523.6 44.6
MC (%) 159 8.2 10.5 9.0 0.4
Forests 2019, 10, x FOR PEER REVIEW 6 of 14
TPE c 22 (4 knotted samples)
CPA d 15
CPE e 15
Cleavage f 21
IBS - 15
JH g 10
Basic density and
MC 159
Total number of samples 318
(a) (b) (c) (d) (e) (f) (g)
The results obtained were statistically analysed using IBM SPSS Statistics software (version 23, IBM Corporation, New York, NY, USA). The normal distribution of the data set was examined using the Skewness Test. Analysis of variance (ANOVA) was used to determine the significance of differences between knotted and clear wood samples. Linear-regression models were developed using density and MC as regressors to predict the mechanical properties of the pulpwood E. nitens
H.Deane & Maiden lumber. The coefficient of determination (R2) was used to evaluate the
significance of correlations between density, MC and the mechanical properties of the resource.
3. Results and Discussions
3.1. Basic Density and MC
The overall average MC and basic density values obtained from the tested samples are shown in Table 2. The results showed a high variation in the density of the samples with more than 239.6
kg/m3 difference between the minimum and maximum values. However, the COV (i.e., SD divided
by mean value) for density was still in the standard range at only 8.5%. Around 67% of the samples showed a density greater than 500 kg/m3. The density of the pulpwood E. nitens lumber in this study
was 9.2% higher than that of the same plantation resource (480.6 kg/m3) reported by Derikvand et al.
[13] and significantly lower than that of E. nitens lumber from native forests (670 kg/m3) indicated in
AS 2082 [22]. The correlation between MC and density of the plantation E. nitens was positive and highly significant (p < 0.00). The results indicated that the basic density could explain more than 44% of the variations in the MC values of the samples (Figure 3). The COV for the MC values within all the samples tested in this study was low at less than 4.5%.
Table 2. Average MC and basic density values.
N Minimum Maximum Mean SD
Density (kg/m3) 159 429.4 669.0 523.6 44.6
MC (%) 159 8.2 10.5 9.0 0.4
Forests 2019, 10, x FOR PEER REVIEW 6 of 14
TPE c 22 (4 knotted samples)
CPA d 15
CPE e 15
Cleavage f 21
IBS - 15
JH g 10
Basic density and
MC 159
Total number of samples 318
(a) (b) (c) (d) (e) (f) (g)
The results obtained were statistically analysed using IBM SPSS Statistics software (version 23, IBM Corporation, New York, NY, USA). The normal distribution of the data set was examined using the Skewness Test. Analysis of variance (ANOVA) was used to determine the significance of differences between knotted and clear wood samples. Linear-regression models were developed using density and MC as regressors to predict the mechanical properties of the pulpwood E. nitens
H.Deane & Maiden lumber. The coefficient of determination (R2) was used to evaluate the
significance of correlations between density, MC and the mechanical properties of the resource.
3. Results and Discussions
3.1. Basic Density and MC
The overall average MC and basic density values obtained from the tested samples are shown in Table 2. The results showed a high variation in the density of the samples with more than 239.6
kg/m3 difference between the minimum and maximum values. However, the COV (i.e., SD divided
by mean value) for density was still in the standard range at only 8.5%. Around 67% of the samples showed a density greater than 500 kg/m3. The density of the pulpwood E. nitens lumber in this study
was 9.2% higher than that of the same plantation resource (480.6 kg/m3) reported by Derikvand et al.
[13] and significantly lower than that of E. nitens lumber from native forests (670 kg/m3) indicated in
AS 2082 [22]. The correlation between MC and density of the plantation E. nitens was positive and highly significant (p < 0.00). The results indicated that the basic density could explain more than 44% of the variations in the MC values of the samples (Figure 3). The COV for the MC values within all the samples tested in this study was low at less than 4.5%.
Table 2. Average MC and basic density values.
N Minimum Maximum Mean SD
Density (kg/m3) 159 429.4 669.0 523.6 44.6
MC (%) 159 8.2 10.5 9.0 0.4
Forests 2019, 10, x FOR PEER REVIEW 6 of 14
TPE c 22 (4 knotted samples)
CPA d 15
CPE e 15
Cleavage f 21
IBS - 15
JH g 10
Basic density and
MC 159
Total number of samples 318
(a) (b) (c) (d) (e) (f) (g)
The results obtained were statistically analysed using IBM SPSS Statistics software (version 23, IBM Corporation, New York, NY, USA). The normal distribution of the data set was examined using the Skewness Test. Analysis of variance (ANOVA) was used to determine the significance of differences between knotted and clear wood samples. Linear-regression models were developed using density and MC as regressors to predict the mechanical properties of the pulpwood E. nitens
H.Deane & Maiden lumber. The coefficient of determination (R2) was used to evaluate the
significance of correlations between density, MC and the mechanical properties of the resource.
3. Results and Discussions
3.1. Basic Density and MC
The overall average MC and basic density values obtained from the tested samples are shown in Table 2. The results showed a high variation in the density of the samples with more than 239.6
kg/m3 difference between the minimum and maximum values. However, the COV (i.e., SD divided
by mean value) for density was still in the standard range at only 8.5%. Around 67% of the samples showed a density greater than 500 kg/m3. The density of the pulpwood E. nitens lumber in this study
was 9.2% higher than that of the same plantation resource (480.6 kg/m3) reported by Derikvand et al.
[13] and significantly lower than that of E. nitens lumber from native forests (670 kg/m3) indicated in
AS 2082 [22]. The correlation between MC and density of the plantation E. nitens was positive and highly significant (p < 0.00). The results indicated that the basic density could explain more than 44% of the variations in the MC values of the samples (Figure 3). The COV for the MC values within all the samples tested in this study was low at less than 4.5%.
Table 2. Average MC and basic density values.
N Minimum Maximum Mean SD
Density (kg/m3) 159 429.4 669.0 523.6 44.6
MC (%) 159 8.2 10.5 9.0 0.4
(a) (b) (c) (d) (e) (f) (g)
The results obtained were statistically analysed using IBM SPSS Statistics software (version 23, IBM Corporation, New York, NY, USA). The normal distribution of the data set was examined using the Skewness Test. Analysis of variance (ANOVA) was used to determine the significance of differences between knotted and clear wood samples. Linear-regression models were developed using density and MCas regressors to predict the mechanical properties of the pulpwoodE. nitensH.Deane & Maiden lumber. The coefficient of determination (R2) was used to evaluate the significance of correlations between density,MCand the mechanical properties of the resource.
3. Results and Discussions
3.1. Basic Density and MC
The overall averageMCand basic density values obtained from the tested samples are shown in Table2. The results showed a high variation in the density of the samples with more than 239.6 kg/m3 difference between the minimum and maximum values. However, theCOV(i.e., SD divided by mean value) for density was still in the standard range at only 8.5%. Around 67% of the samples showed a density greater than 500 kg/m3. The density of the pulpwoodE. nitenslumber in this study was 9.2% higher than that of the same plantation resource (480.6 kg/m3) reported by Derikvand et al. [13] and significantly lower than that ofE. nitenslumber from native forests (670 kg/m3) indicated in AS 2082 [22]. The correlation betweenMCand density of the plantationE. nitenswas positive and highly significant (p< 0.00). The results indicated that the basic density could explain more than 44% of the variations in theMCvalues of the samples (Figure3). TheCOVfor theMCvalues within all the samples tested in this study was low at less than 4.5%.
Table 2.AverageMCand basic density values.
N Minimum Maximum Mean SD
Density (kg/m3) 159 429.4 669.0 523.6 44.6
ForestsForests 2019,201910, 194, 10, x FOR PEER REVIEW 7 of 137 of 14
The correlation between MC and basic density.
3.2. Mechanical Properties
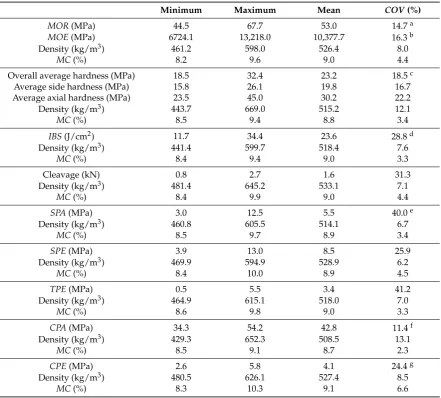
The mechanical properties along with the density and MC values of the tested samples in each treatment are given in Table 3. The results given in this table represent the properties of small clear wood samples taken from only six logs from the plantation site. The Skewness coefficient values obtained for the mechanical properties were all greater than 0.05, which indicates the normal distribution of the data set for each mechanical property. The ANOVA results for the effect of knots on the SPA, SPE and TPE of the pulpwood E. nitens lumber is given in Table 4.
The results indicated that the presence of knot at the centre line of the load axis can increase both SPA and SPE of the lumber (Table 4). The increase in the shear strength was statistically significant for SPA but insignificant for SPE of the samples. The knotted samples also were associated with high COV values in the shear strength (around 41% for both SPA and SPE). These results are in agreement with those reported by Gupta et al. [23] and Cao et al. [24] for the effect of knots on the shear strength of small clear wood samples obtained from other species. The ANOVA results also indicated that the presence of knot in the samples significantly decreased the TPE of the lumber—with the clear wood samples being 92% stronger than the knotted ones.
It must be noted that the effect of knots on the mechanical properties is variable and depends on several different parameters including the grain deviation around knots, knot size parameter and loading conditions. The effect of knots on the mechanical properties of structural size lumber therefore may not necessarily be the same as in the small clear wood samples tested in this study— which could be evaluated in future.
Table 3. The mechanical properties of the plantation E. nitens.
Minimum Maximum Mean COV (%)
MOR (MPa) 44.5 67.7 53.0 14.7 a
MOE (MPa) 6724.1 13,218.0 10,377.7 16.3 b
Density (kg/m3) 461.2 598.0 526.4 8.0
MC (%) 8.2 9.6 9.0 4.4
Overall average hardness (MPa) 18.5 32.4 23.2 18.5 c
Average side hardness (MPa) 15.8 26.1 19.8 16.7
Average axial hardness (MPa) 23.5 45.0 30.2 22.2
Density (kg/m3) 443.7 669.0 515.2 12.1
[image:7.595.203.396.85.268.2]R2 Linear = 0.448
Figure 3.The correlation betweenMCand basic density.
3.2. Mechanical Properties
The mechanical properties along with the density andMCvalues of the tested samples in each treatment are given in Table3. The results given in this table represent the properties of small clear wood samples taken from only six logs from the plantation site. The Skewness coefficient values obtained for the mechanical properties were all greater than 0.05, which indicates the normal distribution of the data set for each mechanical property. The ANOVA results for the effect of knots on theSPA,SPEandTPEof the pulpwoodE. nitenslumber is given in Table4.
The results indicated that the presence of knot at the centre line of the load axis can increase both SPAandSPEof the lumber (Table4). The increase in the shear strength was statistically significant for SPA but insignificant forSPEof the samples. The knotted samples also were associated with highCOV values in the shear strength (around 41% for bothSPAandSPE). These results are in agreement with those reported by Gupta et al. [23] and Cao et al. [24] for the effect of knots on the shear strength of small clear wood samples obtained from other species. The ANOVA results also indicated that the presence of knot in the samples significantly decreased theTPEof the lumber—with the clear wood samples being 92% stronger than the knotted ones.
It must be noted that the effect of knots on the mechanical properties is variable and depends on several different parameters including the grain deviation around knots, knot size parameter and loading conditions. The effect of knots on the mechanical properties of structural size lumber therefore may not necessarily be the same as in the small clear wood samples tested in this study—which could be evaluated in future.
Table 3.The mechanical properties of the plantationE. nitens.
Minimum Maximum Mean COV(%)
MOR(MPa) 44.5 67.7 53.0 14.7a
MOE(MPa) 6724.1 13,218.0 10,377.7 16.3b
Density (kg/m3) 461.2 598.0 526.4 8.0
MC(%) 8.2 9.6 9.0 4.4
Overall average hardness (MPa) 18.5 32.4 23.2 18.5c
Average side hardness (MPa) 15.8 26.1 19.8 16.7
Average axial hardness (MPa) 23.5 45.0 30.2 22.2
Density (kg/m3) 443.7 669.0 515.2 12.1
MC(%) 8.5 9.4 8.8 3.4
IBS(J/cm2) 11.7 34.4 23.6 28.8d
Density (kg/m3) 441.4 599.7 518.4 7.6
MC(%) 8.4 9.4 9.0 3.3
Cleavage (kN) 0.8 2.7 1.6 31.3
Density (kg/m3) 481.4 645.2 533.1 7.1
MC(%) 8.4 9.9 9.0 4.4
SPA(MPa) 3.0 12.5 5.5 40.0e
Density (kg/m3) 460.8 605.5 514.1 6.7
MC(%) 8.5 9.7 8.9 3.4
SPE(MPa) 3.9 13.0 8.5 25.9
Density (kg/m3) 469.9 594.9 528.9 6.2
MC(%) 8.4 10.0 8.9 4.5
TPE(MPa) 0.5 5.5 3.4 41.2
Density (kg/m3) 464.9 615.1 518.0 7.0
MC(%) 8.6 9.8 9.0 3.3
CPA(MPa) 34.3 54.2 42.8 11.4f
Density (kg/m3) 429.3 652.3 508.5 13.1
MC(%) 8.5 9.1 8.7 2.3
CPE(MPa) 2.6 5.8 4.1 24.4g
Density (kg/m3) 480.5 626.1 527.4 8.5
MC(%) 8.3 10.3 9.1 6.6
The suggestedCOVvalues by Wood Handbook [25]:a16%,b22%,c20%,d25%,e14%,f18% andg28%.MOE:
modulus of elasticit;MOR: modulus of rupture;COV: coefficient of variation.
Table 4.Average values ofSPA,SPEandTPEof samples with and without knot.
Sample Type Mean SD ANOVA
SPA(MPa) KnottedClear 10.45.2 1.14.3 *
SPE(MPa) KnottedClear 6.59.8 1.34.0 NS
Tensile strength (MPa)
Clear 4.6 0.9
*
Knotted 2.4 1.30
[image:8.595.78.521.566.665.2]Forests2019,10, 194 9 of 13
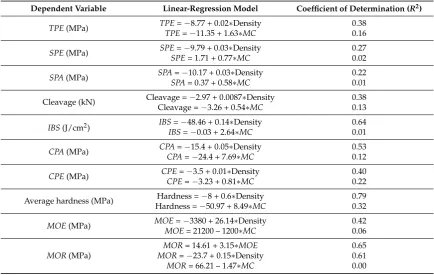
Table 5.The correlations between density,MCand mechanical properties.
Dependent Variable Linear-Regression Model Coefficient of Determination (R2)
TPE(MPa) TPE=−8.77 + 0.02∗Density 0.38
TPE=−11.35 + 1.63∗MC 0.16
SPE(MPa) SPE=−9.79 + 0.03∗Density 0.27
SPE= 1.71 + 0.77∗MC 0.02
SPA(MPa) SPA=−10.17 + 0.03∗Density 0.22
SPA= 0.37 + 0.58∗MC 0.01
Cleavage (kN) Cleavage =−2.97 + 0.0087∗Density 0.38
Cleavage =−3.26 + 0.54∗MC 0.13
IBS(J/cm2) IBSIBS=−=48.46 + 0.14−0.03 + 2.64∗Density∗MC 0.640.01
CPA(MPa) CPA=−15.4 + 0.05∗Density 0.53
CPA=−24.4 + 7.69∗MC 0.12
CPE(MPa) CPE=−3.5 + 0.01∗Density 0.40
CPE=−3.23 + 0.81∗MC 0.22
Average hardness (MPa) Hardness =−8 + 0.6∗Density 0.79
Hardness =−50.97 + 8.49∗MC 0.32
MOE(MPa) MOE=−3380 + 26.14∗Density 0.42
MOE= 21200 – 1200∗MC 0.06
MOR(MPa)
MOR= 14.61 + 3.15∗MOE 0.65
MOR=−23.7 + 0.15∗Density 0.61
MOR= 66.21 – 1.47∗MC 0.00
3.3. Failure Modes 3.3.1. Bending Samples
As the bending samples were all obtained from straight-grain, defect-free wood, the bending failure modes were relatively consistent. Two general types of failure were observed from these samples, namely, grain tension failure and combined compression and bending tension failure (Figure4).
Forests 2019, 10, x FOR PEER REVIEW 10 of 14
samples, namely, grain tension failure and combined compression and bending tension failure (Figure 4).
Figure 4. The most frequently observed failure modes of the bending test samples. Combined compression and bending tension failure (a) and grain tension failure (b).
3.3.2. Hardness Samples
As the ball bearing fixture penetrated the hardness samples, distinct differences were observed in the fibre deformations between the three different annual growth ring orientations as shown in Figure 5.
Figure 5. Fibre deformations in hardness samples with different annual growth ring orientations.
3.3.3. IBS Samples
The failure mode of the IBS samples was mainly grain tension failure. No brittle failure was observed in these samples.
3.3.4. Cleavage Samples
In all cases, the failure of the cleavage samples occurred by the separation of the wood fibres along the longitudinal axis of the samples parallel to the grain direction as shown in Figure 6.
Annual growth ring angle = 90 ⁰
Annual growth ring angle = 45 ⁰
[image:9.595.189.407.502.616.2]Annual growth ring angle = 0 ⁰
Figure 4. The most frequently observed failure modes of the bending test samples. Combined compression and bending tension failure (a) and grain tension failure (b).
3.3.2. Hardness Samples
Forests2019,10, 194 10 of 13
Forests 2019, 10, x FOR PEER REVIEW 10 of 14
samples, namely, grain tension failure and combined compression and bending tension failure (Figure 4).
Figure 4. The most frequently observed failure modes of the bending test samples. Combined compression and bending tension failure (a) and grain tension failure (b).
3.3.2. Hardness Samples
As the ball bearing fixture penetrated the hardness samples, distinct differences were observed in the fibre deformations between the three different annual growth ring orientations as shown in Figure 5.
Figure 5. Fibre deformations in hardness samples with different annual growth ring orientations.
3.3.3. IBS Samples
The failure mode of the IBS samples was mainly grain tension failure. No brittle failure was observed in these samples.
3.3.4. Cleavage Samples
In all cases, the failure of the cleavage samples occurred by the separation of the wood fibres along the longitudinal axis of the samples parallel to the grain direction as shown in Figure 6.
Annual growth ring angle = 90 ⁰
Annual growth ring angle = 45 ⁰
Annual growth ring angle = 0 ⁰
Figure 5.Fibre deformations in hardness samples with different annual growth ring orientations. 3.3.3. IBS Samples
The failure mode of theIBSsamples was mainly grain tension failure. No brittle failure was observed in these samples.
3.3.4. Cleavage Samples
In all cases, the failure of the cleavage samples occurred by the separation of the wood fibres along the longitudinal axis of the samples parallel to the grain direction as shown in Figure6.
samples, namely, grain tension failure and combined compression and bending tension failure (Figure 4).
Figure 4. The most frequently observed failure modes of the bending test samples. Combined compression and bending tension failure (a) and grain tension failure (b).
3.3.2. Hardness Samples
As the ball bearing fixture penetrated the hardness samples, distinct differences were observed in the fibre deformations between the three different annual growth ring orientations as shown in Figure 5.
Figure 5. Fibre deformations in hardness samples with different annual growth ring orientations.
3.3.3. IBS Samples
The failure mode of the IBS samples was mainly grain tension failure. No brittle failure was observed in these samples.
3.3.4. Cleavage Samples
In all cases, the failure of the cleavage samples occurred by the separation of the wood fibres along the longitudinal axis of the samples parallel to the grain direction as shown in Figure 6.
Annual growth ring angle = 90 ⁰
Annual growth ring angle = 45 ⁰
Annual growth ring angle = 0 ⁰
Figure 6.Failure modes of cleavage samples. 3.3.5. Shear Samples
The general failure modes of theSPAandSPEsamples with and without knot can be seen in Figure7. The failure mode of theSPAsamples without knot was mainly pure shear failure parallel to the grain. The failure in the knottedSPAsamples occurred along the fibre direction and was affected by the grain deviations around the knot. No failure in the knot itself was observed in these samples. The failure of theSPEsamples was completely different than that of theSPAsamples. The failure in these samples started by compression of the wood fibre perpendicular to the grain direction followed by developing cracks and separation of the wood fibres along the grain direction (Figure7). The failure mode of theSPEsamples was not affected by the presence of knot—no failure in the knot was observed.
Forests 2019, 10, x FOR PEER REVIEW 11 of 14
Figure 6. Failure modes of cleavage samples.
3.3.5. Shear Samples
The general failure modes of the SPA and SPE samples with and without knot can be seen in Figure 7. The failure mode of the SPA samples without knot was mainly pure shear failure parallel to the grain. The failure in the knotted SPA samples occurred along the fibre direction and was affected by the grain deviations around the knot. No failure in the knot itself was observed in these samples. The failure of the SPE samples was completely different than that of the SPA samples. The failure in these samples started by compression of the wood fibre perpendicular to the grain direction followed by developing cracks and separation of the wood fibres along the grain direction (Figure 7). The failure mode of the SPE samples was not affected by the presence of knot—no failure in the knot was observed.
Figure 7. Failure modes of SPE (left) and SPA (right) with and without knot.
3.3.6. Tension Samples
The failure mode of the tension samples without knot was purely tension failure along the grain direction (Figure 8). For the knotted samples all the failures occurred in the knot itself.
Figure 8. Failure modes of clear (left) and knotted (right) TPE samples.
3.3.7. Compression Samples
Three general types of failures were observed in the CPA samples under loading as shown in Figure 9. The failure modes in these samples were classified into different groups in accordance with ASTM D 143 [19], namely, combined compression and shearing parallel to grain, combined end-rolling and shearing and crushing. The failure mode of the CPE samples was typical compression failure with no obvious difference between the three annual growth ring orientations.
Forests2019,10, 194 11 of 13
3.3.6. Tension Samples
The failure mode of the tension samples without knot was purely tension failure along the grain direction (Figure8). For the knotted samples all the failures occurred in the knot itself.
Forests 2019, 10, x FOR PEER REVIEW 11 of 14
Figure 6. Failure modes of cleavage samples.
3.3.5. Shear Samples
The general failure modes of the SPA and SPE samples with and without knot can be seen in Figure 7. The failure mode of the SPA samples without knot was mainly pure shear failure parallel to the grain. The failure in the knotted SPA samples occurred along the fibre direction and was affected by the grain deviations around the knot. No failure in the knot itself was observed in these samples. The failure of the SPE samples was completely different than that of the SPA samples. The failure in these samples started by compression of the wood fibre perpendicular to the grain direction followed by developing cracks and separation of the wood fibres along the grain direction (Figure 7). The failure mode of the SPE samples was not affected by the presence of knot—no failure in the knot was observed.
Figure 7. Failure modes of SPE (left) and SPA (right) with and without knot.
3.3.6. Tension Samples
The failure mode of the tension samples without knot was purely tension failure along the grain direction (Figure 8). For the knotted samples all the failures occurred in the knot itself.
Figure 8. Failure modes of clear (left) and knotted (right) TPE samples.
3.3.7. Compression Samples
Three general types of failures were observed in the CPA samples under loading as shown in Figure 9. The failure modes in these samples were classified into different groups in accordance with ASTM D 143 [19], namely, combined compression and shearing parallel to grain, combined end-rolling and shearing and crushing. The failure mode of the CPE samples was typical compression failure with no obvious difference between the three annual growth ring orientations.
Figure 8.Failure modes of clear (left) and knotted (right)TPEsamples.
3.3.7. Compression Samples
Three general types of failures were observed in theCPAsamples under loading as shown in Figure9. The failure modes in these samples were classified into different groups in accordance with ASTM D 143 [19], namely, combined compression and shearing parallel to grain, combined end-rolling and shearing and crushing. The failure mode of theCPEsamples was typical compression failure with no obvious difference between the three annual growth ring orientations.
Forests 2019, 10, x FOR PEER REVIEW 11 of 14
Figure 6. Failure modes of cleavage samples.
3.3.5. Shear Samples
The general failure modes of the SPA and SPE samples with and without knot can be seen in Figure 7. The failure mode of the SPA samples without knot was mainly pure shear failure parallel to the grain. The failure in the knotted SPA samples occurred along the fibre direction and was affected by the grain deviations around the knot. No failure in the knot itself was observed in these samples. The failure of the SPE samples was completely different than that of the SPA samples. The failure in these samples started by compression of the wood fibre perpendicular to the grain direction followed by developing cracks and separation of the wood fibres along the grain direction (Figure 7). The failure mode of the SPE samples was not affected by the presence of knot—no failure in the knot was observed.
Figure 7. Failure modes of SPE (left) and SPA (right) with and without knot.
3.3.6. Tension Samples
The failure mode of the tension samples without knot was purely tension failure along the grain direction (Figure 8). For the knotted samples all the failures occurred in the knot itself.
Figure 8. Failure modes of clear (left) and knotted (right) TPE samples.
3.3.7. Compression Samples
Three general types of failures were observed in the CPA samples under loading as shown in Figure 9. The failure modes in these samples were classified into different groups in accordance with ASTM D 143 [19], namely, combined compression and shearing parallel to grain, combined end-rolling and shearing and crushing. The failure mode of the CPE samples was typical compression failure with no obvious difference between the three annual growth ring orientations.
Figure 9.Failure modes of theCPAsamples. (a,e) compression and shearing parallel to grain, (b,f) end-rolling and shearing, (c,d) crushing.
3.4. The COV of the Mechanical Properties
TheCOVvalues obtained from the mechanical testing of small clear wood samples in the study were compared to those provided by Wood Handbook [25] for each test as given in Table3—noCOV values are supplied by Wood Handbook [25] for cleavage,SPEandTPEtests.
to test a reasonably large sample size for each mechanical property from the different growth ring orientations (as in the sampling method in this study) and take into account the influence that the natural variations in density can have on these properties.
4. Conclusions
The aim of this study was to characterise the physical and mechanical properties of fast-growing, pulpwoodE. nitenslumber as a potential raw material for the production of mass laminated timber for structural building applications.
• A profile of physical and mechanical properties of the pulpwoodE. nitenslumber was created that can be used in future research for finite element analysis on the structural performance of any potential mass laminated timber product from such a plantation resource.
• There was a high variation in the density values of the pulpwoodE. nitenslumber that significantly influenced all the studied mechanical properties. The linear-regression models developed in the study using density as the single regressor indicated high coefficient of determinations in predicting the hardness,MOR,IBSandCPAof the lumber. The correlations between the density andTPA, cleavage,CPEandMOEof the lumber were moderate but still statistically significant. The shear strength of the lumber was less sensitive to the natural variations in the density values. • The variations in theMCof the pulpwoodE. nitenslumber after conventional kiln drying were low in each test treatment and therefore had no significant influence on the mechanical properties. • The presence of knot significantly increased the SPA and decreased the TPE of the lumber. The effect of knot on the SPE of the lumber was statistically insignificant—even though an increase in the shear strength was observed in the knotted samples.
• Considering relatively high COV values for some mechanical properties, establishing the allowable stress values of the pulpwood E. nitenslumber will require sampling and testing of small clear samples from different growth ring orientations (as used in this study) by taking into account the effect that the density can have on the results.
Author Contributions:Conceptualisation, M.D.; methodology, M.D., N.K., M.L., H.J. and G.N.; formal analysis, M.D.; investigation, M.D.; writing—original draft preparation, M.D.; writing—review and editing, M.D., N.K., M.L., H.J. and G.N.; supervision, N.K., H.J. and G.N.
Funding:This research was funded by the Australian Research Council, Centre for Forest Value, University of Tasmania, TAS, Australia, grant number IC150100004. The additional support from Forest and Wood Products Australia Limited (FWPA), Melbourne, VIC, Australia is acknowledged (Grant Number: PNB387-1516). The APC was funded by the Australian Research Council, Centre for Forest Value, University of Tasmania, TAS, Australia.
Acknowledgments:The authors are grateful of the support from Forico Pty Ltd. in providing the logs and Britton Timbers for the milling of the logs, drying and finishing of the boards.
Conflicts of Interest:The authors declare no conflict of interest.
References
1. Gilbert, B.P.; Underhill, I.D.; Bailleres, H.; El Hanandeh, A.; McGavin, R.L. Veneer based composite hollow utility poles manufactured from hardwood plantation thinned trees.Constr. Build. Mater.2014,66, 458–466. [CrossRef]
2. Gilbert, B.P.; Bailleres, H.; Zhang, H.; McGavin, R.L. Strength modelling of Laminated Veneer Lumber (LVL) beams.Constr. Build. Mater.2017,149, 763–777. [CrossRef]
3. Bal, B.C. Some technological properties of laminated veneer lumber produced with fast-growing Poplar and Eucalyptus.Maderas. Ciencia y tecnología2016,18, 413–424. [CrossRef]
Forests2019,10, 194 13 of 13
5. Lara-Bocanegra, A.J.; Majano-Majano, A.; Crespo, J.; Guaita, M. Finger-jointed Eucalyptus globulus with 1C-PUR adhesive for high performance engineered laminated products. Constr. Build. Mater. 2017,135, 529–537. [CrossRef]
6. Liao, Y.; Tu, D.; Zhou, J.; Zhou, H.; Yun, H.; Gu, J.; Hu, C. Feasibility of manufacturing cross-laminated timber using fast-grown small diameter eucalyptus lumbers.Constr. Build. Mater.2017,132, 508–515. [CrossRef] 7. ABARES. Australian forest profiles—Eucalypt. In Proceedings of the Australian Bureau of Agricultural and
Resource Economics and Sciences, Canberra, Australia, 7 March 2016.
8. Downham, R.; Gavran, M. Australian plantation statistics 2017 update. In Proceedings of the ABARES, Canberra, Australia, 20 December 2017.
9. Farrell, R.; Innes, T.C.; Harwood, C.E. Sorting Eucalyptus nitens plantation logs using acoustic wave velocity.
Aust. For.2012,75, 22–30. [CrossRef]
10. Blackburn, D.; Vega, M.; Yong, R.; Britton, D.; Nolan, G. Factors influencing the production of structural plywood in Tasmania, Australia from Eucalyptus nitens rotary peeled veneer.South. For. J. For. Sci.2018, 1–10. [CrossRef]
11. Blackburn, D.; Vega, M.Segregation of Eucalyptus Nitens Logs from Fibre-Managed Plantations for Veneer Based Engineered Wood Products; Final report; Centre for Sustainable Architecture with Wood (CSAW) School of Architecture and Design, University of Tasmania: Launceston, Australia, 2017.
12. Derikvand, M.; Nolan, G.; Jiao, H.; Kotlarewski, N. What to Do with Structurally Low-Grade Wood from Australia’s Plantation Eucalyptus; Building Application?BioResources2017,12, 4–7. [CrossRef]
13. Derikvand, M.; Kotlarewski, N.; Lee, M.; Jiao, H.; Chan, A.; Nolan, G. Visual stress grading of fibre-managed plantation Eucalypt timber for structural building applications.Constr. Build. Mater. 2018,167, 688–699. [CrossRef]
14. AS 1720.1.Timber Structures—Design Methods; Standards Australia: Sydney, Australia, 2010.
15. Yang, J.L.; Evans, R. Prediction of MOE of eucalypt wood from microfibril angle and density. Holz als Roh-und Werkstoff2003,61, 449–452. [CrossRef]
16. Chauhan, S.S.; Walker, J. Relationships between longitudinal growth strain and some wood properties in Eucalyptus nitens.Aust. For.2004,67, 254–260. [CrossRef]
17. Blackburn, D.; Hamilton, M.; Harwood, C.; Innes, T.; Potts, B.; Williams, D. Stiffness and checking of Eucalyptus nitens sawn boards: Genetic variation and potential for genetic improvement.Tree Genet. Genomes
2010,6, 757–765. [CrossRef]
18. Medhurst, J.; Downes, G.; Ottenschlaeger, M.; Harwood, C.; Evans, R.; Beadle, C. Intra-specific competition and the radial development of wood density, microfibril angle and modulus of elasticity in plantation-grown Eucalyptus nitens.Trees2012,26, 1771–1780. [CrossRef]
19. ASTM D. 143.Standard Test Methods for Small Clear Specimens of Timber; American Society for Testing and Materials (ASTM) International: Conshohocken, PA, USA, 2009.
20. Bal, B.C.; Bekta¸s, ˙I. The effects of some factors on the impact bending strength of laminated veneer lumber.
BioResources2012,7, 5855–5863. [CrossRef]
21. AS/NZS 1080.1.Timber—Methods of Test—Moisture Content; Standards Australia: Sydney, Australia, 2012. 22. AS 2082. Timber—Hardwood—Visually Stress Graded for Structural Purposes; Standards Australia: Sydney,
Australia, 2007.
23. Gupta, R.; Basta, C.; Kent, S.M. Effect of knots on longitudinal shear strength of Douglas-fir using shear blocks.For. Prod. J.2004,54, 77–83.
24. Cao, Y.; Street, J.; Mitchell, B.; To, F.; DuBien, J.; Seale, R.D.; Shmulsky, R. Effect of Knots on Horizontal Shear Strength in Southern Yellow Pine.BioResources2018,13, 4509–4520. [CrossRef]
25. Wood handbook.Wood as an Engineering Material; General Technical Report FPL-GTR-190; Department of Agriculture, Forest Service, Forest Products Laboratory: Madison, WI, USA, 2010; p. 508.