124
Letters on Materials 4(2), 2014 pp. 124-129 www.lettersonmaterials.com
Modelling of active transformation of microstructure of
two-phase Ti alloys during hot working
O.I. Bylya
1†, B.K.Pradhan
1‡, E.B.Yakushina
2, P.L.Blackwell
2, R.A.Vasin
3 †[email protected],
‡[email protected]
1Institute of Technical Education and Research Siksha ‘o’ Anusandhan University
Bhubaneswar, Odisha, India
2University of Strathclyde Renfrew, Inchinnan, UK
3Institute of Mechanis, Lomonosov Moscow State University, Moscow, Russia
Being very strong and of limited ductility, Ti alloys require special techniques to manufacture the parts with complex shapes. Many of these technologies are based on superplastic and near-to-superplastic deforming. In these processes the transformation of the microstructure of the material can be very significant and can lead to changes in the mechanical properties of the material during deformation. Because of this an appropriate description of the correlation between mechanical loading, changes in microstructure and mechanical behavior of material is required. A phenomenological scalar model with an internal variable based on a statistical description of microstructure is proposed and used for simulation of the high temperature deformation of Ti-6Al-4V alloy. The problems of obtaining the parameters of the model and sensitivity of the model to the accuracy of this process are discussed.
Keywords: constitutive modelling, simulation, superplasticity, microstructure transformation.
1. Introduction
It is established [1,2] that almost all polycrystalline materials and even ceramics are capable of showing under certain conditions a special kind of mechanical behavior called «superplasticity» (SP). Thus even materials that are of limited ductility in normal conditions can be deformed to hundreds and sometimes a few thousand percent frequently without occurrence of a localization of deformation which accelerates the process of failure. The conditions required for such behavior of materials, are usually determined experimentally and thus by nature empirical. For example, for the majority of alloys, for the maintenance of the superplastic condition it is necessary that the temperature (T) is in the order 0.4Tm or greater (where Tm- melting temperature on absolute scale), and the strain-rate lies in the range of 10–5 s-1 to 10–1 s-1 and the microstructure of the
material is fine-grained (the average size of grains ≤ 10μm) and equi-axed. However, due to the approximate nature of these constraints, it is practically impossible to say exactly when the deformation of the material becomes superplastic, and at what point during the deformation it ceases to be so. For this reason, the design of technological processes using the phenomenon of superplasticity is generally done in such a way that the entire process of deformation is carried out in the «optimal superplasticity» regime. This regime is experimentally the set of conditions, in which parameter of strain-rate sensitivity [3–5] reaches the maximum.
m
T const
=
∂
∂
=
log
log
,σ
ε
ε. (1)
Here σ and
ε
are the dimensionless stress and strain rate respectively (hence it only refers to uniaxial loading). There is even an approach of interactive change of loading condi-tions to maintain the maximum rate sensitivity during thedeformation process [6]. During optimum superplasticity, the material behaves like a viscous liquid and the flow stress can be considered to be a function of strain rate, temperature and initial grain size:
σ
=
f
( , , )
ε
T d
0 . (2)The change in microstructure of the material in this case is not significant, and its transformation to a first approximation can be neglected, taking into account only the state of the material before deformation (e.g. its initial average grain size).
In practice, maintaining the optimal conditions of superplastic deformation (SPD) in industrial processes is sometimes difficult or even impossible and, moreover, it is economically inefficient. Indeed, it is quite difficult and costly to implement the process of isothermal deformation for a long time, especially for large dimensions of the workpiece and to prepare the required original fine-grained microstructure. Low strain-rates typical for SPD make the forming process time consuming and inefficient. Due to these reasons the cases of terminating the optimal regime are coming to the stage more and more frequently. Going beyond the limits of the optimum SP happens occasionally, but currently it is often being done deliberately e.g. with increasing strain rate to speed up the process at some stage (the so-called «high strain-rate SPD»), with lowering the temperature to reduce power consumption («low-temperature SP»), or refining of an unprepared microstructure during manufacturing of the product. Such processes, where optimum superplastic conditions are violated, but the material deforms almost homogeneously without visible flow localizations or fractures till relatively high strains (compared to a conventional high- temperature deformation), are classified as «near-to-superplastic deformation».
125 occurring during deformation. It means that mechanical properties of material will significantly depend on the history of deformation e.g. see Fig. 1. From the mathematical point of view it leads to a functional nature of constitutive models describing these processes. This fact was proved by many experiments showing the dependence of mechanical behavior of the material on the history of deformation [2, 4, 9, 10]. For the ability of numerical simulation (especially FEM) of such deformation processes a special model is proposed. The purpose of this model is to consider the active transformation of the microstructure during deformation and its effect on the mechanical properties of the material. This model might approximately describe the behavior of other Titanium alloys, but the mechanisms behind most Titanium alloys are too different to be predicted by it.
2. Constitutive modelling
Description of the model
The proposed model, unlike a number of physical models [2], has a phenomenological character and will remain within continuum mechanics. To take into account active transformation of a microstructure during deformation, an additional characteristic variable will be assigned to a representative volume. This variable (η) is used to represent
the current state of the microstructure. The choice of this parameter is difficult, as microstructure transformation happens at different scale levels and mapping this is not trivial [11]. So to begin with, we use the most obvious and easily experimentally measurable parameter — the average grain size. If we are going to involve in our consideration not only a uniform fine-grained equiaxial microstructure, but also non-perfect ones like bimodal, lamellar or Widmanstätten, the direct kinetic equation for the average grain size will have only an indirect physical sense. If the microstructure simultaneously contains a mixture of grain sizes possibly with different morphology, then the micro-level mechanisms of deformation working in these grains may be also different. For each grade of grains a specific micro-model should be used. This approach will provide for the change of the average grain size some functional nature. The instantaneous change of this parameter will depend not only on current strain rate, stress, strain and temperature, but also on the current state of the microstructure.
Mathematically the approach described above will be represented using statistical methods by introducing the function of the distribution of the grain sizes. It is assumed that the representative volume contains grains of various sizes; each grain is identified only by one size — the characteristic size d. The distribution function p(d), specifies the relative volume (Vi) occupied by the grains which belong to a size range di (
d
i− ≤ < +
∆d d
i ∆2 2 ). Here all
param-eters of the model are dimensionless.
The parameter characterising a microstructure, has the physical sense of the average grain size and is defined as a probabilistic mean of distribution:
η =
∑
p d d
i⋅
i i( )
. (3)
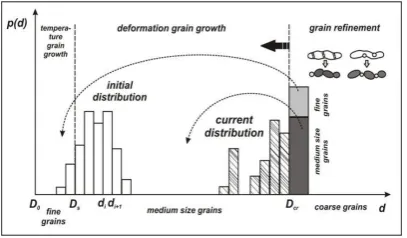
As it was mentioned above it is possible that within the volume element several mechanisms of deformation may be operating simultaneously this being dependent upon the grain size distribution within the material. Using the distribution function provides us the ability to take all of them into account. Here each physical law is applied only to the grain size for which it is relevant [1]. For example, if grains are small and globular, the basic mechanism of their growth will be slow diffusion growth (governed by temperature). For medium size grains deformation growth will be a dominating mechanism (depending on the stress and individual size of grain). When the accumulated energy of deformation increases, the grains which are bigger than some critical value (depending on the value of the strain energy) start to refine (by dislocation creep and recrystallization). This scheme is shown in the fig.2. To take this into account in the model, the modification of the size of the grains of each type is calculated with a different mathematical law. The slow temperature-dependent growth of small grains is described by the equation:
∂
∂
= ⋅
−
≤
d
t
k
Q
RT
d
D
i
i s
exp
,
, (4) [image:2.595.44.285.57.255.2]where t is the time. The limitation
d
i≤
D
s selects fine grains smaller than parameter Ds; a dimensionless combinationFig. 1. The SEM snaps of Ti-6Al-4V alloy with initial Widmanstätten microstructure after deformation of ε=0.5, ε = 10−4s−1 T=850°C
illustrating main mechanisms of microstructure transformations.
Fig. 1. The SEM snaps of Ti-6Al-4V alloy with initial Widmanstätten
microstructure after deformation of =0.5, T=850C, 104s1, illustrating
main mechanisms of microstructure transformations.
The main difference between these processes from the optimal SP is an active transformation of microstructure occurring during deformation which leads to a functional nature of constitutive models describing these processes. This fact was proved by many experiments showing the dependence of mechanical behavior of the material on the history of deformation [2, 4, 9, 10]. For the ability of numerical simulation (especially FEM) of such deforming processes a special model is proposed. The purpose of this model is to consider active transformation of the microstructure during deformation and its effect on the mechanical properties of the material. This model might approximately describe behavior of other Titanium Aluminates, but the mechanisms behind most Ti alloys are too different to be predicted by it.
II. CONSTITUTIVE MODELLING
A. Description of the Model.
The designed model, unlike a number of physical models [2], will have phenomenological character and will remain within continuum mechanics. To take into account active transformation of a microstructure during deformation, an additional characteristic variable will be assigned to a representative volume. This variable () is to be in charge of a current state of the microstructure. The choice of this parameter is difficult, as microstructure transformations happen at different scale levels and are not trivial [11]. So to begin with, we use the most obvious and easily experimentally measurable parameter - the average grain size. If we are going to involve in our consideration not only uniform fine-grained equiaxial microstructure, but also non-perfect ones like bimodal, lamellar or Widmanstätten, the direct kinetic equation for the average grain size will have very few physical sense. If microstructure simultaneously contains fine grains as well as big ones and they have different nature, micro-level mechanisms working in these grains will be also different. For each grade of grains special micro-model should be used. This approach will provide to the change of the average grain size some functional
nature. Instantaneous change of this parameter will depend not only on current strain rate, stress, strain and temperature, but also on the current state of the microstructure.
Mathematically above mentioned approach will be described by using statistical methods by introducing the function of distribution of the grain sizes. It is assumed that the representative volume contains grains of various sizes; each grain is identified only by one size - the characteristic size d. The distribution function p(d), specifies the relative volume (Vi)
occupied by the grains which belong to a size range di (
2
2
ii
d
d
d
). Here and hence all parameters of the model are dimensionless.The parameter characterising a microstructure, has physical sense of the average grain size and is defined as a probabilistic mean of distribution:
i i i
d d p( )
As it was mentioned above in the same point of material few physical mechanisms can operate simultaneously applied to different types of grains. Using the function of distribution provides us the ability to take all of them into account. Here each physical law is applied only to such types of grains for which it is obtained [1]. For example, if grains are small and globular, the basic mechanism of their growth will be slow diffusion growth (governed by temperature). For medium size grains deformation growth will be a dominating mechanism (depending on the stress and individual size of grain). When accumulated energy of deformation increases, the grains which are bigger than some critical value (depending on the value of the strain energy) start to refine (by dislocation creep and recrystallization). This scheme is shown in the Fig.2. To take it into account in the model, the modification of the sizes of the grains of each type is calculated with different mathematical law. The slow temperature-dependent growth of small grains is described by the equation:
s i
i d D
RT Q k
t
d
exp , (4)
where t=time. The limitation
d
i
D
s selects fine grains smaller than parameter Ds; a dimensionless combination [image:2.595.59.263.632.751.2]
Q
RT
involves temperature Т(absolute scale), universalFig. 2. The scheme of microstructure transformation used in the model.
126
Bylya et al. / Letters on Materials 4 (2), 2014 pp. 124-129
Q RT
(
)
involves temperature Т (absolute scale), universal gas constant R, energy of activation Q, and material constant k. Mechanism of deformation growth dominating for the medium size grains (D d
s<
i<
D
cr) was studied byresearchers and a number of models are proposed. Here the model of Perevesentsev is used [12], for which:
4 5
1 2
4 3
exp
,
1
i
i
s i cr
d
C
C
Q
t
C d
RT
D d
D
∂
=
σ + σ
⋅
−
∂
+ σ
<
<
(5)
where δ is dimensionless stress; C1, C2, C3 — parameters, which in initial model [12] represent combinations of physical constants of a material, but can be also considered as phenomenological and found from experiments.
As soon as the increments of the grain sizes are calculated, distribution function is modified accordingly:
( )
( )
( ) ,
j j i
i t t j t
d d d
i cr
p d
p d
d
D
+∆
+∆ ∈
=
<
∑
. (6)
Grains grow only until they reach some critical size Dcr, as soon they exceed it a refining process will commence. However, experimental results show, that even long lamellar grains remain unrefined if the deformation is small (e.g. in the centre of the specimen under torsion), and relatively small grains can get recrystallized at large deformations. It was also observed that at high stresses refinement is more active than at low ones. That means that the critical size Dcr is not a constant value. Here it is assumed to depend on accumulated strain energy:
The flow chat of the algorithm used for simulation of microstructure transformation.
* exp(
)
cr
D
=
D
− ⋅ σ ε
q
d
∫
(7)where D* and q> 0 — constants.
Refinement of large grains can happen due to two basic physical mechanisms: rearrangement of dislocations into dis-rearrangement of dislocations into dis-location walls and recrystallization. In the first case, some -times referred to as ‘strain assisted continuous recrystalliza-tion’ dislocations initially form low angle boundaries, which gradually convert to high angle boundaries probably facili-tated by grain boundary sliding / rotation. In the second case a nucleus of a new, undeformed, grain arises in some part of the border of a larger grain, then it grows and divides the pre-existing grain into several parts. The elementary mathemati-cal model of refinement used here is based on the assumption that all grains that exceed a critical size are refined into small and medium grains in proportion to χ / (1‑χ).
( ),
ref i i i cr
V
=
∑
p d
d
+ ∆ ≥
d
D
(8)0 0
( ) :
( )
( ) :
( ) (1
)
ref
m m ref
p D
p D
V
p D
p D
V
=
+ χ ⋅
=
+ − χ ⋅
(9)where Vref is the total relative volume of «large» grains with the sizes greater than Dcr. Parameters D0 and Dm are mean sizes of small and medium grains produced by refinement correspondingly. D0 is a fixed size for new recrystallized grains; it is assumed to be almost always the same. The size of the medium grains changes in the process of deformation because Dcr decreases and the original sizes of the grains which undergo refinement also become smaller. So Dm can be assumed to be equal to either the total average grain size from the previous time step, or as some value depending on Dcr.
To complete the phenomenological model the relation between macroscopic parameters of loading such as stress and strain rate are required. It can be taken in the form of two serial basic elements: viscoelastic and «superplastic». As a viscoelastic element the generalized body proposed by Maxwell [2] modified for the temperature can be taken, whereas the superplastic element can be taken in standard form, but involving the internal parameter η:
e v sp
ε = ε + ε + ε
, (10)exp
e v
E
RT
Q
σ
ε + ε =
+ λ ⋅σ ⋅
−
, (11)1m k
exp
sp
A
−
RT
Q
ε = σ η ⋅
−
, (12)where Е, λ, A, m and k are the constants of model.
Simulation
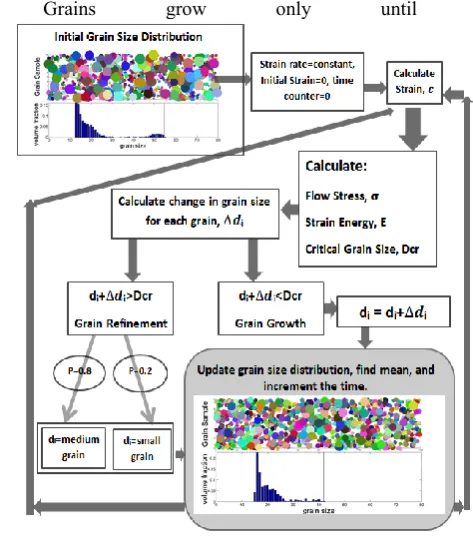
Numerical simulation of the uniaxial (tensile) loading with constant strain rate and under constant temperature was done in MATLAB. The flow chart of the algorithm used is shown in the fig.3 and the results of simulation in the fig.4.
gas constant R, energy of activation Q, and material constant k. Mechanism of deformation growth dominating for the medium size grains (DsdiDcr) was studied by researchers and a number of models are proposed. Here the model of Perevesentsev is used [12], for which:
cr i s i
i D d D
RT Q d
C C C t
d
, exp
1 4
3 5 2 4 1
where is dimensionless stress; C1, C2, C3– parameters,which
in initial model [12] represent combinations of physical constants of a material, but can be also considered as phenomenological and found from experiments.
As soon as the increments of the grain sizes are calculated, distribution function is modified accordingly:
p(di)t t dj dj (di)p(dj)t, di Dcr
Grains grow only until they
reach some critical size Dcr, as soon they exceed it refining process
starts to these grains. Experimental results show, that even long enough lamellar grains remain unbroken if deformation is small (e.g. in the centre of the specimen under torsion), and even relatively small grains can get recrystallized at large deformations. It was also observed that at high stresses refinement is more active than at low ones. That means that critical size Dcr is not a constant value. Here it is assumed to
[image:3.595.347.552.274.359.2]depend on accumulated strain energy:
Fig. 3. The flow chat of the algorithm used for simulation of microstructure
transformation.
Fig. 4. The example of the results of simulation
Dcr D*
exp(q
d
)
where D* and q> 0 - constants.
Refinement of large grains can happen due to two basic physical mechanisms: rearrangement of dislocations into dislocation walls and recrystallization. In the first case when
dislocations form a ‘
wall’, grain is getting divided into two or several grains by
them. In the second case nucleus of new grain arises in some part of the border of large grain, then it grows and also divides a
grain into few parts. The elementary mathematical model of refinement used here is based on the assumption that all grains
after exceeding critical size break into few small and medium
grains in proportion χ/(1-χ).
Vref
p(di), didiDcr
ref m
m
ref
V D
p D p
V D p D p
) 1 ( ) ( : ) (
) ( : )
( 0 0
[image:3.595.313.550.489.763.2]
127
Bylya et al. / Letters on Materials 4 (2), 2014 pp. 124-129
It can be seen from the results of simulation that the stress-strain curve obtained has hardening in the first part followed by softening with a gradually decreasing slope. Such mechanical behavior is typical for Ti alloys deformed in near-to-superplastic regimes [15]. However for practical use of this model in real technological simulations the question of experimentally obtaining the parameters of the model must be solved.
It can be seen from the results of simulation that obtained stress-strain curve has hardening in the first part and softening with gradually decreased slope at the second one. Such mechanical behavior is typical for Ti alloys deformed in near-to-superplastic regimes. However for practical use of this model in real technological simulations the question of experimental obtaining parameters of the model must be solved.
3. Finding the parameters of the model
Two parameters of the model: m — strain rate sensitivity and Q — activation energy, are the most important for the accuracy of calculations because the results of simulation are very sensitive to them. There are two main problems with obtaining these parameters from experimental data. It is assumed that they are constants for a given material, but in reality both of them strongly depend on the strain rate and temperature. The second problem is related with the
need to extrapolate experimental data from several different experiments.
m
T const=
∂
∂
=log
log
,σ
ε
ε, (13)
Q
T
const=
∂
∂
⋅
=log
( / )
,σ
ε ε1
R
m
. (14)
If experimental data is taken from different tests, and in our case several experiments with different strain rates and several experiments with different temperatures are required, the amount of data is very limited and contains certain inaccuracies.
To illustrate the problem of finding m and Q and the robustness of this process, the experimental data published in [16] were used. These experiments were conducted for the Ti alloy Ti6Al4V with a fine globular microstructure for 7 constant strain rates (0.0003, 0.001, 0.1, 1, 10 and 100s-1)
and 8 temperatures (750, 800, 850, 900, 950, 1000, 1050 and 1100°C. This range of conditions covers both superplastic as well as neighboring hot visco-plastic regimes of deforming.
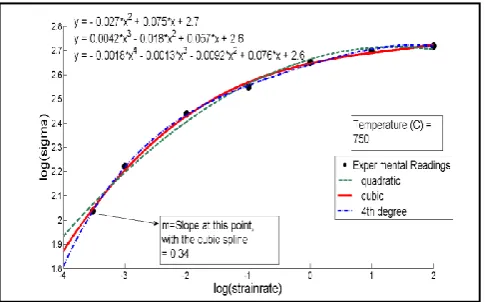
To find required parameters, the approximation of available experimental data with polynomial splines of different order was made. The example of it is shown in the fig. 5. The values of strain rate sensitivity m, obtained with interpolation of different orders are given in the tab.1. It can be seen that from 4th order the values do not change much, Fig. 4. The example of the results of simulation.
gas constant R, energy of activation Q, and material constant k. Mechanism of deformation growth dominating for the medium size grains (DsdiDcr) was studied by researchers and a number of models are proposed. Here the model of Perevesentsev is used [12], for which:
cr i s i
i D d D
RT Q d C C C t
d
, exp 1 4 3 5 2 4 1
where is dimensionless stress; C1, C2, C3– parameters,which
in initial model [12] represent combinations of physical constants of a material, but can be also considered as phenomenological and found from experiments.
As soon as the increments of the grain sizes are calculated, distribution function is modified accordingly:
, ) ( ) ( )
(d i cr
d
d j t
t t
i pd d D
d p i j j
Grains grow only until they
reach some critical size Dcr, as soon they exceed it refining process
starts to these grains. Experimental results show, that even long enough lamellar grains remain unbroken if deformation is small (e.g. in the centre of the specimen under torsion), and even relatively small grains can get recrystallized at large deformations. It was also observed that at high stresses refinement is more active than at low ones. That means that critical size Dcr is not a constant value. Here it is assumed to
[image:4.595.298.541.59.210.2]depend on accumulated strain energy:
Fig. 3. The flow chat of the algorithm used for simulation of microstructure transformation.
Fig. 4. The example of the results of simulation
DcrD*
exp(q
d)
where D* and q> 0 - constants.
Refinement of large grains can happen due to two basic physical mechanisms: rearrangement of dislocations into dislocation walls and recrystallization. In the first case when
dislocations form a ‘
wall’, grain is getting divided into two or several grains by them. In the second case nucleus of new grain arises in some part of the border of large grain, then it grows and also divides a
grain into few parts. The elementary mathematical model of refinement used here is based on the assumption that all grains
after exceeding critical size break into few small and medium
grains in proportion χ/(1-χ).
Vref
p(di), didiDcr ref m m ref V D p D p V D p D p ) 1 ( ) ( : ) ( ) ( : )
( 0 0
Mechanism of deformation growth dominating for the medium size grains (DsdiDcr) was studied by researchers and a number of models are proposed. Here the model of Perevesentsev is used [12], for which:
cr i s i
i D d D
RT Q d C C C t
d
, exp 1 4 3 5 2 4 1
where is dimensionless stress; C1, C2, C3– parameters,which
in initial model [12] represent combinations of physical constants of a material, but can be also considered as phenomenological and found from experiments.
As soon as the increments of the grain sizes are calculated, distribution function is modified accordingly:
( i)t t d d (d) ( j)t, i cr D d d p d p i j j
Grains grow only until they
reach some critical size Dcr, as soon they exceed it refining process
starts to these grains. Experimental results show, that even long enough lamellar grains remain unbroken if deformation is small (e.g. in the centre of the specimen under torsion), and even relatively small grains can get recrystallized at large deformations. It was also observed that at high stresses refinement is more active than at low ones. That means that critical size Dcr is not a constant value. Here it is assumed to
[image:4.595.46.283.59.243.2]depend on accumulated strain energy:
Fig. 3. The flow chat of the algorithm used for simulation of microstructure
transformation.
Fig. 4. The example of the results of simulation
Dcr D*
exp(q
d
)
where D* and q> 0 - constants.
Refinement of large grains can happen due to two basic physical mechanisms: rearrangement of dislocations into dislocation walls and recrystallization. In the first case when
dislocations form a ‘
wall’, grain is getting divided into two or several grains by them. In the second case nucleus of new grain arises in some part of the border of large grain, then it grows and also divides a
grain into few parts. The elementary mathematical model of refinement used here is based on the assumption that all grains
after exceeding critical size break into few small and medium
grains in proportion χ/(1-χ).
Vref
p(di), didiDcr ref m m ref V D p D p V D p D p ) 1 ( ) ( : ) ( ) ( : )
( 0 0
[image:4.595.298.541.625.756.2]Fig. 5. Approximation of the experimental data with splines of different orders for differentiation required for obtaining strain rate sensitivity.
Fig. 6. Fig. 6 Contour plot for the strain rate sensitivity Contour plot for the strain rate sensitivity m (3 m (3rd order). Fig. 7. Contour plot for the parameter Q, kJ mol-1 (4th order).
rd order)
TABLE II. VALUES OF STRAIN RATE SENSITIVITY M (3RD ORDER)
/T 0.0003 0.001 0.01 0.1 1 10 100750 0.34 0.27 0.18 0.10 0.06 0.03 0.04
800 0.38 0.32 0.23 0.15 0.09 0.05 0.03
850 0.40 0.35 0.25 0.17 0.11 0.06 0.04
900 0.48 0.41 0.31 0.21 0.14 0.08 0.03
950 0.31 0.30 0.26 0.23 0.18 0.12 0.06
1000 0.37 0.32 0.24 0.19 0.16 0.16 0.19
1050 0.20 0.24 0.28 0.27 0.22 0.12 0.02
1100 0.20 0.23 0.27 0.27 0.22 0.14 0.01
This clearly shows that both parameters significantly depend on temperature and strain rate. In FEM simulation of real technological processes temperature and strain rate can vary from one point of a workpiece to another. For equation (8) and the total model to give correct results, the parameters m and Q must be continuously verified and adjusted according to local conditions. This can be done with the help of the fields shown in Figures 6 and 7.
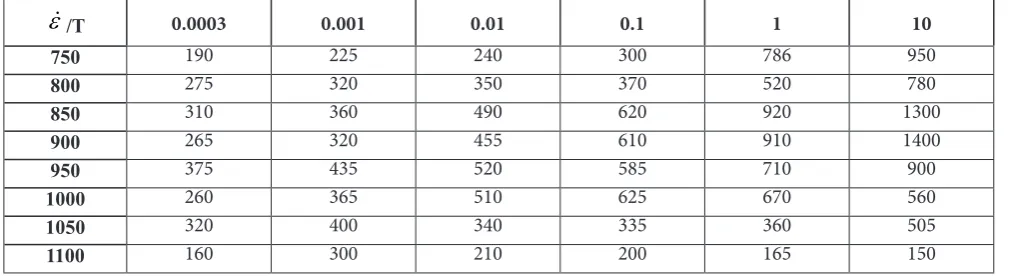
TABLE III. VALUES OF ACTIVATION ENERGY Q(IN KJ MOL-1) (3RD
ORDER)
/T 0.0003 0.001 0.01 0.1 1 10750 190 225 240 300 786 950
800 275 320 350 370 520 780
850 310 360 490 620 920 1300
900 265 320 455 610 910 1400
950 375 435 520 585 710 900
1000 260 365 510 625 670 560
1050 320 400 340 335 360 505
1100 160 300 210 200 165 150
Other parameters of the model are also important but less critical because the model is much less sensitive to them than to the above described ones. Nevertheless, the analysis of the appropriate choice of physical models and the possibilities of obtaining the parameters describing micro-mechanisms has to be investigated systematically. In this paper due to limited space these questions are not discussed.
IV. CONCLUSION
The importance of the consideration of microstructure in simulation of processes of hot forming including ones utilizing superplasticity was analyzed and a constitutive model able to take into account active transformation of microstructure was proposed. F ig.7 Cont our plot for the para meter Q, kJ mol-1 (4th order ) B eing based on a statistical approach this model can deal with several micro-mechanisms at a time. This feature is very important for two-phase alloys, especially for titanium alloys, which can have variable morphologies of microstructure.
Proposed model involves grain growth as well as refinement of the microstructure that gives the ability to describe both hardening and softening of the material. The transformation of the microstructure at every step of the simulation gives the ability to trace functional (history dependent) character of the process as well as the effect of initial microstructure on material properties.
Proposed model can be suitable for the family of + Ti alloys with similar type of microstructure and similar mechanisms of its transformation. However for other titanium alloys, e.g. the intermetallic titanium aluminides, having a fundamentally different microstructure, the choice of the microstructure parameters as well as kinetic models of their behavior must be different.
The procedure of obtaining parameters of the model from experimental data and robustness of results is discussed and an optimal method suggested.
The values of strain rate sensitivity and activation energy were calculated for different temperatures and strain rates. It was shown that these parameters significantly depend on these conditions and this must be taken into account in simulation.
The reason for higher inaccuracies pertaining to polynomials of greater degree is purely mathematical. The higher the degree of a function, the greater number of stationary points it will contain.
Simulation with the model using calculated parameters approximately matched the experimental results.
REFERENCES
[1] Kajbyshev O. A. Plasticity and superplasticity of metals. M.:Металлургия, 1975. 280p.
[2] Padmanabhan K.A., Vasin R.A. and Enikeev F.U. Superplastic flow: phenomenology and mechanics. Berlin: Springer Verlag, 2001, 430p. [3] Vasin R. A, Enikeev F.U.introduction in superplasticity mechanics. Ufa:
Publishing house "Gilem", 1998, 278p.
[4] Ghosh A.K. On the measurement of strain-rate sensitivity for deformation mechanism in conventional and ultra-fine grain
alloys//Mater. Sc. Eng. A. 2007. V.463. p. 36-40.
[5] Enikeev F.U. On the superplastic flow under non-uniform stress-strain
state//Mater. Sc. Eng. A. 2001. V.301. P. 253-254. Fig. 6 Contour plot for the strain rate sensitivity m (3rd order)
TABLE II. VALUES OF STRAIN RATE SENSITIVITY M (3RD ORDER)
/T 0.0003 0.001 0.01 0.1 1 10 100750 0.34 0.27 0.18 0.10 0.06 0.03 0.04
800 0.38 0.32 0.23 0.15 0.09 0.05 0.03
850 0.40 0.35 0.25 0.17 0.11 0.06 0.04
900 0.48 0.41 0.31 0.21 0.14 0.08 0.03
950 0.31 0.30 0.26 0.23 0.18 0.12 0.06
1000 0.37 0.32 0.24 0.19 0.16 0.16 0.19
1050 0.20 0.24 0.28 0.27 0.22 0.12 0.02
1100 0.20 0.23 0.27 0.27 0.22 0.14 0.01
This clearly shows that both parameters significantly depend on temperature and strain rate. In FEM simulation of real technological processes temperature and strain rate can vary from one point of a workpiece to another. For equation (8) and the total model to give correct results, the parameters m and Q must be continuously verified and adjusted according to local conditions. This can be done with the help of the fields shown in Figures 6 and 7.
TABLE III. VALUES OF ACTIVATION ENERGY Q(IN KJ MOL-1) (3RD
ORDER)
/T 0.0003 0.001 0.01 0.1 1 10750 190 225 240 300 786 950
800 275 320 350 370 520 780
850 310 360 490 620 920 1300
900 265 320 455 610 910 1400
950 375 435 520 585 710 900
1000 260 365 510 625 670 560
1050 320 400 340 335 360 505
1100 160 300 210 200 165 150
Other parameters of the model are also important but less critical because the model is much less sensitive to them than to the above described ones. Nevertheless, the analysis of the appropriate choice of physical models and the possibilities of obtaining the parameters describing micro-mechanisms has to be investigated systematically. In this paper due to limited space these questions are not discussed.
IV. CONCLUSION
The importance of the consideration of microstructure in simulation of processes of hot forming including ones utilizing superplasticity was analyzed and a constitutive model able to take into account active transformation of microstructure was proposed. F ig.7 Cont our plot for the para meter Q, kJ mol-1 (4th order ) B eing based on a statistical approach this model can deal with several micro-mechanisms at a time. This feature is very important for two-phase alloys, especially for titanium alloys, which can have variable morphologies of microstructure.
Proposed model involves grain growth as well as refinement of the microstructure that gives the ability to describe both hardening and softening of the material. The transformation of the microstructure at every step of the simulation gives the ability to trace functional (history dependent) character of the process as well as the effect of initial microstructure on material properties.
Proposed model can be suitable for the family of + Ti alloys with similar type of microstructure and similar mechanisms of its transformation. However for other titanium alloys, e.g. the intermetallic titanium aluminides, having a fundamentally different microstructure, the choice of the microstructure parameters as well as kinetic models of their behavior must be different.
The procedure of obtaining parameters of the model from experimental data and robustness of results is discussed and an optimal method suggested.
The values of strain rate sensitivity and activation energy were calculated for different temperatures and strain rates. It was shown that these parameters significantly depend on these conditions and this must be taken into account in simulation.
The reason for higher inaccuracies pertaining to polynomials of greater degree is purely mathematical. The higher the degree of a function, the greater number of stationary points it will contain.
Simulation with the model using calculated parameters approximately matched the experimental results.
REFERENCES
[1] Kajbyshev O. A. Plasticity and superplasticity of metals.
M.:Металлургия, 1975. 280p.
[2] Padmanabhan K.A., Vasin R.A. and Enikeev F.U. Superplastic flow: phenomenology and mechanics. Berlin: Springer Verlag, 2001, 430p. [3] Vasin R. A, Enikeev F.U.introduction in superplasticity mechanics. Ufa:
Publishing house "Gilem", 1998, 278p.
[4] Ghosh A.K. On the measurement of strain-rate sensitivity for deformation mechanism in conventional and ultra-fine grain
alloys//Mater. Sc. Eng. A. 2007. V.463. p. 36-40.
[5] Enikeev F.U. On the superplastic flow under non-uniform stress-strain
[image:4.595.43.277.625.757.2]128
Bylya et al. / Letters on Materials 4 (2), 2014 pp. 124-129
which may imply that highest-possible order (6th) would lead
to the most accurate results. But higher order polynomial approximations are more sensitive to the inaccuracy of input data and results of calculations are thus less robust.
To check this, randomized error of 10 % was introduced to initial experimental data (to the value of stress), this depicts the actual accuracy limit of majority of high temperature mechanical tests. Obtained results and their deviation from the original ones are also listed in tab.1. These results show that increasing the order of polynomial order from 4 to 6 increases the sensitivity to inaccuracies almost twice. So for all further calculations 4th order polynomial approximations were used.
Using these experimental data [16] and approximations which were found to be optimal, the values of strain rate sen-sitivity m and activation energy Q were calculated for differ-ent temperatures and strain rates. Obtained results are given in the tabs. 2 and 3, and the fields of these values are show in the fig.6.
This clearly shows that both parameters significantly depend on temperature and strain rate. In FEM simulation of real technological processes temperature and strain rate can vary from one point of a workpiece to another. For equation (8) and the total model to give correct results, the parameters m and Q must be continuously verified and adjusted according to local conditions. This can be done with the help of the fields shown in figs.6 and 7.
Other parameters of the model are also important but less critical because the model is much less sensitive to them than to the above described ones. Nevertheless, the analysis of the appropriate choice of physical models and the possibilities of obtaining the parameters describing micro-mechanisms has to be investigated systematically. In this paper due to limited space these questions are not discussed.
Degree of Interpolation Original Value
(v1) Value with random-error in log(sigma) (v2)
v1-v2
(Sensitivity) random error Value with in log(sigma)
(v3)
v1-v3 (Sensitivity)
Quadratic 0.25 0.26 0.01 0.211 0.039
Cubic 0.30 0.29 0.01 0.273 0.027
4th Degree 0.35 0.28 0.07 0.385 0.035
5th Degree 0.36 0.16 0.2 0.410 0.050
[image:5.595.55.561.402.540.2]6th Degree 0.35 0.18 0.17 0.415 0.065
Table 1
The dependance of strain rate sensitivity parameter to the order of polynomial interpolation and accuracy of input data
ε
/T 0.0003 0.001 0.01 0.1 1 10 100750 0.34 0.27 0.18 0.10 0.06 0.03 0.04
800 0.38 0.32 0.23 0.15 0.09 0.05 0.03
850 0.40 0.35 0.25 0.17 0.11 0.06 0.04
900 0.48 0.41 0.31 0.21 0.14 0.08 0.03
950 0.31 0.30 0.26 0.23 0.18 0.12 0.06
1000 0.37 0.32 0.24 0.19 0.16 0.16 0.19
1050 0.20 0.24 0.28 0.27 0.22 0.12 0.02
1100 0.20 0.23 0.27 0.27 0.22 0.14 0.01
Table 2
Values of strain rate sensitivity m (3rd order)
ε
/T 0.0003 0.001 0.01 0.1 1 10750 190 225 240 300 786 950
800 275 320 350 370 520 780
850 310 360 490 620 920 1300
900 265 320 455 610 910 1400
950 375 435 520 585 710 900
1000 260 365 510 625 670 560
1050 320 400 340 335 360 505
1100 160 300 210 200 165 150
Table 3
129
4. Conclusion
The importance of the consideration of microstructure in simulation of processes of hot forming including ones utilizing superplasticity was analyzed and a constitutive model able to take into account active transformation of microstructure was proposed.
Being based on a statistical approach this model can deal with several micro-mechanisms at a time. This feature is very important for two-phase alloys, especially for titanium alloys, which can have variable morphologies of microstructure.
Proposed model involves grain growth as well as refinement of the microstructure that gives the ability to describe both hardening and softening of the material. The transformation of the microstructure at every step of the simulation gives the ability to trace functional (history dependent) character of the process as well as the effect of initial microstructure on material properties.
Proposed model can be suitable for the family of α+β Ti alloys with similar type of microstructure and similar mechanisms of its transformation. However for other titanium alloys, e.g. the intermetallic titanium aluminides, having a fundamentally different microstructure, the choice of the microstructure parameters as well as kinetic models of their behavior must be different.
The procedure of obtaining parameters of the model from experimental data and robustness of results is discussed and an optimal method suggested.
The values of strain rate sensitivity and activation energy were calculated for different temperatures and strain rates. It was shown that these parameters significantly depend on these conditions and this must be taken into account in simulation.
The reason for higher inaccuracies pertaining to polynomials of greater degree is purely mathematical. The higher the degree of a function, the greater number of stationary points it will contain.
Simulation with the model using calculated parameters approximately matched the experimental results.
The work carried out is partly supported by Russian Fund of Basic Research (RFBR 11‑08‑00961).
References
1. O. A. Kajbyshev. Plasticity and superplasticity of metals. M.:Metallurgia. (1975) 280 p.
2. K. A. Padmanabhan, R. A. Vasin and F. U. Enikeev. Superplastic flow: phenomenology and mechanics. Berlin: Springer Verlag. (2001) 430 p.
3. R. A. Vasin, F. U. Enikeev. Introduction in superplasticity mechanics. Ufa: Publishing house «Gilem». (1998) 278 p. 4. A. K. Ghosh. Mater. Sc. Eng. A. 463, 36 (2007).
5. F. U. Enikeev. Mater. Sc. Eng. A. 301, 253 (2001).
6. G. C. Wang, M. W. Fu. J. Mater. Proc. Tech. 192–193, 555 (2007).
7. T. Seshacharyulu, S. C. Medeiros, W. G. Frazier, Y. V. R. K. Prasad. Mater. Sc. Eng. A. 325, 112 (2002).
8. S. Venugopal, P. V. Sivaprasad. Proceedings of the International Conference on Recent Advances in Material Processing Technology (RAMPT ‘05). National Engineering College. Kovilpatti. India. (2005) P.41–56. 9. N. Ridley, P. S. Bate,B. Zhang. Mater. Sc. Eng. A. 463(1-2),
224 (2007).
10. S. S. Bhattacharya, O. I. Bylya, R. A. Vasin and K. A. Padmanabhan. Mechanics of Solids. 44(6), 951 (2009).
11. A. K. Ghosh and R. Raj. Acta Metall. 34(3), 447 (1986). 12. S. A. Larin, V. N. Perevezentsev. PMM. 9, 14 (1990). 13. W. B. Lee, H. S. Yang, Y. W. Kim, A. K. Mukheriee. Scripta
Metallurgica et Materialia. 29, 1403 (1993).
14. S. Guillard, M. Thirukkonda, P. K. Chaudhury, in: I., R. Srinivasan, P. Bania, D. Eylon, S. L. Semiatin (Eds.). Advances in the Science and Technology of Titanium Alloy Processing. TMS. Warrendale. PA. (1997) p. 93. 15. O. I. Bylja, R. A. Vasin, A. V. Muravlev, P. V. Chistjakov,
A. G. Ermachenko, M. V. Karavaeva. Scripta Materialia, 36(8), 949 (1997).