Diagnostics and prognostics utilising dynamic Bayesian networks
applied to a wind turbine gearbox
Charles E Plumley, Graeme K Wilson, Andrew D Kenyon and Dr Francis Quail Centre for Advanced Condition Monitoring, University of Strathclyde
Glasgow, G4 0TD, United Kingdom 0141 548 2324
Dr Athena Zitrou
Department of Management Science, University of Strathclyde Glasgow, G4 0TD, United Kingdom
Abstract
The UK has the largest installed capacity of offshore wind and this is set to increase significantly in future years. The difficulty in conducting maintenance offshore leads to increased operation and maintenance costs compared to onshore but with better condition monitoring and preventative maintenance strategies these costs could be reduced. In this paper an on-line condition monitoring system is created that is capable of diagnosing machine component conditions based on an array of sensor readings. It then informs the operator of actions required. This simplifies the role of the operator and the actions required can be optimised within the program to minimise costs. The program has been applied to a gearbox oil testbed to demonstrate its operational suitability. In addition a method for determining the most cost effective maintenance strategy is examined. This method uses a Dynamic Bayesian Network to simulate the degradation of wind turbine components, effectively acting as a prognostics tool, and calculates the cost of various preventative maintenance strategies compared to purely corrective maintenance actions. These methods are shown to reduce the cost of operating wind turbines in the offshore environment.
1.
Introduction
The UK Government has agreed to a legally binding target for renewable energy consumption of 15% by 2020 (1). To achieve this target the UK has set world leading targets for the installation of offshore wind power generation capacity. The UK already has the largest installed capacity of offshore wind with a predicted 18GW by 2020 and prospects of up to 40GW by 2030 (2). The deployment of large scale arrays of offshore wind turbines, particularly for the UK Round 3 sites, is extremely challenging.
ensure that offshore wind turbine availability is underpinned by appropriate asset operation and management supported by next generation condition monitoring.
Current levelised cost of energy for offshore wind is ~£140-170/MWh. The industry aims to reduce this to £100/MWh through a variety of approaches: reduced manufacture and installation costs (economies of scale), increased output (increased availability) and reduced operating costs (3). This paper focusses on condition monitoring to reduce the levelised cost of energy, as this has previously been shown to be economically beneficial for wind turbines (4).
If condition monitoring can predict failures, and specific details about the failure mode can be obtained, this facilitates planning of preventative maintenance that can avoid expensive corrective actions. However, false alarms would lead to additional costs, so it is important that the system be both reliable and robust. One method to achieve this is to use multiple sensor readings and combine them to determine the likely condition of different components.
In this paper a Bayesian Belief Network (BBN) is used for diagnostics to determine the condition of machine components. A case study involving a wind turbine gearbox is used to demonstrate the approach in Section 3.2. This involves on-line real-time condition monitoring of the gearbox with a traffic light system to prompt the operator to act as required. LabVIEW (5) was used to develop this and a gearbox oil test bed was used for demonstration purposes. A method for system prognostics is also described in this paper, expanding on the case study of the wind turbine gearbox and the Bayesian Network framework.
Dynamic Bayesian Networks (DBNs) are an extension of Bayesian Networks that allows prognostics – the prediction of the future machine condition – to take place (6). As well as predicting failures and identifying failure modes, this paper proposes that DBNs can be used to assess the economic incentive for maintenance. GeNIe (7), a software tool capable of simulating Dynamic Bayesian Networks, is used as a proof of concept tool to verify this.
The statistical basis behind BNNs, DBNs and data fusion is given in Section 2. The programme developed for condition monitoring and its application to a wind turbine gearbox are described in Section 3. Section 4 describes the use of Dynamic Bayesian Networks for prognostics and their use in determining suitable maintenance strategies, again the wind turbine gearbox is used as a case study. A Discussion and Conclusion are at the end of the paper.
2.
Theory
2.1 Bayesian Belief Networks
BBNs are graphical models, based on Bayes‟ Rule which show the probabilistic relationships between a set of variables (10,11,12). BBNs are a tool for reasoning under uncertainty. They are often used in maintenance modelling for analysing new evidence which describe the state of the system. There are applications of BBNs in medical diagnosis, cardiovascular risk assessment, genetic modelling and many other fields
(6,13,14)
.
[image:3.595.228.372.302.351.2]Bayesian networks have become popular as a framework for reasoning under uncertainty since they were introduced in the mid-1980s (15). BBNs are comprised by nodes that represent the variables of the model and arcs that represent assertions of conditional independence. BBNs can be used to assess the probability of failure of a system and identify the most probable cause of failure.
Figure 1. BBN of an observation O, and a variable X
A simple fictitious example of a BBN is shown in Figure 1 for illustrative purposes. Note that the BBN does not represent any conditional independence assertions. This BBN can be used to represent the dependence between the state of the system and some indicator of its condition. The system contains observation O, and variable X; the state of X can only be observed through O. To quantify the model, one needs to determine the probability of X being in a given state P(X), and the probability of an observation O, given the state of variable X, P(O|X).
2.2 Dynamic Bayesian Networks
DBNs can be used to model a system over a finite number of discrete time slices. A DBN is formed by interconnecting BBNs over time slices, in doing this it can model the evolution of a system over time. When a system is of an order n, it means that the state of the observation at time t, Ot, is influenced by the variable states Xt, Xt-1, ...,Xt-n. This
is the case if the variable is part of a process, like machine degradation for example. A DBN can be seen as a Hidden Markov Model where the hidden state is comprised of a set of variables with a given (in)dependency structure.
DBNs are capable of recognising transient sensor failures (16). For example if Otand Ot-2 have observed a High state and Ot-1 has shown a Low state, the DBN can be programmed to reason that this series of observations is very unlikely and that it is more likely that there has been a sensor failure. It would therefore decide what state variable
X is in effectively ignoring the second observation (Ot-1).
As DBNs are temporal models, they can be used in basic inference tasks (16):
variable X, in the present (P(Xt|O1:t)).
Prediction – using historical observations to predict the state of the variable at a
defined point in the future k (P(Xt:k|O1:t)).
Smoothing or Hindsight – using present and past evidence to get an accurate
definition of the state of a variable at a point in the past u (P(Xu|O1:t)) when 0 ≤ u ≤ t.
Most Likely Explanation – The likely sequence of states which have generated a
sequence of observations (argmaxx1:t (P(X1:t|O1:t)).
Filtering, Smoothing and Most Likely Explanation have the potential to be used in diagnosis, while Prediction may be used in prognosis (17).
2.3 Data Fusion
BBNs have been shown to be a useful tool for evidence combination (18). Here we look at a specific case of combining data from different sensors using Bayes‟ rule (10). Data fusion is performed via the determination of the posterior distributions given the states of the sensor variables. Within a BBN, this updating is performed by taking advantage of the (in)dependence structure between variables. Thus, BBNs allow for the propagation of evidence within the model structure to update the belief on the state of the system.
The assumption of conditional independence – i.e. given the state of the system the information obtained from one sensor is independent of the information obtained from another sensor – often holds true. In which case the probability of a system being in state A given sensor readings Qi is:
( | ( ( ( ( |
| ( ̅ ( | ̅ ……….(2)
When conditional independence cannot be guaranteed or does not hold true, for example with sensor readings of viscosity and temperature of gearbox oil to determine the gearbox condition, alternative methods such as joint probability distributions for the sensors may be used.
3.
DiagnosticsDiagnostics determine the current health status of the system. Bayesian Belief Networks have been successfully used on system diagnosis in the past (18). Here we demonstrate on a gearbox oil testbed a flexible program capable of sensor fusion.
3.1 Implementation
The program developed takes real-time sensor readings and from these make an analysis of the likely condition of the component being monitored. This allows an operator to understand quickly the actions required rather than being presented with many, sometimes conflicting, sensor outputs.
components is important as each system will vary, and the program allows this to be done due to its modular design.
The condition of the component being monitored is classified in one of three states, following a traffic light system: Green, Amber, Red. This allows the operator to decide quickly whether action is required.
The component condition is recorded continuously and the time-series plotted graphically so that the operator can see if the likely component condition is changing. Suggested actions are displayed to the operator and these are based on a cost analysis using a DBN of various scenarios. Current actions are restricted to “perform maintenance” and “shutdown the machine” but these are just exemplars.
In addition to monitoring the likely component condition the program created is capable of detecting erroneous sensor readings. The erroneous readings are calculated by comparing the sensor‟s prediction of the likely component condition with that of the average prediction. A large root mean square error from the average is considered unlikely and a signal warns the operator that the sensor should be checked. With more sensors, this method becomes increasingly reliable. With only a few sensors it is unclear which, if any, is at fault.
If the component enters a state in which action is required all relevant data leading up to that time is saved and from then on streamed to file until the component returns to a normal operating state. This allows detailed analysis of the data at a later date to better understand the development of faults and can be used to retrain the probability density functions (PDFs) if required.
3.2 Case study
The LabVIEW model developed was applied to a wind turbine gearbox to assess its use on a practical level. It was decided to monitor the condition of the gearbox through an analysis of its oil as this provides a good indicator of component conditions (19). Sensor readings were taken of oil temperature, iron content and viscosity.
3.2.1 Asset state
A traffic light system was adopted to allow a user to quickly identify machine condition and react quickly. Green depicts normal operation, Amber indicates maintenance is required, and Red suggests a failure is imminent. Each of these states are represented as a skewed Gaussian PDF. For the purposes of this test, the PDF parameters during normal operation and following oil degradation were derived from Original Equipment Manufacturer best practice and the IS0 4406 standard (20).
3.2.2 Observations
A major indicator of gearbox condition is the gearbox lubricant (18). Lubrication and oil is applied across the gearbox to different components to ensure optimum performance. Lubrication reduces friction, and in contact machinery friction degrades efficiency.
components wear down, particles are liberated and become suspended in the lubrication
(21)
. These particles can be analysed by monitoring the electromagnetic properties of the oil (22). Gearbox lubricants are designed to contain additives that ensure the gearbox operates efficiently (23). A change in chemical composition, due to liberated particles, would therefore adversely affect the performance of the gearbox. By monitoring the gearbox oil‟s iron content and temperature, the state of certain gearbox components can be determined and these replaced as required.
3.2.2.1 Iron
The compositions of gearbox components vary from component to component (19). Iron is an element which commonly features in gearbox components, it can therefore be inferred that an increase in ferrous particles is due to increased wear of a gearbox component. Condition monitoring sensors can observe iron particles in the lubricant by using Electromagnetic Detection (EMD). An inductive coil measures the change in magnetic flux as the oil flows through the sensor. Metals have a higher conductivity than oil; consequently there is an increase in current proportional to the quantity and type of material detected (19).
3.2.2.2 Temperature
Fluctuations in oil temperature can be due to a number of factors. An increase in oxidation of the lubricant can cause it to become more acidic; this can lead to more corrosion of components and a change in viscosity as a consequence of thermal degradation. Thermal degradation can also cause the additives in the lubricant to become unstable and less efficient, reducing the gearbox performance and increasing wear (18). An increase in temperature is therefore a clear indication of a failure somewhere within the system.
Thermocouple sensors can be used to monitor the temperature of the oil. It is assumed in this example that there is a negligible loss of heat as the oil flows from the component to its sample point.
3.2.3 Gearbox Component: bearing
The majority of failures in a wind turbine gearbox appear to start in the bearings (24). This is due to the bearings being unable to cope with large fluctuations in load and the changes in direction of load. Therefore this case study focusses on the condition of the bearing within the gearbox.
A test-bed suitable for this demonstration circulates the oil with controls for temperature and flow rate, pressure and viscosity are all measured, and an inductive particle detection unit has been installed to detect ferrous and non-ferrous particles.
The test-bed allows seeding of the oil with particles to represent bearing or gear-tooth wear and control of the temperature of the oil and its flow rate can also be manipulated to simulate various failure modes and test new sensor equipment.
the system.
3.2.4 Application
Testing of the Bayesian Belief Network approach was done by simulating failure modes by adjusting the temperature and particles in the oil.
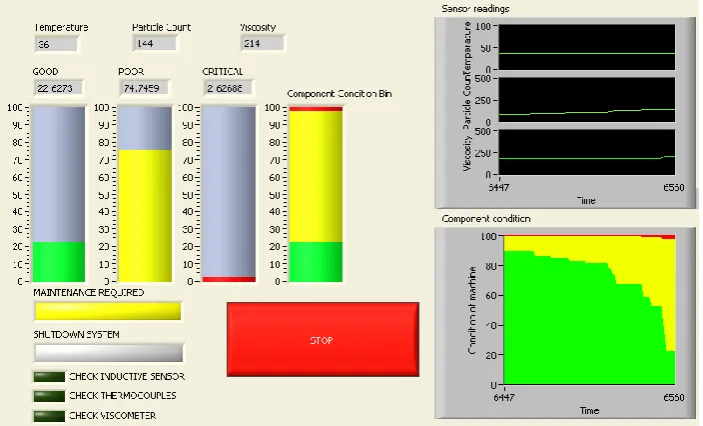
[image:7.595.123.475.262.475.2]Prior to seeding of the particles the Bayesian inference program predicted the gearbox component to be in a Green operating state. As particles were seeded into the system the component condition was seen to be deteriorating. This is recorded in the program and is visible in the graph recording the component condition in Figure 2. As the component entered an abnormal condition the program suggests to the operator that maintenance be performed on the gearbox component.
Figure 2. Deteriorating component condition within the Bayesian inference program, alarm suggesting maintenance be performed
As more particles were seeded into the oil eventually a critical state was reached. The suggested action from the program is to shut-down the system to avoid further damage followed by maintenance being performed.
Additionally a sensor warning was shown, suggesting the thermocouple sensor be checked. The reason for this is during the simulation the viscosity and particle count were manipulated to create the appearance of a failure mode occurring, however the temperature of the oil was left unrealistically low. This anomalous reading is therefore recognised by the program and highlighted to the operator.
The deterioration curve gives the operator a clear signal of developing faults and the traffic light system employed allows operators to make instant critical decisions.
3.3 Summary
offshore wind turbines is of particular interest. The nature of the program lends itself to remote locations in a number of ways. It is uploaded to the hardware supervising the gearbox and can therefore be monitored remotely through a network connection. It can detect faulty sensors which will reduce significantly the number of false alarms, and allow maintenance crews to check for or replace what it responsible when routine maintenance is performed; and it makes detailed records only when the system is not operating as expected, this aids with future diagnostics without overloading the network or user at times when data is not needed.
4.
Prognostics & Maintenance StrategiesThis paper proposes DBNs for prognostics. The potential of this work is shown through a case study analogous to the one conducted in the previous section using GeNIe. GeNie is a software tool specifically designed for creating, representing and analysing DBNs. However, it cannot directly represent PDFs and is not suitable for real-time input. It is used here for illustrative purposes.
4.1 Case study
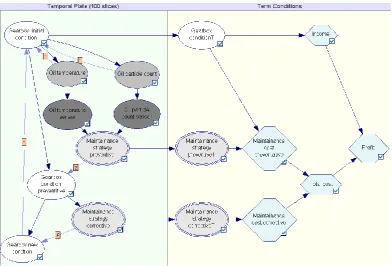
[image:8.595.102.495.436.702.2]The Dynamic Bayesian Network is applied to the same case as in the previous section. The aim of this study is to provide information to the on-line system to determine when maintenance is best conducted. The model includes sensor reliability, corrective as well as preventive maintenance, and a cost analysis section to determine the best maintenance strategy. The DBN developed using knowledge and example data provided by industrial partners, is shown in Figure 3.
The degradation of the gearbox bearing influences the condition monitoring readings, i.e. the temperature of the oil and particle count, as described in Section 3.1. Viscosity is derived from temperature readings and so degradation as a result of changing viscosity is included in the temperature reading in this example.
High oil temperature and particle count increase the degradation rate of the gearbox and so these variables are fed back into the gearbox condition in the next time slice. Preventive maintenance is conducted on the basis of the sensor readings, whereas corrective maintenance is conducted only when the gearbox bearings fail. It is assumed that the both corrective and preventive maintenance return the bearings to the same level, however the cost both as regards to time and money are considered greater for corrective maintenance. This is in addition to the cost of repairs dependent on the state of the component as preventative action cannot be planned for in advance, which is of particular importance when dealing with structures that are offshore.
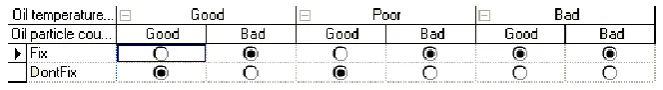
[image:9.595.90.525.381.500.2]The cost analysis is based on the steady state conditions of the gearbox and the maintenance strategy being followed. A base case where no preventive maintenance is performed is compared with the optimal preventive condition based maintenance strategy in Figure 4. The optimum maintenance strategy is shown in Figure 5. As well as improving the overall condition of the gearbox the preventative maintenance strategy increases profit by avoiding expensive corrective maintenance costs.
Figure 4. GeNIe DBN analysis without conducting preventative maintenance (left) and while conducting optimal preventive condition based maintenance (right)
[image:9.595.131.463.583.628.2]5.
ConclusionOffshore wind turbine operators would benefit considerably from the use of intelligent systems approaches and techniques. In particular it has been shown that Bayesian Belief Networks and Dynamic Bayesian Belief Networks may be used for diagnostics and prognostics, as well as planning maintenance strategies.
The LabVIEW program demonstrates how Bayesian Belief Networks can be used to effectively create a real-time condition monitoring system. A simulated failure mode was effectively recognised by the program as well as an anomalous sensor reading. The modular design of the program also allows new modules to be attached and modifications to be made with ease. Its design is also applicable offshore, where data extraction may be limited or restricted at times.
The program in GeNIe demonstrates the ability to model systems and to optimise maintenance based on cost – establishing that, within the models parameters, preventative condition based action can reduce operation and maintenance costs offshore.
It is especially relevant now with the rapid deployment in offshore wind associated costs that condition based monitoring is employed, as it has been shown here to increase the availability of the turbines, reduce costly corrective maintenance and simplify the job of the operator.
Acknowledgments
This work was funded by the EPSRC through the Wind Energy Systems Doctoral Training Centre at the University of Strathclyde.
The hardware for the gearbox testbed was sponsored by National Instruments and Mobil SHC.
References
1. House of Lords, European Union Committee, „The EU‟s Target for Renewable Energy: 20% by 2020‟, HL Paper 175–I, 27th Report of Session 2007–08.
2. Department of Energy and Climate Change, „UK Renewable Energy Roadmap‟, July 2011.
3. Renewable UK, „Offshore wind forecasts of future costs and benefits‟, June 2011. 4. F Besnard, J Nilsson, L Bertling, „On the economic benefits of using Condition
Monitoring Systems for maintenance management of wind power systems‟, Probabilistic Methods Applied to Power Systems (PMAPS), IEEE 11th International Conference, pp 160-165, 14-17 June 2010.
5. National Instruments Coporation, „LabVIEW: Getting Started with LabVIEW‟, June 2010.
Conference on Industrial Engineering and Engineering Management (IEEM), pp 1155-1159, 2009.
7. M J Druzdzel, „SMILE: Structural Modeling, Inference, and Learning Engine and GeNIe: a development environment for graphical decision-theoretic models‟, AAAI-99 Proceedings, American Association for Artificial Intelligence, 1999. 8. P M Lee, Bayesian Statistics: an Introduction 2nd Edition. London, UK: Arnold,
1997.
9. J H Sigurdsson, L A Walls and J L Quigley, „Bayesian belief nets for managing expert judgement and modelling reliability‟, Quality and Reliability Engineering International, Vol 17, pp 181-190, 2001.
10. P-S Laplace, „A Philosophical Essay on Probabilities‟, 1902.
11. F V Jensen, T D Nielsen, Bayesian Networks and Decision Graphs, Second Edition, Springer, 2007
12. J Pearl, „Bayesian networks‟, UC Los Angeles: Department of Statistics, 2000 13. H Langseth, L Portinale, „Bayesian networks in reliability‟, Reliability Engineering
& System Safety‟, Vol 92, Issue 1, pp 92-108, January 2007.
14. H Boudali, J B Dugan, „A discrete-time Bayesian network reliability modeling and analysis framework‟, Reliability Engineering & System Safety, Vol 87, Issue 3, March, pp 337-349, 2005.
15. C P Robert, The Bayesian Choice, New York, Springer, 2001.
16. S J Russel, P. Norwig, Artificial Intelligence: a modern approach, Upper Saddle River, N.J., Prentice Hall, 2010.
17. A K S Jardine, L Daming and D Banjevic, „A review on machinery diagnostics and prognostics implementing condition-based maintenance‟, Mechanical Systems and Signal Processing, Vol 20, pp1483-1510, 2006.
18. V M Catterson and S D J McArthur, „Using evidence combination for transformer defect diagnosis‟, International Journal of Innovations in Energy Systems and Power , 2006.
19. A Hamilton and F Quail, „Detailed State of the Art Review for the Different Online/Inline Oil Analysis Techniques in Context of Wind Turbine Gearboxes‟, J. Tribol., Vol 133, Issue 4, 044001 (18 pages), October 2011.
20. International Organization for Standardization, „ISO 4406 - Hydraulic fluid power - Fluids - Method for coding the level of contamination by solid.‟
21. L A Toms, Machinery Oil Analysis - Methods, Automation & Benefits 3rd Edition, STLE, Virginia Beach, 2008.
22. C J Crabtree, „Survey of Commercially Available Condition Monitoring Systems for Wind Turbines‟, Durham University, 2010.
23. M J Neale, Lubrication and Reliability Handbook, Bristol, J W Arrowsmith Ltd, 2001.