Rentizelas, Athanasios A. and Tolis, Athanasios I. and Tatsiopoulos, Ilias P. (2014) Optimisation and investment analysis of two biomass-to-heat supply chain structures. Biosystems Engineering, 120. pp. 81-91. ISSN 1537-5110 , http://dx.doi.org/10.1016/j.biosystemseng.2013.07.012
This version is available at https://strathprints.strath.ac.uk/44917/
Strathprints is designed to allow users to access the research output of the University of Strathclyde. Unless otherwise explicitly stated on the manuscript, Copyright © and Moral Rights for the papers on this site are retained by the individual authors and/or other copyright owners. Please check the manuscript for details of any other licences that may have been applied. You may not engage in further distribution of the material for any profitmaking activities or any commercial gain. You may freely distribute both the url (https://strathprints.strath.ac.uk/) and the content of this paper for research or private study, educational, or not-for-profit purposes without prior permission or charge.
Any correspondence concerning this service should be sent to the Strathprints administrator: [email protected]
The Strathprints institutional repository (https://strathprints.strath.ac.uk) is a digital archive of University of Strathclyde research outputs. It has been developed to disseminate open access research outputs, expose data about those outputs, and enable the
Optimization and Investment Analysis of two Biomass-to-Heat Supply
Chain Structures
Athanasios A. Rentizelas 1, Athanasios I. Tolis 2, Ilias P. Tatsiopoulos 3
Sector of Industrial Management and Operational Research, School of Mechanical Engineering,
National Technical University of Athens,
9 Iroon Polytechniou str., GR-15780 Zografou, Athens, Greece
1Corresponding author: Athanasios Rentizelas; 9 Iroon Polytechniou Str., Zografou, 15780, Athens, Greece; Tel: +30-210-7722383; Fax: +30-210-7723571; E-mail address: [email protected]
Abstract
As oil prices have risen dramatically lately, many people explore alternative ways of heating their residences and businesses in order to reduce the respective cost. One of the options usually considered nowadays is biomass, especially in rural areas with significant local biomass availability. This work focuses on comparing two different biomass energy exploitation systems, aiming to provide heat at a specific number of customers at a specific cost. The first system explored is producing pellets from biomass and distributing them to the final customers for use in domestic pellet boilers. The second option is building a centralized co-generation (CHP) unit that will generate electricity and heat. Electricity will be fed to the grid, whereas heat will be distributed to the customers via a district heating network. The biomass source examined is agricultural residues and the model is applied to a case study region in Greece. The analysis is performed from the viewpoint of the potential investor. Several design characteristics of both systems are optimized. In both cases the whole biomass-to-energy supply chain is modeled, both upstream and downstream of the pelleting/CHP units. The results of the case study show that both options have positive financial yield, with the pelleting plant having higher yield. However, the sensitivity analysis reveals that the pelleting plant yield is much more sensitive than that of the CHP plant, therefore constituting a riskier investment. The model presented may be used as a decision support system for potential investors willing to engage in the biomass energy field.
Keywords: Optimization, Pelleting, Co-generation, Biomass, Investment analysis.
1Corresponding author: Athanasios Rentizelas; 9 Iroon Polytechniou Str., Zografou, 15780, Athens, Greece; Tel: +30-210-7722383; Fax: +30-210-7723571; E-mail address: [email protected]
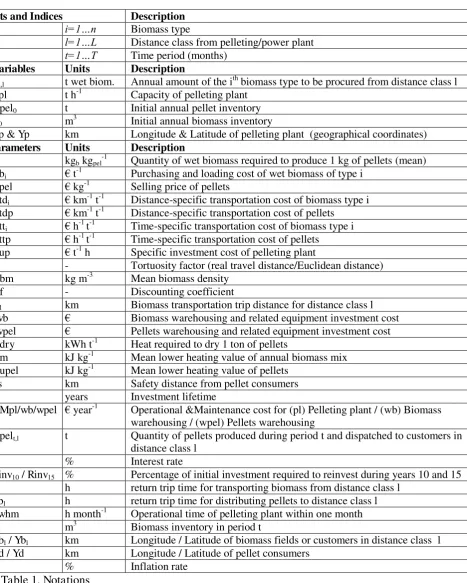
Table 1. Notations
1. Introduction
Biomass is a renewable energy source that has been used by mankind since ancient years. Lately, biomass has gained significant attention, due to the necessity of reducing CO2
emissions and the technological improvements in biomass energy conversion. In addition, biomass use has been favoured by the recent increase in oil prices, leading many people to
Sets and Indices Description
i i=1…n Biomass type
l l=1…L Distance class from pelleting/power plant
t t=1…T Time period (months)
Variables Units Description
Bi,l t wet biom. Annual amount of the i th
biomass type to be procured from distance class l Ppl t h-1 Capacity of pelleting plant
Qpel0 t Initial annual pellet inventory
V0 m
3
Initial annual biomass inventory
Xp & Yp km Longitude & Latitude of pelleting plant (geographical coordinates)
Parameters Units Description
A kgb kgpel -1
Quantity of wet biomass required to produce 1 kg of pellets (mean) Cbi € t
-1
Purchasing and loading cost of wet biomass of type i Cpel € kg-1 Selling price of pellets
Ctdi € km -1
t-1 Distance-specific transportation cost of biomass type i Ctdp € km-1 t-1 Distance-specific transportation cost of pellets
Ctti € h-1 t-1 Time-specific transportation cost of biomass type i
Cttp € h-1 t-1 Time-specific transportation cost of pellets Cup € t-1 h Specific investment cost of pelleting plant
d - Tortuosity factor (real travel distance/Euclidean distance) Dbm kg m-3 Mean biomass density
Df - Discounting coefficient
Dl km Biomass transportation trip distance for distance class l
Iwb € Biomass warehousing and related equipment investment cost Iwpel € Pellets warehousing and related equipment investment cost Hdry kWh t-1 Heat required to dry 1 ton of pellets
Hm kJ kg-1 Mean lower heating value of annual biomass mix Hupel kJ kg-1 Mean lower heating value of pellets
Ls km Safety distance from pellet consumers N years Investment lifetime
OMpl/wb/wpel € year-1 Operational &Maintenance cost for (pl) Pelleting plant / (wb) Biomass warehousing / (wpel) Pellets warehousing
Qpelt,l t Quantity of pellets produced during period t and dispatched to customers in
distance class l
r % Interest rate
Rinv10 / Rinv15 % Percentage of initial investment required to reinvest during years 10 and 15
Tl h return trip time for transporting biomass from distance class l
Tpl h return trip time for distributing pellets to distance class l
Twhm h month-1 Operational time of pelleting plant within one month
Vt m
3
Biomass inventory in period t
Xbl / Ybl km Longitude / Latitude of biomass fields or customers in distance class l
explore alternative means of heating their residences and businesses in order to reduce the respective cost.
Several biomass types currently have alternative use (for example in the paper and pulp industry, as animal feedstock and bedding etc.), whereas others do not. Usually agricultural residue biomass types belong to the second category. In many cases, agricultural residue biomass is either not exploited or in some cases is burned in the fields, as it can be hazardous for cultivations if left to decay. Tree prunings are one example, which is also used in this work. Prunings is a woody type of biomass, which means it is suitable for use in most types of biomass processing and energy conversion equipment. Furthermore, the fact that it does not currently have significant alternative use means that it may be procured at lower prices than commercial biomass types.
There exist various systems for generating energy from biomass. Lately, pellets from biomass have been extensively used worldwide (USDA, 2009). In Greece, pellets have also started being produced and are currently used in small quantities, but with a high rate of increase (Karkania et al., 2012). Pellets are a densified form of biomass with very low moisture, increased energy content, easy to handle, store and transport and have the advantage that their specifications can be standardised. For these reasons, using pellets for heating has seen dramatic increase over the last years.
Another option for biomass energy generation that has found many applications, particularly in northern Europe, is the centralised Combined Heat and Power (CHP) generation. This option has the advantage that biomass may be used to produce simultaneously electricity and heat. Electricity can be sold to the grid, usually at a premium price, due to the renewable nature of biomass, and heat can be used for industrial, commercial or domestic heating. However, transferring the heat to the final consumers usually entails investing in a district heating pipeline and distribution network.
The two abovementioned options can be used to address the heating needs of the same consumers. However, the respective supply chains have significant differences. The main difference among the two options is that in the pellets case, the production is disengaged from the demand, since pellets can be stored. In the CHP case heat has to be generated when demanded, as it cannot be stored in significant quantities and for a long time period.
The primary purpose of this work is to examine comparatively the two different above mentioned energy supply chain options, for addressing the same heating needs, in regions with significant availability of currently unutilised agricultural biomass sources. The comparison is performed from the scope of a potential investor willing to engage in the business of renewable energy generation. The question of finding the most appealing investment from the two options while satisfying the same heating needs with the same cost for the customers is to be answered here.
2. Literature review
2.1 Biomass energy recovery and biomass supply chain
Energy recovery from biomass has been extensively researched in past (Mitchell et al., 1995) and in more recent studies (Rentizelas et al., 2010). The issue of biomass energy recovery is closely linked to biomass supply chain modeling. Various models concerning the supply chain of biomass have been published. The case of biomass-fired plants, producing combined heat and power (CHP) has been researched in Tatsiopoulos and Tolis (2003), whilst the case of energy tri-generation has been investigated in the study of Rentizelas et al. (2010). Moreover, CHP projects, realized in agricultural areas, have revealed the potential benefit of
decentralized bioenergy generation (Pantaleo et al. 2009). Several authors have included the bioenergy conversion facility modeling in their supply chain models, generating electricity and/or heat. The results from using two biomass-to-electricity conversion technologies were compared in Caputo et al. (2005), concluding that 56–76% of the total system operational costs are due to the biomass logistics, thus indicating the potential for cost reduction.
The concept of the exploitation of multiple biomass feedstocks has recently emerged, providing interesting alternatives to conventional single-biomass sourcing strategies (Rentizelas et al. 2009a, Rentizelas et al. 2009b). Apart from the logistical analysis, the aforementioned studies investigated the need for optimizing the entire supply chain and the location of bioenergy facilities, using complex optimization algorithms. A linear
programming (LP) optimization model has been presented (Cundiff et al., 1997) to optimize a cost function including the biomass logistics activities between the on-farm storage locations and the centrally located power plant, construction and expansion costs of storage facilities, as well as the cost of violating storage capacity or lost revenue in case of biomass deficit. A GIS-based model to estimate the potential for electricity production from multiple agricultural residues was developed in Voivontas et al. (2001). In a similar vein, a techno-economic
assessment of a biomass power plant was performed in Papadopoulos and Katsigiannis (2002), using a mixture of several biomass types. The authors focused mainly on reducing the
biomass logistics costs and more specifically on eliminating biomass warehousing needs by performing a two-stage optimization: firstly, the CHP power plant location was determined to minimize the transportation distance and secondly, dynamic programming optimization was employed to identify the optimum biomass fuel mix. Finally, a combination of GIS,
mathematical modelling and optimization for energy supply at a regional level from forest biomass was presented in Freppaz et al. (2004).
2.2 Pellet production
Pellet production is an interesting option for potential investors. In general, pellet is
In general, pellets are a more efficient fuel source compared to raw biomass, due to their physical and chemical properties (Carrol and Finnan, 2012). Pellets may also be used for handling the by-products of other biofuels, like ethanol, as analyzed in the study of Tumuluru et al. (2010). The effect of process variables like die temperature and feed moisture content on the pellet properties (pellet moisture content, durability and pellet density) was explored in this study using a single pelleting machine.
3. Model
This work aims to compare two biomass-to-energy supply chains. In order to perform this comparison, the supply chain structures are optimized. The first supply chain concerns collecting biomass to produce pellets, which are then distributed to consumers for domestic heat generation. The second supply chain concerns using the same biomass sources in a co-generation unit to generate electricity and heat. Electricity will be fed to the grid, whereas heat will be distributed via a district heating network for residential use. To have a common basis of comparison, both systems are designed to be demand-driven, meaning that their target is to supply heat to the same number of final customers. The systems are optimized in financial yield terms from the viewpoint of a potential investor. The optimization criterion is the maximization of the Profitability Index of the investment, which has been chosen to remove the obstacle of the significantly different investment cost required for the two cases.
An effort has been made to use boundaries for the systems examined as similar as possible. This means that the biomass logistics are included in the study for both systems, from the point of loading biomass to the transportation vehicles and downstream. In-field agricultural operations are not included in the model. As far as the supply chain downstream of the
pelleting/CHP plant is concerned, in the case of pellets the investor is assumed to provide and distribute the final product (pellets) to the consumers’ door, whereas in the case of CHP the system included in the cost analysis extends up to the final customers’ metering point. The model allows the use of multiple fuel sources. In both cases the use of agricultural biomass residues in the form of various tree prunings has been considered, due to the fact that this type of biomass seldom finds an alternative use and that it is a wood biomass, which is compatible with the existing pelleting and CHP technologies available.
In the case of the pelleting plant, its monthly production is determined by the minimum between a) the hourly capacity of the plant multiplied by the operational hours per month (equal to 600 hours) and b) the amount of raw biomass available in the warehouse. The CHP plant generates exactly the appropriate amount of heat required each month. It should be noted the CHP plant consists of a main base-load co-generation unit and a boiler used to cover the peak-load heat demand.
The multi-fuel concept is adapted from the multi-biomass model of Rentizelas et al. (2009a). The model presented in Rentizelas et al. (2009a) has been adapted and used for the case of the CHP plant. The model used for the pelleting case is analysed in detail below. The
optimization method applied in both models is a hybrid optimization method presented in Rentizelas et al. (2010).
3.1 Objective Function.
The objective function to be maximized is the Profitability Index (PI) of the investment for
chain of pellets (distribution). In the CHP model case the CHP plant, the district heating network with the connection to the customers and the electricity transmission line and connection to the grid are also included. All operational costs are taken into account. The function to be maximized for the pelleting plant is:
investment M O income PV PV PV
MaxPI & (1)
Where (2) Df OMwpel OMwb OMpl CttpTp CtdpD Qpel T Ctt D Ctd B Cb B PV
i t l
l l l t l l i l i l i i l i l i M O
,
,( )
,( ) & (3) Iwpel Iwb r Rinv r Rinv Cup PplPVinvestment
) ) 1 1 ( ) 1 1 ( 1
( 15 15
10 10 (4) l Yb Yp Xb Xp d
Dl [( l) ( l) ]
2
2 (5)
L l ili B i
B
1
, (6)
Equation (2) refers to the Present Value (PV) of the revenue stream of the investment, which is pellet sales. Equation (3) refers to the PV of the operational and maintenance costs and equation (4) to the PV of investment and future reinvestment costs. It should be noted that the investment lifetime has been assumed to be 20 years in both cases to perform a fair
comparison. Due to the fact that some categories of equipment of the pelleting plant have an expected lifetime of 10 or 15 years (Mani et al., 2006), a reinvestment has been included in the total investment cost. The reinvestment for the 15-year lifetime equipment has been only proportionally considered for the remaining operational life of the pelleting plant. All the annual monetary amounts are multiplied by an appropriate discounting coefficient Df, which turns them into present values, assuming that the annual amounts will be increased by the inflation rate that will remain fixed for the investment’s lifetime:
r r Df N ] ) 1 ( ) ( 1 [ 1 (7)
3.2 Optimization Variables.
The optimization problem variables are the following:
• Xp & Yp: The optimum location (geographical coordinates) of the facility.
• Ppl: The capacity of the pelleting plant.
• Bi: The total amount of the ith biomass type to be procured each year.
• V0: The initial annual biomass inventory.
• Qpel0: The initial annual pellet inventory.
Df Qpel Cpel PV t t income
The last two variables are necessary, as the calculations are based on a rolling yearly horizon framework, in the same vein to Cundiff et al. (1997).
3.3. Constraints.
Various constraints have been introduced in the mathematical formulation of the problem. The first constraint requires that there should be enough biomass collected to produce the pellets corresponding to the annual heat demand of the customers, plus the extra amount of biomass required as a fuel source to perform the drying process during pelleting. Mani et al. (2006) have examined the effect of various fuel options for the drying process and concluded that the most cost-efficient method is to use wet biomass, which is in line with the assumption made here:
t t t
t Hupel Hdry Qpel
V Dbm
Hm (1000 3600 ) (8)
Additionally, there should always be a biomass safety stock in the warehouse to allow full capacity pellet production for a certain time period, here assumed to be equal to one fourth of a month, to allow the pelleting plant to continue operation in the event of a temporary biomass logistics disruption, e.g. because of extreme weather conditions:
t A Twhm Ppl
Dbm
Vt 0,251000 (9)
The warehousing space required for biomass (in both cases) and for pellets (in the pelleting case) is determined by the maximum monthly inventory divided by the stockpiling height (assumed 6m for biomass and 3m for pellets), allowing an extra 10% free warehouse space for moving the inventory. The warehouse is assumed to be a low cost solution of a pole-frame structure with a metal roof. However, in the CHP plant case, a certain amount of biomass should be kept in a more sophisticated closed warehouse with drying infrastructure using dumped heat from the plant, to reduce biomass moisture to acceptable levels before energy generation (Rentizelas et al., 2009b).
Two more constraints are introduced, due to the rolling horizon of the model: The finishing season biomass stock (VT) must be at least as much as the starting season stock (V0). The same
applies for the pellets stock:
0
V
VT (10)
0
Qpel
QpelT (11)
Due to the fact that industrial activity is not usually desirable in inhabited areas, a constraint has been added that the pelleting plant should be located at least at a safety distance (Ls) away
from the customers’ location (Xd, Yd), to avoid potential local opposition:
Ls Yd
Yp Xd
Xp 2 2
) (
)
( (12)
Finally, all the independent variables are required to be non-negative and upper bounds are also defined for many of them. For example, the annual amount of biomass used is bounded by the maximum available quantity of this type (maxBil) in the distance class l under
examination:
l i B Bil max il ,
0 (13)
4. Case study
types of agricultural residue biomass are locally available. In this work, only tree prunings have been considered as raw material for pellet production or CHP generation (Table 2), despite the fact that they are not the dominant cultivations in the region. These biomass sources are characterised by seasonality, arising from time restrictions due to the primary product agricultural operations. The district energy customer will be the local community of Ampelonas of about 1900 households, from which about 1000 households have been assumed to be willing to receive either heat from the CHP plant or pellets from the pelleting plant. The investor could either be a private entity or a regional authority, and no subsidies of any kind have been included in the case study.
1.Olive tree prunings
2.Almond tree prunings
3.Apple tree prunings
4. Peach tree prunings
5.Pear tree prunings
6.Cherry tree prunings
Biomass yield (t ha-1)a 2,54 5,59 4,29 5,05 15,23 4,60
Density wet biomass (kg m-3) 300 300 300 300 300 300
Moisture wet (%)a 35 40 40 40 40 40
Lower Heating Value (MJ kgwet
-1
)a 13,018 12,845 12,377 13,625 12,536 13,391
Availability period Nov-Feb Dec-Feb Dec-Feb Feb-Apr Dec-Feb Dec-Feb
Residue price (€ twet-1)b 60 60 60 60 60 60
a
Source: Voivontas et al. (2001), including assumption of 90% biomass availability for biomass yield
b
[image:9.595.70.504.225.354.2]Biomass price includes purchasing and loading cost, prices assumed equal to those of forest wood biomass.
Table 2: Characteristics of biomass types used
The revenue sources of the CHP facility under consideration are electricity sales to the national grid and heat supply to the customers via a district heating network. The electricity will be supplied directly to the national grid, at prices fixed by a long-term contract, due to the renewable nature of the electricity generated. The pelleting plant will only receive income from pellet sales. The price of heat sold by the CHP plant has been calculated based on the lower end of commercial pellet price in the region, assuming that domestic pellet boilers will have an average efficiency of 90%. Therefore, the real heating cost will be the same for the final consumers in either case. Most of the agricultural biomass types included in the study have no current alternative use; it is thus assumed that they may be procured at prices similar to those of forest wood biomass. Some of the most important parameter values used for the case study are presented in Table 3.
Pelleting plant CHP plant
Interest rate (%) 10
Inflation (%) 2
Electricity selling price (€ MWh-1) - 201,25
Pellet selling price (€ t-1) 280
Oil price (€ kg-1) 1,40
Electricity price for pelleting plant/district heating (€
kWh-1) 0,15
Investment lifetime (yr) 20
Electrical efficiency of CHP unit (%) - 29
Total efficiency of CHP unit (%) - 85
Thermal efficiency of domestic pellet boiler (%)e 90 -
Pellet lower heating value (kWh kg-1) 5,3
Operational time (h yr-1) Max 7200 When heat is demanded
Investment cost of reference plant (€ t-1h)/(€ kW
el-1) 308000d 2000
Capacity of reference plant (t h-1)/(kWel) 6d 2000
Scaling factor 0,75a 0,7
O&M of CHP unit (% inv.cost yr-1) - 7
O&M of biomass boiler (% inv.cost yr-1) - 3 Maintenance of pelleting plant (% inv.cost yr-1)b 2,8 -
Personnel cost of pelleting plant (€ tpellets-1)c 12,43 -
Investment cost of pelleting for Building, Packing &
Misc. (€ tpellets-1)c 1,19 -
O&M of pelleting for Building, Packing & Misc.
including bag consumables (€ tpellets-1)c,d
7,55 -
a
Weighted average for all equipment from Sultana et al. (2010)
b
Weighted average for all equipment from Mani et al. (2006)
c
Source: Mani et al. (2006), values adjusted to € of 2010
dSource: Sultana et al. (2010), values adjusted to € of 2010 e
[image:10.595.102.512.70.257.2]Source: Verma et al. (2011)
Table 3. Main case study input data
5. Results and discussion
The optimum values of the variables found by the optimization model for both cases
examined and the financial criteria values are presented in Table 4 and Table 6 respectively.
Pelleting CHP
Installed Capacity Co-generation (kWheat) - 6480
Installed Capacity Boiler (kWheat) - 6165
Installed Capacity Pelleting Plant (t h-1) 0,948 - Biomass 1 - Olive tree prunings (t yr-1) 2731 2734 Biomass 2 - Almond tree prunings (t yr-1) 223 724 Biomass 3 - Apple tree prunings (t yr-1) 712 0 Biomass 4 - Peach tree prunings (t yr-1) 1512 1512 Biomass 5 - Pear tree prunings (t yr-1) 4201 0 Biomass 6 - Cherry tree prunings (t yr-1) 1484 10323 Total Biomass Collected (t yr-1) 10864 15294 Initial biomass inventory (m3 at end September) 6778 11704 Initial pellet inventory (t at end September) 3084 - Longitude of CHP/Pelleting plant (km HGRS 87) 359,015 359,050 Latitude of CHP/Pelleting plant (km HGRS 87) 4397,438 4397,646 Table 4. Optimum solution
The facility locations lie very close to one another and are both located on the lower bound of the proximity constraint of the model (equal to 2 km), obviously in order to reduce the
distribution logistics cost for the pelleting case and the district heating pipeline investment cost and energy losses for the CHP case.
significance of each biomass type, Table 5 presents the radius from the respective plant within which biomass will be collected. It should be mentioned that the maximum allowable
collection distance has been assumed equal to 40 km. From Table 5 one may notice that the available quantities of olive and peach tree prunings are fully utilised. The reason is that using these two biomass sources has the logistical advantage of extending the collection period, therefore reducing significantly the biomass storage needs.
1.Olive tree prunings
2.Almond tree prunings
3.Apple tree prunings
4. Peach tree prunings
5.Pear tree prunings
6.Cherry tree prunings
Pelleting 40 14 4 40 8 10
[image:11.595.65.510.168.222.2]CHP 40 28 0 40 0 18
Table 5. Maximum distance of biomass procurement (km)
Pelleting CHP
Profitability Index 6,03 2,95
NPV (106€) 6,51 19.96
IRR 0,64 0,32
Simple Pay Back Period (yr) 1,83 4,02 Total Investment (106€) 1,30 10,22 Table 6. Financial criteria for the optimum solution
The financial criteria of Table 6 suggest that both investment options are attractive, having a Profitability Index greater than one and positive Net Present Value (NPV). However, the Profitability Index, which is the optimization criterion, is much higher for the pelleting plant case. Despite the fact that the NPV of the CHP plant is about three times higher, the
significantly higher investment cost required (about eight times higher than the pelleting plant) favours the pelleting plant investment option. The investment analysis based on the Internal Rate of Return and Simple Payback Period criteria confirms the conclusions reached by the Profitability Index.
It is also interesting to analyse the income and cost streams of the investment. In Table 7, the income sources of the cases examined are presented together with the annual amount of the respective energy products. The income from heat sales is practically the same as pellets sales. However, in the case of the CHP plant there exists an extra revenue stream from electricity sales, which corresponds to a value higher than heat sales.
Amount Value (106€ y-1)
Electricity - CHP plant 13724 MWhel 2,76
Heat - CHP plant 33300 MWhheat 1,95
[image:11.595.73.324.679.765.2]Pellets - Pelleting Plant 6823 t 1,91
Table 7. Products and Income analysis for the optimum solution
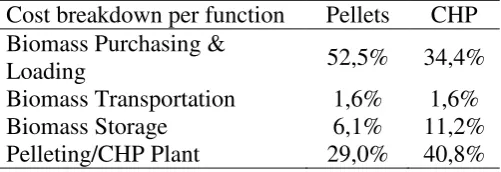
Cost breakdown per function Pellets CHP Biomass Purchasing &
Loading 52,5% 34,4%
Biomass Transportation 1,6% 1,6%
Biomass Storage 6,1% 11,2%
Pellets Storage 5,4% - Pellets Distribution 5,4% -
Heat Distribution - 10,4%
Electricity Transmission - 1,6% Cost breakdown in
investment & operation Pellets CHP
Investment 10,7% 39,4%
[image:12.595.71.324.69.194.2]Operational 89,3% 60,6%
Table 8. Cost analysis for the optimum solution
Table 8 shows a significantly different cost structure for the two investments. First of all, the CHP plant itself entails a significantly higher investment cost, reaching 39,4% of the total system cost in the projects’ lifetime, whereas the respective value for the pelleting plant is only 10,7%. If further analysed, the CHP plant requires a higher biomass storage cost and a significant cost for the heat distribution infrastructure. The increased biomass storage cost of the CHP plant does not result from higher inventory but from the requirement for a more sophisticated warehouse construction with drying infrastructure, for a specific amount of the biomass inventory. On the other hand, the pelleting plant requires an extra cost for product (pellet) storage and distribution. The biomass transportation is a minor cost in both cases, due to the limited travel distances required. Biomass purchasing and loading cost is more than half the total system cost for pelleting, and is the second most important cost factor for the CHP case.
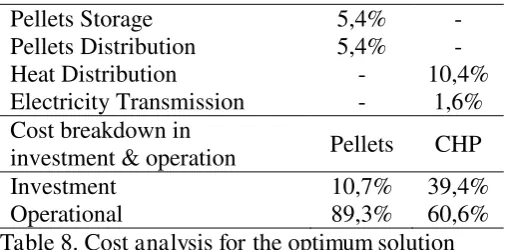
In Figure 1, the inventory profile for biomass and pellets is presented. The peak of the inventory profile determines the storage space requirements in each case, due to the
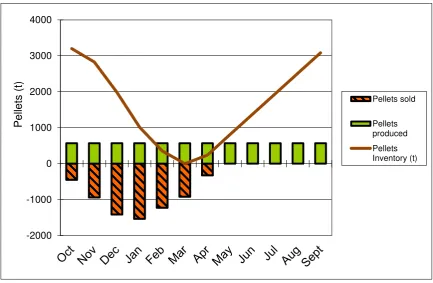
assumption that dedicated storage space will be used. Biomass inventory is increased steeply during the period of biomass availability, whereas pellet inventory reaches its minimum almost at the end of the heating period. It is very interesting to note that the pelleting plant has been sized to operate in full capacity the whole year, in order to reduce the investment cost and increase the utilisation of equipment, as can be also seen from Figure 2. Therefore, pellets are produced at a fixed rate and are stored when demand is less than production rate. This operational strategy leads to minimum investment cost, which explains the low contribution of investment cost to the total lifetime cost. On the other hand, the heat-match mode operation of the CHP plant means that equipment is utilized only when heat is required by the
Figure 1. Biomass & Pellets inventory
Figure 2. Pellet production rates, sales rates and inventory
6. Sensitivity analysis
Most parameters included in the model have a degree of uncertainty. Therefore, a sensitivity analysis of the optimum solution found has been performed in relation to the most important
0 5000 10000 15000 20000 25000 30000
Inv
en
tory
(
m
3)
Biomass & Pellets Inventory
Raw Biomass (CHP) (m3)
Raw Biomass (for Pelleting) (m3) Pellets (m3)
-2000 -1000 0 1000 2000 3000 4000
P
el
lets
(t
)
Pellets sold
Pellets produced
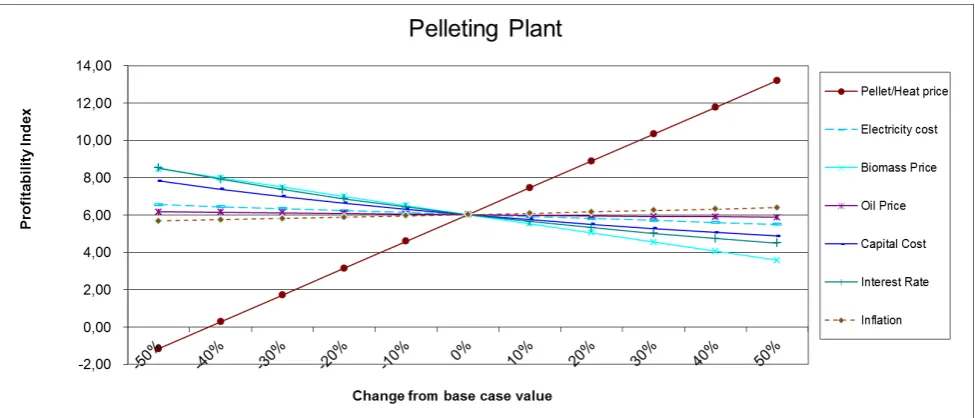
[image:13.595.70.504.391.674.2]parameters. Each parameter has been changed within the range of ±50% from the base-case value, in steps of 10%, and the resulting change in the Profitability Index of the investment is presented in Figure 3 for the pelleting plant and in Figure 4 for the CHP plant.
Figure 3. Sensitivity analysis for the pelleting plant
The Profitability Index of the Pelleting plant investment is very sensitive to changes in the pellet price. A reduction of pellet price in excess of about 35% will lead to negative yield of the investment (PI <1). On the other hand, an increase on pellets price may lead to even higher yield of the investment, if the raw biomass cost remains fixed. However, raw biomass price is the most influential cost factor, and therefore care should be taken to secure its price with long-term contracts if possible. From Figure 3, it can be seen that even a change in biomass price up to 50% will not render the investment infeasible, but will reduce the
Figure 4. Sensitivity analysis for the CHP plant
The CHP plant investment yield is mostly sensitive to the prices of electricity. In the sensitivity analysis, it has been assumed that the electricity selling price to the grid will
change proportionally to the electricity buying price from the grid, which is used primarily for the district heating network operation. It should be noted though that the price for renewably generated electricity is currently regulated by law with long-term fixed price contracts.
Therefore, it is expected that this parameter will not pose any significant risk for the investors. The investment yield is also substantially sensitive to changes in the heat selling price, though the sensitivity is significantly lower than in the pelleting plant case. The capital cost and interest rate are the two most significant cost factors affecting the investment yield.
Sensitivity on biomass price is lower but still significant, whereas sensitivity on oil price and inflation is almost negligible.
Comparing the sensitivity analyses of the two different investment options, one may infer that the CHP plant is significantly less sensitive in price changes of the energy products generated than the pelleting plant. The latter has much higher yield under the base case parameter values, but the former benefits from simultaneous production of two energy products, therefore
securing the investment yield in the case of significant price changes on either of the products. The pelleting plant is thus characterised as a more risky investment, as a reduction of more than 25% in the pellets and heat price will render the CHP plant a more attractive solution. Evenmore, a 35% decrease of pellets and heat price leads to a negative yield for the pelleting plant, while the CHP plant is still an attractive option. Finally, changes in the capital cost affect significantly the CHP investment yield, due to the high initial investment required, whereas biomass purchasing price affects mostly the pelleting plant investment yield, due to the lower value product generated.
7. Conclusions
pelleting plant supply chain, both upstream and downstream. The system simulated is optimized in terms of basic design characteristics (location of the facility and capacity of the plant) as well as operational parameters (amounts of each fuel type to use annually). The optimization criterion is the Profitability Index of the investment. The model presented is based on the multi-biomass concept. The model used for the CHP plant case, is a modification of the model presented in the work of Rentizelas et al. (2009a).
The models have been applied to a case study region in Greece. The results show that both investments have positive yield, though the pelleting plant investment appears to be much more attractive in financial terms. However, the sensitivity analysis has determined that the pelleting plant investment yield is highly sensitive on the pellet price, and that a reduction of more than 25% of this value will make the CHP plant a better investment option. Actually, the CHP plant appears to be a lower risk investment, due to the simultaneous production of two energy products and the current legislation providing long-term fixed prices for renewable electricity generation. On the cost-related parameters side, the pelleting plant investment yield is mostly sensitive on the biomass purchasing price, whereas the CHP plant is mostly
sensitive on the capital cost. Both cases have a high sensitivity to the interest rate.
The results of this work indicate that pellets are a more attractive solution, in financial terms, for an investor willing to engage in the biomass energy sector, compared to centralised CHP generation. If conventional fuel source prices continue to increase, pellet price may also increase, thus further increasing the attractiveness of investing in a pelleting plant using locally available biomass sources. It should be noted however that the findings of this work apply only to the production rates and plant sizes examined for the case study region and that the results could be significantly different if the scale of the investment changes. The main reason for this is that the effect of scale economies is expected to be higher for the CHP plant.
The fact that both supply chains appear to have very positive financial yield denotes the potential for profit generation. Therefore, energy exploitation of locally available biomass sources is expected to increase in the future, leading to a need for local biomass supply chain organization. Finally, it becomes apparent from this work that there is a great opportunity in exploiting agricultural residue biomass sources that have not been used up to now.
8. References
Caputo, A., Palumbo, M., Pelagagge, P., & Scacchia F. (2005). Economics of biomass energy utilization in combustion and gasification plants: effects of logistics variables. Biomass and Bioenergy, 28, pp. 35–51.
Carroll, J.P., & Finnan, J. (2012). Physical and chemical properties of pellets from energy crops and cereal straws. Biosystems Engineering, 112 (2), 151-159.
Cundiff, J., Dias, N., & Sherali, H. (1997). A linear programming approach for designing a herbaceous biomass delivery system. Bioresource Technology, 59, 47–55.
Freppaz, D., Minciardi, R., Robba, M., Rovatti, M., Sacile, R., & Taramasso A. (2004). Optimizing forest biomass exploitation for energy supply at a regional level. Biomass and Bioenergy, 26, 15–25.
Karkania, V., Fanara, E., & Zabaniotou, A. (2012). Review of sustainable biomass pellets production –A study for agricultural residues pellets’ market in Greece. Renewable and Sustainable Energy Reviews, 16 (3), 1426-1436.
Mani, S., Sokhansanj, S., Bi., X., & Turhollow, A. (2006). Economics of producing fuel pellets from biomass. Applied Engineering in agriculture, 22 (3), 421-426.
Mitchell, C.M., Bridgwater, A., Stevens, D., Toft, A., & Watters, M. (1995). Technoeconomic assessment of biomass to energy. Biomass and Bioenergy, 9 (1–5), 205–226.
Pantaleo, A., Pellerano, A., & Carone M.T. (2009). Potentials and feasibility assessment of small scale CHP plants fired by energy crops in Puglia region (Italy). Biosystems
Engineering 102 (3), 345-359.
Papadopoulos, D., & Katsigiannis, P. (2002). Biomass energy surveying and techno-economic assessment of suitable CHP system installations. Biomass and Bioenergy, 22, 105–124.
Pastre, O. (2002). Analysis of the Technical Obstacles Related to the Production and Utilization of Fuel Pellets Made from Agricultural Residue. European Biomass Industry Association (EUBIA), Report No. ALTENER 2002-012-137-160.
Rentizelas, A.A., Tatsiopoulos, I.P., & Tolis, A. (2009a). An optimization model for multi-biomass tri-generation energy supply. Biomass and Bioenergy, 33 (2),223-233.
Rentizelas, A.A., Tolis, A.J., & Tatsiopoulos, I.P. (2009b). Logistics issues of biomass: The storage problem and the multi-biomass supply chain. Renewable and Sustainable Energy Reviews, 13 (4), 887-894.
Rentizelas A., Tolis A. & Tatsiopoulos I.P. (2009c). Biomass district energy trigeneration systems: emissions reduction and financial impact, Water, Air and Soil Pollution: Focus, 9 (1), 139-150.
Rentizelas, A.A., & Tatsiopoulos, I.P. (2010). Locating a bioenergy facility using a hybrid optimization method. International Journal of Production Economics, 123 (1), 196-209.
Sultana, A., Kumar, A., & Harfield, D. (2010). Development of agri-pellet production cost and optimum size. Bioresource Technology, 101, 5609–5621.
Tatsiopoulos, I.P., & Tolis A.J. (2003). Economic aspects of the cotton-stalk biomass logistics and comparison of supply chain methods. Biomass and Bioenergy, 24 (3), 199-214.
Thek, G., & Obernberger I. (2004). Wood pellet production costs under Austrian and in comparison to Swedish framework condition. Biomass and Bioenergy, 27, 671–693.
Tumuluru, J.S., Tabil, L., Opoku, A., Mosqueda, M.R., & Fadeyi O. (2010). Effect of process variables on the quality characteristics of pelleted wheat distiller's dried grains with
soluble.Biosystems Engineering, 105 (4), 466-475.
Urbanowski, E. (2005). Strategic Analysis of a Pellet Fuel Opportunity in Northwest British Columbia. MBA Thesis, Simon Fraser University, BC, Canada.
USDA (United States Department of Agriculture) (2009). North America’s Wood Pellet
Sector. Research paper FPL-RP-656, Madison, WI, USA.
Verma, V.K., Bram, S., Vandendael, I., Laha, P., Hubin, A., & De Ruyck. J. (2011). Residential pellet boilers in Belgium: Standard laboratory and real life performance with respect to European standard and quality labels. Applied Energy, 88, 2628–2634
Figure Captions
Figure 1. Biomass & Pellets inventory
Figure 2. Pellet production rates, sales rates and inventory
Figure 3. Sensitivity analysis for the pelleting plant