1 Title: Wrist accelerometer cut-points for classifying sedentary behavior in children. 1
Christiana M.T. van Loo (corresponding author)1 2
University of Wollongong, NSW, 2522, Australia 3
E: [email protected] 4
T: +61 2 4239 2274 5
6
Anthony D. Okely1, Marijka J. Batterham2, Trina Hinkley3, Ulf Ekelund4,5, Søren Brage5, 7
John J. Reilly6, Stewart G. Trost7, Rachel A. Jones1, Xanne Janssen6, Dylan P. Cliff1 8
9
1. Early Start Research Institute and Illawarra Health and Medical Research Institute, 10
University of Wollongong, Australia 11
2. School of Mathematics and Applied Statistics, University of Wollongong, Australia
12
3. Deakin University, Geelong, Australia, Institute for Physical Activity and Nutrition 13
(IPAN), School of Exercise and Nutrition Sciences 14
4. Norwegian School of Sports Sciences, Norway 15
5. MRC Epidemiology Unit, University of Cambridge, United Kingdom 16
6. University of Strathclyde, School of Psychological Sciences and Health, Scotland 17
7. Institute of Health and Biomedical Innovation at Queensland Centre for Children’s Health 18
Research, School of Exercise and Nutrition Science, Queensland University of Technology 19
20
2 Abstract
21
Introduction: To examine the validity and accuracy of wrist accelerometers for classifying 22
sedentary behavior (SB) in children. 23
Methods: Fifty-seven children (5-8y and 9-12y) completed a ~170min protocol including 15 24
semi-structured activities and transitions. Nine ActiGraph (GT3X+) and two GENEActiv 25
wrist cut-points were evaluated. Direct observation was the criterion measure. The accuracy 26
of wrist cut-points was compared to that achieved by the ActiGraph hip cut-point (≤25 27
counts/15s) and the thigh-mounted activPAL3TM. Analyses included equivalence testing, 28
Bland-Altman procedures and area under the receiver operating curve (ROC-AUC). 29
Results: The most accurate ActiGraph wrist cut-points (Kim, vector magnitude: ≤3958 30
counts/60s and vertical axis: ≤1756 counts/60s) demonstrated good classification accuracy 31
(ROC-AUC = 0.85-0.86) and accurately estimated SB time in 5-8y (equivalence p=0.02; 32
mean bias: 4.1%, limits of agreement [LoA]: 20.128.4%) and 912y (equivalence p<0.01; -33
2.5%, -27.9-22.9%). Mean bias of SB time estimates from Kim were smaller than ActiGraph 34
hip (5-8y: 15.8%, -5.7-37.2%; 9-12y: 17.8%, -3.9-39.5%) and similar to or smaller than 35
activPAL3TM (5-8y: 12.6%, -39.8-14.7%; 9-12y: -1.4%, -13.9-11.0%), although classification 36
accuracy was similar to ActiGraph hip (ROC-AUC = 0.85) but lower than activPAL3TM 37
(ROC-AUC = 0.92-0.97). Mean bias (5-8y: 6.5%, -16.1-29.1%; 9-12y: 10.5%, -13.6-34.6%) 38
for the most accurate GENEActiv wrist cut-point (Schaefer: ≤0.19g) was smaller than 39
ActiGraph hip, and activPAL3TM in 5-8y, but larger than activPAL3TM in 9-12y. However, 40
SB time estimates from Schaefer were not equivalent to direct observation (equivalence 41
p>0.05) and classification accuracy (ROC-AUC = 0.79-0.80) was lower than for ActiGraph 42
3 Conclusion: The most accurate SB ActiGraph (Kim) and GENEActiv (Schaefer) wrist cut-44
points can be applied in children with similar confidence as the ActiGraph hip cut-point (≤25 45
counts/15s), although activPAL3TM was generally more accurate. 46
47
Keywords: activity monitor, youth, validation, physical activity, objective measurement, 48
sitting 49
50
Introduction 51
Sedentary behaviors (SB) are defined as any waking behaviors in a sitting or reclining 52
position that require an energy expenditure of ≤1.5 metabolic equivalents (30). Although 53
some studies among children and adolescents suggest that the total volume or pattern of SB is 54
associated with adverse health outcomes, independent of moderate- to vigorous intensity 55
physical activity (MVPA) (7, 8, 24), overall the evidence appears to be inconsistent (6, 11). 56
Accurate measures of SB are essential for both observational and experimental research to 57
further investigate the influence of SB on health outcomes, as well as the prevalence and 58
determinants of SB, and the effectiveness of interventions to reduce SB. 59
Accelerometry is the method of choice for objectively measuring the amount and 60
patterning of SB in children (32) and various accelerometers are available for placement on 61
different body locations (e.g. hip, wrist or thigh) (17). Hip-mounted accelerometers have 62
commonly been used in children (32), with cut-point approaches typically applied to define 63
SB (17). For example, large population surveys, such as the National Health and Nutrition 64
Examination Study (NHANES) 2003-2004 incorporated hip-worn ActiGraph accelerometers 65
4 about low participant compliance to accelerometry protocols and subsequent data loss have 67
resulted in a shift from hip to wrist placement (14). NHANES 2011-2014 (31) incorporated 68
wrist-worn accelerometers and the data from this study and other initial reports (13, 28) 69
indicate that wrist-placement results in increased wear time due to greater compliance, which 70
in turn leads to greater confidence that the data are representative of daily physical activity 71
and SB. The ActiGraph (ActiGraph LLC, Pensacola Beach, FL) and GENEActiv 72
(ActivInsights Ltd., Cambridge, UK) are accelerometer-based motion sensors typically worn 73
on the hip or wrist. Thresholds or cut-points have been developed for the wrist-worn 74
ActiGraph (5, 9, 19) and GENEActiv (26, 29) to classify SB in children. The wrist cut-points 75
were developed using different age groups, sample sizes and activity protocols, which results 76
in variations in the cut-points used to classify SB. For example, wrist cut-points developed 77
for ActiGraph’s vertical axis (VA; x-axis) range from 35 counts[c]/5s (9) to 202c/5s 78
(Chandler et al., personal communication, 2016). Using different accelerometer models, 79
placing them at different body locations, and applying different cut-points, results in 80
considerable differences in estimates of SB (17, 28), which makes it difficult to compare 81
outcomes between studies and examine the epidemiology of SB. Therefore, comparison of 82
these assessment methods is needed. Rowlands et al. (2014) compared free-living SB 83
estimates from a GENEActiv (26) signal vector magnitude (SVM) wrist cut-point 84
(PhillipsSVM: right wrist, <6gs; left wrist, <7gs) with the widely used ActiGraph hip cut-point 85
for VA (Evenson: ≤25c/15s) (12) in a sample of free-living 10-12 year-olds (28). This study 86
reported that the outcomes from these monitors were highly correlated, however, sedentary 87
time estimated by PhillipsSVM was significantly lower (9.6%) than estimates from the 88
ActiGraph hip cut-point. Because the study did not have a criterion measure of SB, the level 89
5 GENEActiv and ActiGraph wrist cut-points remains unknown, because only one 91
accelerometer model and one cut-point for the wrist were evaluated. 92
It is also important to evaluate the validity of recent SB wrist cut-points against 93
alternative objective measures to understand the accuracy of newer approaches relative to 94
other options for assessing SB. One alternative method is thigh-mounted accelerometry, such 95
as the activPAL3TM (PAL Technology Ltd., Glasgow, UK) posture detection system, which 96
classifies periods spent sitting/lying, standing or stepping. Because of the monitor's 97
placement on the thigh, it uses the orientation (angle to vertical) of the thigh to accurately 98
estimate SB (34), rather than simply the movement intensity measures used in traditional hip-99
based cut-point approaches which have difficulties differentiating between standing and 100
sitting (17, 21). Whether or not wrist-based cut-point approaches provide equally accurate 101
estimates of SB relative to alternative approaches such as hip- or thigh-based accelerometry 102
is unclear and requires further investigation. Furthermore, it is important to evaluate the 103
accuracy of the wrist cut-points to detect breaks in SB in order to understand their influence 104
on health outcomes. 105
To our knowledge, no comprehensive validation studies have been conducted in 106
children in which sedentary wrist cut-points for the ActiGraph or GENEActiv have been 107
evaluated simultaneously during a standardised activity protocol, against a criterion measure 108
and alternative objective measures of SB. Therefore, the aims of this study were to examine 109
the classification accuracy and validity of sedentary wrist cut-points for ActiGraph and 110
GENEActiv, relative to the hip-mounted ActiGraph (Evenson: ≤25c/15s) and the thigh-111
mounted activPAL3TM, using direct observation as the criterion measure in 5-12 year-olds. 112
Based on evidence that the thigh-mounted activPAL3TM demonstrated acceptable accuracy 113
for classifying SB in school-aged children (34) and that traditional hip-based accelerometers 114
6 have similar difficulties as hip cut-points in discriminating between standing and sitting, it 116
was hypothesized that the most accurate wrist cut-points would demonstrate similar accuracy 117
as the hip cut-point for assessing SB, but lower accuracy than the thigh-mounted 118
activPAL3TM. 119
120
Methods 121
Participants 122
Fifty-seven children aged 5-12y who were without physical or health conditions that 123
would affect participation in physical activity were recruited as part of an activity monitor 124
validation study. The study was approved by the University of Wollongong Health and 125
Medical Human Research Ethics Committee. Written parental consent and participant assent 126
were obtained prior to participation. 127
Procedures 128
Participants were required to visit the laboratory on two occasions. Anthropometric 129
measures were completed during the first visit using standardised procedures while children 130
were wearing light clothing and with shoes removed. BMI (kg/m2) and weight status were 131
calculated (20). Children completed a protocol of 15 semi-structured activities from sedentary 132
(lying down, TV viewing, handheld e-game, writing/coloring, computer game), light (getting 133
ready for school, standing class activity, slow walk, dancing), and moderate-to-vigorous (tidy 134
up, brisk walk, soccer, basketball, running, locomotor course) intensity (Supplemental Digital 135
Content 1). Activities were equally divided over 2 visits and completed in a structured order 136
7 At each visit, children were fitted with an ActiGraph GT3X+ on the right hip 138
(midaxilla line at the level of the iliac crest) with an elastic belt, and an ActiGraph GT3X+ 139
and a GENEActiv dorsally on each wrist. The distal and proximal position of the ActiGraph 140
and GENEActiv monitors on each wrist was alternated for each participant to avoid 141
placement effects. An activPAL3TM was placed mid-anteriorly on the right thigh. 142
Activity monitors 143
The ActiGraph GT3X+ is a tri-axial accelerometer that measures accelerations 144
ranging in magnitude ±6g. Raw accelerometry data can be stored at a user-specified sample 145
frequency ranging from 30-100Hz. The GENEActiv has a waterproof design and measures 146
tri-axial accelerations ranging in magnitude ±8g at a sample frequency ranging from 10-147
100Hz. The ActiGraph and GENEActiv were initialised with a sample frequency of 100Hz. 148
Data reduction approaches were performed according to the methods used to develop each 149
cut-point (Table 1), as reported in original calibration studies (5, 9, 12, 19, 26, 29). Raw 150
ActiGraph data were downloaded using ActiLife version 6.12.1. ActiGraph hip and wrist data 151
were converted to counts per 5s (5, 9), 15s (12), or 60s (19) corresponding to the epoch 152
lengths used in their development. Output variables for ActiGraph monitors were VA, which 153
is sensitive to movement only along the longitudinal axis of the lower arm or the dominant 154
plane of the body (hip) and vector magnitude (VM), a 3-dimensional measure of the 155
acceleration which is not sensitive to orientation and direction of movement. Raw 156
GENEActiv wrist data were downloaded and converted into 1s epochs using the GENEActiv 157
software version 2.2 according to methods described by Philips et al. (26), in order to create 158
gravity-subtracted signal vector magnitude (SVMgs) data. Customized software was used to 159
filter the raw GENEActiv data (bandpass filter, cut-off frequencies: 0.2 and 15Hz) in order to 160
8 described by Schaefer et al. (29). An average gravity-subtracted signal vector magnitude 162
(SVMg) was then calculated for each second using a formula described by the authors. 163
The activPAL3TM is an activity monitor worn on the thigh that uses tri-axial 164
acceleration data (20Hz) to assess the position and movement of the limb. The activPAL3TM 165
software version 7.2.32 with proprietary algorithms was used to classify tri-axial 166
accelerometry data into periods spent sitting/lying, standing or stepping. Event records 167
created by the software were used to create 1s epoch data files which were used in the 168
analyses to classify periods spent sedentary. The activPAL3TM was initialised with minimum 169
sitting or upright period of 1s. 170
Direct observation 171
Direct observation was used as criterion measure to establish the classification 172
accuracy and validity of the cut-points. Children were recorded on video completing the 173
activities as well as during transitions between activities. A single observer coded all videos 174
using Vitessa 0.1 (University of Leuven, Belgium) which generated a time stamp every time 175
a change in posture or intensity was coded by the observer. Subsequently, a second-by-176
second classification system was generated. Every second following the time stamp inserted 177
by the observer was classified as being the same posture as the one occurring at the time 178
stamp itself until the next time stamp was created, indicating that a change in the child’s 179
posture had occurred. In the event of two postures occurring within the same second, this 180
second was duplicated in order to label both postures. Labels for postures were sitting/lying 181
(gluteus muscles resting on ground, feet, legs or any other surface, or lying in prone position), 182
standing (e.g both feet touching the ground, squatting, standing on one foot, kneeling on one 183
or two knees), stepping (e.g moving one leg in front of the other, including stepping with a 184
9 using 1s epochs. A dichotomous coding system was applied to re-code postures into 186
sedentary (sitting/lying: “1”) and non-sedentary (standing, stepping: “0”). Videos of 5 187
randomly selected participants were analysed twice by the same observer and by a second 188
observer to test inter- and intra-observer reliability. Inter- and intra-observer reliability were 189
examined using Cohen’s Kappa and single measure intra-class correlation coefficients (ICC) 190
from two-way mixed effect models (fixed-effects = observer; random effects = participants), 191
using the consistency definition. Cohen’s Kappa coefficient for inter-observer reliability was 192
0.941. Inter-observer ICC was 0.974 (0.974 - 0.974) and intra-observer ICC was 0.963 (0.962 193
- 0.963). 194
Data synchronization 195
Monitors and direct observation were time synchronized using an internal computer 196
clock. Second-by-second direct observation data were synchronized with 1s epoch data from 197
activPAL3TM and GENEActiv. Direct observation and activPAL3TM data files contained 198
events of duplicated seconds when two postures were assigned to the same second. If this was 199
the case for direct observation data, these seconds were duplicated at the corresponding time 200
point for activPAL3TM and GENEActiv output. If this was the case for activPAL3TM data, the 201
seconds were duplicated for direct observation and GENEActiv output. The second-by-202
second duplicates were not generated for ActiGraph output, because these data were exported 203
in 5s, 15s and 60s epochs. This method was applied for evaluation of classification accuracy 204
and was in line with previous validation studies in preschool children (10, 18). In order to 205
align direct observation with ActiGraph epochs, new time frames were created for direct 206
observation with steps of 5s, 15s and 60s. If >50% of the seconds within an epoch were 207
classified as sedentary, the epoch was coded as sedentary (“1”), if ≤50% of the epoch was 208
classified as sedentary, the epoch was coded as non-sedentary (“0”). The synchronized direct 209
10 coded as “off screen”. For estimates of time spent in different postures, codes of duplicated 211
seconds for either direct observation (0.02% of total direct observation data) or accelerometer 212
(0.04% of total activPAL3TM data) were assigned 0.5sec, in order to avoid artificially 213
inflating the total time observed. The absolute number of SB breaks for each method was 214
defined as the number of transitions from SB to non-SB. 215
Statistical analyses 216
Prior to analyses, the total sample was divided into two age groups (5-8y, n=25 and 9-217
12y, n=32) because of the potential that younger and older children might engage in SB 218
differently (17). Analyses included equivalence testing, Bland-Altman procedures and 219
calculating sensitivity, specificity and area under the receiver operating curve (ROC-AUC) to 220
evaluate and compare the accuracy and validity of different SB cut-points for wrist mounted 221
ActiGraph and GENEActiv accelerometers, hip-worn ActiGraph accelerometer and 222
activPAL3TM. The equivalence of estimated sedentary time from different activity monitors, 223
sites and cut-points and direct observation was examined at the group level of measurement 224
using the 95% equivalence test. In order to reject the null-hypothesis of the equivalence test, 225
the 90% confidence interval (CI) of time spent sedentary predicted by the monitors should 226
fall entirely within the predefined equivalence region of ±10% (2). The 90% CIs of the 227
estimated sedentary time were bootstrapped, because the sample sizes of the age groups were 228
relatively small and, therefore, not all data were normally distributed. Agreement and 229
systematic bias for estimated sedentary time were evaluated at the individual level using 230
Bland-Altman procedures (17). For the ROC analyses, classification accuracy was rated as 231
excellent (ROC-AUC ≥ 0.90), good (ROC-AUC = 0.80-0.89), fair (ROC-AUC = 0.70-0.79) 232
or poor (ROC-AUC < 0.70) (23). The difference between the absolute number of SB breaks 233
11 235
Results 236
Descriptive characteristics of participants are presented in Table 2. All participants 237
completed the protocol and had valid activPAL3TM and ActiGraph wrist and hip data. For one 238
of the visits, video data were unavailable for 3 children (age 5, 9 and 10y) and GENEActiv 239
wrist data were unavailable for 3 different children (all 9-12y). Out of the remaining 250,854 240
1s epochs from 5-8y and 296,134 epochs from 9-12y, 27,983 epochs and 23,513 epochs of 241
direct observation were coded as “off screen” and excluded from analyses, respectively, 242
leaving 222,872 (88.8%) valid epochs for 5-8y and 272,622 (92.1%) valid epochs for 9-12y. 243
Mean direct observation time for 5-8y was 167.2 ± 21.9 min, of which 78.0 ± 11.8 min was 244
coded as SB. Mean direct observation time for 9-12y was 154.2 ± 35.6 min, of which 69.5 ± 245
18.4 min was coded as SB. Results are presented for the non-dominant wrist (unless stated 246
otherwise), because placement on this wrist was recommended by the physical activity 247
monitor protocol (4) released by the National Health and Nutrition Examination Survey and 248
previous studies have used the non-dominant wrist for the development of wrist cut-points (5, 249
16, 29). Results for the dominant wrist are presented in Supplemental Digital Content. 250
Validation of ActiGraph wrist cut-points 251
Figures 1 (5-8y) and 2 (9-12y) present the 95% equivalence tests for accelerometry-based 252
estimated time spent in SB from wrist-worn ActiGraph and GENEActiv cut-points, the hip-253
worn ActiGraph cut-point and activPAL3TM, as well as the equivalence region of direct 254
observation. At the group level, estimates of SB time from Kim et al.’s ActiGraph VM wrist 255
cut-point (KimVM) were equivalent to direct observation (p=0.02) in 5-8y, and estimates from 256
the VA cut-point (KimVA) approached equivalence (p=0.08). Mean bias for estimated SB 257
12 KimVA underestimated SB time by 6.5% (LoA: -33.1% – 20.2%). In 9-12y, CrouterVA/ROC 259
and KimVA were equivalent to direct observation (p<0.01) and CrouterVM/ROC approached 260
equivalence (p=0.05). These cut-points underestimated SB time by 1.7% (LoA: -25.9% – 261
22.5%), 2.5% (LoA: -27.9% – 22.9%) and 5.3% (LoA: -27.9% – 22.9%), respectively. 262
Estimates of SB time from other ActiGraph wrist cut-points were not equivalent to direct 263
observation in either age group. The mean bias varied from 7.2% (CrouterVA/ROC) to 20.5% 264
(ChandlerVA/2016) in 5-8y and from 10.9% (CrouterVA/REG) to 29.6% (ChandlerVA/2016) in 9-265
12y. Good classification accuracy (Table 4) was found for KimVA (both age groups: ROC-266
AUC = 0.86) and KimVM (5-8y: ROC-AUC = 0.85; 9-12y: ROC-AUC = 0.82). Classification 267
accuracy for other ActiGraph wrist cut-points was fair (5-8y: ROC-AUC = 0.77-0.79, 9-12y: 268
ROC-AUC = 0.72-0.75). At the individual level (Table 3), LoAs for all cut-points, including 269
the most accurate ActiGraph wrist cut-points, were relatively wide (range = ChandlerVA/2016 in 270
5-8y: 0.0% – 41.0%; to ChandlerVA/2016 in 9-12y: -6.6% – 65.9%), which indicated large 271
random error. No systematic bias (Table 3) was found for any of the ActiGraph wrist cut-272
points (p>0.05). Findings of the equivalence test, classification accuracy and Bland-Altman 273
analyses for ActiGraph wrist cut-points for the dominant wrist (Supplemental Digital Content 274
2, 3 and 4) were consistent with findings for the non-dominant wrist. Compared to direct 275
observation, the absolute number of breaks were overestimated by all ActiGraph cut-points in 276
both age groups for both wrists (5-8y: mean difference range = 2.4-160.8, all p<0.05; 9-12y: 277
mean difference range = 1.8-138.6, all p<0.05), except from KimVM for the non-dominant 278
wrist (5-8y: mean difference = 1.4±5.7, p=0.24; 9-12y: mean difference = 1.8, p=0.05) 279
(Supplemental Digital Content 5). Mean differences with direct observation were larger for 280
wrist cut-points developed with 5sec epochs (5-8y: 154.4±4.1, 9-12y: 129.9±5.2) compared 281
to cut-points developed with 60sec epochs (5-8y: 2.9±1.2, 9-12y: 2.5±0.8). 282
13 Validation of GENEActiv wrist cut-points
284
Estimates of SB time from GENEActiv wrist cut-points PhillipsSVM and SchaeferSVM 285
for the non-dominant wrist were not equivalent to direct observation (Figures 1 and 2). 286
PhillipsSVM and SchaeferSVM overestimated SB time in 5-8y by 16.8% (LoA: -3.9% – 29.6%) 287
and 9.6% (LoA: -13.8% – 33.0%), respectively, and in 9-12y by 17.8% (LoA: -11.6% – 288
47.3%) and 12.6% (LoA: -12.3% – 37.6%), respectively (Table 3). Although estimates from 289
the GENEActiv wrist cut-points for the dominant wrist were also not equivalent to direct 290
observation in both age groups, the cut-points performed slightly better for this wrist when 291
estimating SB time at the group level (Supplemental Digital Content 4). For the dominant 292
wrist, PhillipsSVM and SchaeferSVM overestimated SB time in 5-8y by 8.1% (LoA: -24.0% – 293
40.1%) and 6.5% (LoA: -16.1% – 29.1%), respectively, and in 9-12y by 8.2% (LoA: -18.6% 294
– 35.0%) and 10.5% (LoA: -13.6% – 34.6%), respectively (Supplemental Digital Content 2). 295
Classification accuracy for all GENEActiv wrist cut-points were fair to good in both age 296
groups and for both wrists (ROC-AUC = 0.79-0.80). At the individual level, the LoA was 297
smallest for PhillipsSVM (-3.9% – 29.6%), although all other LoAs for GENEActiv cut-points 298
were relatively wide, which indicated large random error (Table 3 and Supplemental Digital 299
Content 2). No systematic bias was found for any of the GENEActiv wrist cut-points 300
(p>0.05). All GENEActiv wrist cut-points overestimated the absolute number of breaks 301
compared to direct observation in both age groups (5-8y: mean difference range = 354.8-302
468.8, all p<0.01; 9-12y: mean difference range = 313.2-398.1, all p<0.01) (Supplemental 303
Digital Content 5). Mean differences with direct observation were larger for the GENEActiv 304
wrist cut-points developed with 1sec epochs, compared to the ActiGraph cut-points 305
developed with both 5sec epochs and 60sec epochs. 306
14 Comparison of validity of wrist cut-points against ActiGraph hip cut-point and activPAL3TM 308
In 5-8y, estimates of SB time by activPAL3TM (12.6% [LoA: -39.8% – 14.7%]) and 309
the hip-worn ActiGraph (15.8% [LoA: -5.7% – 37.2%]) were not equivalent to direct 310
observation, and the most accurate ActiGraph wrist cut-points (KimVA and KimVM), 311
GENEActiv wrist cut-points for the dominant wrist and SchaeferSVM for the non-dominant 312
wrist had smaller mean biases. Despite these differences, LoAs for the ActiGraph and 313
GENEActiv wrist cut-points were similarly wide to activPAL3TM and the hip-worn 314
ActiGraph. In contrast to the group level findings, classification accuracy for the Kim cut-315
points were significantly lower than activPAL3TM (ROC-AUC = 0.92, 95%CI = 0.92-0.93), 316
but similar to the hip-worn ActiGraph (ROC-AUC = 0.85, 95%CI = 0.84-0.85) in 5-8y. 317
Classification accuracy of both GENEActiv wrist cut-points for the non-dominant and 318
dominant wrist was significantly lower than activPAL3TM and the hip-worn ActiGraph. 319
In 9-12y, estimates of SB time by activPAL3TM were equivalent to DO (-1.4% [LoA: 320
-13.95 - 11.0%]) (p<0.01), which was also the case for the most accurate ActiGraph wrist 321
cut-points (CrouterVA/ROC and KimVA). However, mean biases were larger and estimates of 322
SB time were not equivalent to direct observation for the hipworn ActiGraph (17.8% [LoA: -323
3.9% - 39.5%]), and GENEActiv cut-points for either wrist in 9-12y. LoAs for the ActiGraph 324
and GENEActiv wrist cut-points were wider than activPAL3TM, but similar to ActiGraph on 325
the hip in 9-12y. The most accurate ActiGraph wrist cut-point (KimVA) exhibited lower 326
classification accuracy than activPAL3TM (ROC-AUC = 0.97, 95%CI = 0.97-0.97), but was 327
similar to the hip-worn ActiGraph (ROC-AUC = 0.85, 95%CI = 0.84-0.85) in 9-12y. 328
Classification accuracy of the GENEActiv cut-points for both wrists was lower than 329
15 Mean differences with direct observation for SB breaks were larger for most 331
ActiGraph and both GENEActiv wrist cut-points compared to the activPAL3TM (5-8y: 332
8.5±6.0, p<0.01; 9-12: 3.2±3.1, p<0.01) and the hip-worn ActiGraph (5-8y: 33.2±13.7, 333
p<0.01; 9-12: 29.3±10.9, p<0.01) in both age groups, except for the KimVM cut-points where 334
the differences were smaller. 335
336
Discussion 337
This study examined the accuracy and validity of ActiGraph and GENEActiv wrist 338
cut-points for classifying SB in 5-12 year-old children. The ActiGraph wrist cut-points 339
KimVM and KimVAaccurately estimated SB time in 5-8y and 9-12y, respectively, at the group 340
level, and exhibited good classification accuracy. These cut-points provided more accurate 341
estimates of SB time compared to the Evenson ActiGraph hip cut-point (≤25c/15s). Although 342
GENEActiv wrist cut-points appeared to provide more accurate group-level estimates of SB 343
time than the ActiGraph hip cut-point for 5-8y and 9-12y, these cut-points over-estimated SB 344
time, and classification accuracy was significantly lower than for the ActiGraph hip cut-point 345
and activPAL3TM in both age groups. Excluding an overestimation of SB time in 5-8y, 346
activPAL3TM exhibited greater accuracy than the ActiGraph and GENEActiv wrist cut-points 347
and the ActiGraph hip cut-point. Overall, the most accurate ActiGraph and GENEActiv wrist 348
cut-points estimated SB with similar accuracy as the ActiGraph hip cut-point, although the 349
accuracy of the thigh-mounted activPAL3TM was generally higher. The KIMVM cut-point 350
estimated the absolute number of breaks in SB more accurately than the ActiGraph hip cut-351
point and activPAL3TM in both age groups, whereas the other ActiGraph and GENEActiv 352
wrist cut-points showed larger overestimations. To our knowledge, no previous studies have 353
simultaneously evaluated the relative validity of multiple ActiGraph or GENEActiv wrist cut-354
16 ActiGraph wrist cut-points using indirect calorimetry in an independent sample of 11-14 356
year-olds who completed 2h of unstructured physical activity. The authors reported that the 357
errors for estimated SB time were small (-8.6% – 2.5%) and not significantly different from 358
the criterion measure. However, traditional analyses that fail to reject the null hypothesis of 359
similarity do not necessarily demonstrate that the cut-points meet an acceptable level of 360
accuracy (2). Therefore, testing the equivalence could be beneficial when examining the 361
clinical significance of potential errors. In our study, mean bias for estimated SB time from 362
Crouter et al.’s cutpoints were slightly larger, ranging from 7.2% to 11.5% in 58y and -363
1.7% to 16.8% in 9-12y. Equivalence testing indicated that only CrouterVA/ROC in 9-12y was 364
equivalent to direct observation, although the classification accuracy for Crouter et al.’s cut-365
points across both age groups was only fair (ROC-AUC = 0.73 – 0.79). This suggests that, 366
although errors may appear small, they might still be meaningful and misclassification of SB 367
and non-SB may cancel each other out. Other methodological differences between our study 368
and that of Crouter et al. (9), such as the younger age range of participants in our study could 369
have contributed to the differences in findings, because younger and older children 370
potentially engage in and move between sedentary and non-sedentary behaviors differently 371
(17). Furthermore, the use of different criterion measures might have also contributed to the 372
differences in measurement errors. (17) 373
Kim et al. (19) used a protocol of 12 randomly selected semi-structured activities to 374
develop ActiGraph wrist cut-points (KimVA and KimVM) in a sub-sample of 7-13 year-olds (n 375
= 49), and also provided results for the Evenson ActiGraph hip cut-point (≤25c/15s, n = 125) 376
against which wrist cut-points could be compared. Although ROC-AUC values were not 377
reported for the hip-worn ActiGraph, sensitivity (Se: true positive rate) for the wrist cut-378
points (Se: 93.0 – 94.3%) was similar to the hip cut-point (Se = 93.7%), whereas specificity 379
17 point (Sp = 92.5%) for classifying SB, suggesting that the hip-worn ActiGraph was slightly 381
more accurate for classifying non-SB activities. However, the current study found that the 382
classification accuracy for Kim et al.’s ActiGraph wrist points and the ActiGraph hip cut-383
point was similar in both age groups. Cut-point approaches for hip-mounted monitors cannot 384
reliably distinguish between standing still and SB, because SB is classified based on lack of 385
movement, resulting in non-SB activities with minimal lower body movement being 386
misclassified as SB. Because our study included transitions between activities, which likely 387
involved standing with minimal movement, as well as a standing “classroom activity”, the 388
likelihood of misclassifying non-SB as SB by the hip-worn ActiGraph was higher than in 389
Kim et al.’s (19) protocol. In contrast, Kim et al. (19) indicated that most instances of 390
misclassification of non-SB by the hip monitor occurred during a hand weight exercise 391
involving minimal trunk and lower body movement. As such, our findings suggest that wrist 392
cut-points may have similar limitations to hip cut-points in misclassifying standing still as 393
SB. 394
In relation to wrist GENEActiv SB cut-points, Rowlands et al. (28) compared 395
PhillipsSVM for the non-dominant wrist with the ActiGraph hip cut-point (Evenson: ≤25c/15s) 396
in a sample of free-living 10-12 year-olds and reported that estimates of habitual SB time 397
were 9.6% lower for the GENEActiv wrist point compared to the ActiGraph hip cut-398
point, however, we found that the estimates of these cut-points were similar. The difference 399
in study designs may have contributed to these contrasting findings. However, our results 400
showed larger misclassification of SB by PhillipsSVM compared to the hip-worn ActiGraph, 401
and therefore precision for classifying SB and estimates at the individual level might be lower 402
than group-level estimates. 403
Although some cut-points in the current study appear to provide reasonably accurate 404
18 categorised as fair or good. For example, group level estimates of SB time from KimVM and 406
KimVA were equivalent or almost equivalent to direct observation and mean biases were 407
smaller than that observed for the hip-worn ActiGraph and activPAL3TM, however ROC-408
AUC values were lower than activPAL3TM and similar to the ActiGraph hip cut-point. In 9-409
12y, the cut-points CrouterVA/ROC and KimVA were equivalent to DO and estimates of SB time 410
were more accurate than the hip-worn ActiGraph and similar to activPAL3TM. However, 411
although classification accuracy for KimVA was good, classification accuracy for 412
CrouterVA/ROC was only fair and lower than both activPAL3TM and the hip-worn ActiGraph. 413
A possible explanation is that SB as estimated by wrist cut-points was misclassified as non-414
SB in some activities. For instance, the highest percentage of misclassified SB epochs (AG: 415
0.4%-7.3%, GA: 1.4%-5.7%) was found during the coloring activity in 5-8y, which requires 416
the child to use the hand, and so wrist monitors might record counts high enough to be 417
misclassified as non-SB. In contrast, standing still while writing on a white board resulted in 418
the highest percentage of misclassified epochs during non-SB activities for the non-dominant 419
hand (5-8y: AG, 6.7%-9.7%, GA: 8.1%-8.6%; 9-12y: AG, 6.1%-9.0%, GA: 7.7%-8.3%), 420
because the wrist monitors recorded low activity counts on this hand and misclassified 421
epochs during the task as SB. Misclassification of SB and non-SB for wrist cut-points may 422
cancel each other out, resulting in seemingly accurate group-level estimates of SB time. Hip-423
placed monitors on the other hand seem to overestimate SB time at the group level, due to the 424
misclassification of standing still as SB. The results of this study suggest that, while hip-425
based cut-points that typically misclassify standing still as SB, wrist cut-points exhibit some 426
misclassification of non-SB as SB and vice-versa. Progress on alternative approaches, such as 427
those utilising machine learning (15, 27, 33) is therefore required, but until such strategies are 428
widely available, the use of the most accurate ActiGraph and GENEActiv wrist cut-points for 429
19 ActiGraph wrist cut-points developed with 60s epochs seemed to perform better for 431
estimating SB time at the group level and the absolute number of SB breaks, 432
and exhibited higher classification accuracy and compared to cut-points developed with 5s or 433
1s epochs. This could be explained by a higher number of data points when using shorter 434
epochs, resulting in a higher chance of misclassification. The lower classification accuracy 435
with shorter epochs might have contributed to the lower performance of the GENEActiv 436
wrist cut-points as they were developed with 1 s data. This is in contrast to the common use 437
of short epochs for accurately capturing sporadic and intermittent bursts of high–intensity 438
physical activity in children (3). Previous studies have evaluated the effect of epoch length in 439
free-living school-aged children using ActiGraph hip data and showed that time spent in SB 440
decreases when longer epochs are applied (1, 25). A possible explanation is that very short 441
periods (e.g. 1-5s) of standing relatively still might be fairly common in children, resulting in 442
non-SB being misclassified as SB using short epochs. In contrast, when using 60s epochs, 443
standing still would need to occur for almost all of a 60s period for this to be misclassified as 444
SB, and it is possible that this is less common than short periods of standing still among 445
children. Although most ActiGraph wrist cut-points designed for 5s epochs over-estimated 446
SB in our analyses, CrouterVA/ROC and CrouterVM/ROC under-estimated SB in 5-8y and 447
exhibited similar accuracy as those for 60s epochs in 9-12y, and so the combination of epoch 448
and cut-point is likely to be important. Nevertheless, our findings indicate that the most 449
accurate SB wrist cut-points were designed for 60s epochs, which has implications for field-450
based applications. In studies of free-living children, estimates of both SB and physical 451
activity are often desirable. If data are reduced using short epochs such as 5s to estimate 452
physical activity, the most accurate SB cut-points for 5s epochs could be applied, such as 453
Crouter et al.’s CrouterVA/ROC or CrouterVM/ROC (9) for ActiGraph and PhillipsSVM (26) or 454
20 classification accuracy than the most accurate 60s wrist points and the ActiGraph hip cut-456
point, group-level estimates of SB time were more accurate than the ActiGraph hip cut-point. 457
A unique strength of the study was that several currently available wrist cut-points for 458
ActiGraph and GENEActiv were evaluated simultaneously, against a criterion measure and 459
common alternative objective measures of SB. Another strength was that data from the entire 460
activity protocol in our study were analysed including transitions between activities, with the 461
aim to also include data of behaviors outside of structured activities. Additionally, the wide 462
age range of the sample allowed for analyses across two age groups. However, because the 463
study protocol predominantly included structured activities completed in a laboratory setting, 464
the findings should be confirmed under free-living conditions. 465
In summary, the use of the most accurate ActiGraph and GENEActiv wrist-based 466
activity monitor cut-points for estimating SB can be applied in free-living children with 467
similar confidence as the hip-based ActiGraph cut-point (≤25c/15s), although alternative 468
approaches may be needed to achieve the generally higher accuracy of thigh-based 469
approaches such as activPAL3TM. 470
471
Acknowledgements 472
We would like to thank all children and their parents for their participation. We also thank 473
Melinda Smith for her assistance with recruitment and data collection and Woranart 474
Maneenin for video analyses. This study was funded by the National Heart Foundation of 475
Australia (G11S5975). DPC is supported by an Australian Research Council Discovery Early 476
Career Researcher Award (DE140101588). ADO is supported by a National Heart 477
Foundation of Australia Career Development Fellowship (CR11S 6099). TH is funded by a 478
21 work of UE and SB is funded by the UK Medical Research Council (MC_UU_12015/3). ST 480
is supported by the National Health and Medical Research Council Centre of Research 481
Excellence on Sitting Time and Chronic Disease Prevention (APP1057608). 482
483
Conflict of Interest 484
The authors have no conflict of interest to declare. The results of the present study do not 485
constitute endorsement by the American College of Sports Medicine. The results are 486
presented clearly, honestly, and without fabrication, falsification, or inappropriate data 487
manipulation. 488
22 References
490
1. Aibar A, Chanal J. Physical Education: The Effect of Epoch Lengths on Children’s 491
Physical Activity in a Structured Context. PloS one. 2015;10(4). doi: 492
10.1371/journal.pone.0121238
493
2. Batterham M, Van Loo C, Charlton K, Cliff D, Okely A. Improved interpretation of 494
studies comparing methods of dietary assessment: Combining equivalence testing 495
with the limits of agreement. Br J Nutr 2016; 115(7):1273-1280. 496
3. Cain KL, Sallis JF, Conway TL, Van Dyck D, Calhoon L. Using accelerometers in 497
youth physical activity studies: a review of methods. J Phys Act Health. 498
2013;10(3):437-50. 499
4. Center for Disease Control and Prevention [internet]. Physical activity Monitor 500
(PAM) Procedures Manual; [cited 2016 May 19]. Available from: 501
http://www.cdc.gov/nchs/data/nhanes/nhanes_11_12/Physical_Activity_Monitor_Ma
502
nual.pdf
503
5. Chandler J, Brazendale K, Beets M, Mealing B. Classification of physical activity 504
intensities using a wrist‐worn accelerometer in 8–12‐year‐old children. Pediatr Obes. 505
2015; 11(2):120-127. 506
6. Cliff D, Hesketh K, Vella S et al. Objectively measured sedentary behaviour and 507
health and development in children and adolescents: systematic review and meta-508
analysis. Obes Rev. 2015;17(4):330-344. 509
7. Cliff DP, Jones RA, Burrows TL et al. Volumes and bouts of sedentary behavior and 510
physical activity: associations with cardiometabolic health in obese children. Obesity. 511
23 8. Cliff DP, Okely AD, Burrows TL et al. Objectively measured sedentary behavior, 513
physical activity, and plasma lipids in overweight and obese children. Obesity. 514
2013;21(2):382-5. 515
9. Crouter SE, Flynn JI, Bassett Jr DR. Estimating physical activity in youth using a 516
wrist accelerometer. Med Sci Sports Exerc. 2015;47(5):944-51. 517
10. Davies G, Reilly JJ, McGowan AJ, Dall PM, Granat MH, Paton JY. Validity, 518
practical utility, and reliability of the activPAL in preschool children. Med Sci Sports 519
Exerc. 2012;44(4):761-8. 520
11. Ekelund U, Luan Ja, Sherar LB et al. Moderate to vigorous physical activity and 521
sedentary time and cardiometabolic risk factors in children and adolescents. Jama. 522
2012;307(7):704-12. 523
12. Evenson KR, Catellier DJ, Gill K, Ondrak KS, McMurray RG. Calibration of two 524
objective measures of physical activity for children. J Sports Sci. 2008;26(14):1557-525
65. 526
13. Fairclough SJ, Noonan R, Rowlands AV, van Hees V, Knowles Z, Boddy LM. Wear 527
Compliance and Activity in Children Wearing Wrist and Hip-Mounted 528
Accelerometers. Med Sci Sports Exerc. 2016;48(2):245-253. 529
14. Freedson PS, John D. Comment on estimating activity and sedentary behavior from 530
an accelerometer on the hip and wrist. Med Sci Sports Exerc. 2013;45(5):962-3. 531
15. Hagenbuchner M, Cliff DP, Trost SG, Van Tuc N, Peoples GE. Prediction of activity 532
type in preschool children using machine learning techniques. J Sci Med Sport. 533
2015;18(4):426-31. 534
16. Hildebrand M, Van Hees VT, Hansen BH, Ekelund U. Age-group comparability of 535
raw accelerometer output from wrist-and hip-worn monitors. Med Sci Sports Exerc. 536
24 17. Janssen X, Cliff DP. Issues related to measuring and interpreting objectively
538
measured sedentary behavior data. Meas Phys Educ Exerc Sci. 2015;19(3):116-24. 539
18. Janssen X, Cliff DP, Reilly JJ et al. Validation of activPALTM defined sedentary time 540
and breaks in sedentary time in 4-to 6-year olds. Pediatr Exerc Sci. 2014;26(1):110-7. 541
19. Kim Y, Lee J-M, Peters BP, Gaesser GA, Welk GJ. Examination of different 542
accelerometer cut-points for assessing sedentary behaviors in children. PloS one. 543
2014;9(4). doi: 10.1371/journal.pone.0090630
544
20. Kuczmarski RJ, Ogden CL, Guo SS et al. 2000 CDC Growth Charts for the United 545
States: methods and development. Vital Health Stat 11 2002; 246:1-190. 546
21. Lubans DR, Hesketh K, Cliff D et al. A systematic review of the validity and 547
reliability of sedentary behaviour measures used with children and adolescents. Obes 548
Rev. 2011;12(10):781-99. 549
22. Matthews CE, Chen KY, Freedson PS et al. Amount of time spent in sedentary 550
behaviors in the United States, 2003–2004. Am J Epidemiol. 2008;167(7):875-81. 551
23. Metz CE. Basic principles of ROC analysis. Semin Nuel Med. 1978;8(4):283-98. 552
24. Mitchell J, Pate R, Beets M, Nader P. Time spent in sedentary behavior and changes 553
in childhood BMI: a longitudinal study from ages 9 to 15 years. International Journal 554
of Obesity. 2012;37(1):54-60. 555
25. Nettlefold L, Naylor P, Warburton DE, Bredin SS, Race D, McKay HA. The 556
Influence of Epoch Length on Physical Activity Patterns Varies by Child's Activity 557
Level. Res Q Exerc Sport. 2016;87(1):110-23. 558
26. Phillips LR, Parfitt G, Rowlands AV. Calibration of the GENEA accelerometer for 559
assessment of physical activity intensity in children. J Sci Med Sport. 2013;16(2):124-560
25 27. Rowlands AV, Olds TS, Hillsdon M et al. Assessing Sedentary Behavior with the 562
GENEActiv: Introducing the Sedentary Sphere. Med Sci Sports Exerc. 563
2014;46(6):1235-1247. 564
28. Rowlands AV, Rennie K, Kozarski R et al. Children’s physical activity assessed with 565
wrist-and hip-worn accelerometers. Med Sci Sports Exerc. 2014; 46(6):2308-16. 566
29. Schaefer CA, Nigg CR, Hill JO, Brink LA, Browning RC. Establishing and 567
evaluating wrist cutpoints for the GENEActiv accelerometer in youth. Med Sci Sports 568
Exerc. 2014;46(4):826. 569
30. Sedentary Behavior Research Network. Letter to the editor: standardized use of the 570
terms “sedentary” and “sedentary behaviours”. Appl Physiol Nutr Metab. 571
2012;37:540-2. 572
31. Troiano RP, McClain JJ, Brychta RJ, Chen KY. Evolution of accelerometer methods 573
for physical activity research. Br J Sports Med. 2014;48(13):1019-23. 574
32. Trost SG. State of the Art Reviews: Measurement of Physical Activity in Children 575
and Adolescents. Am J Lifestyle Med. 2007;1(4):299-314. 576
33. Trost SG, Wong W-K, Pfeiffer KA, Zheng Y. Artificial neural networks to predict 577
activity type and energy expenditure in youth. Med Sci Sports Exerc. 578
2012;44(9):1801. 579
34. Van Loo CMT, Okely AD, Batterham MJ et al. Validation of thigh-based 580
accelerometer estimates of postural allocation in 5-12 year-olds. J Sci Med Sport 581
[internet]. 2016 [cited 2016 Aug 18]. Available from: 582
http://www.sciencedirect.com/science/article/pii/S1440244016301517. doi: 583
10.1016/j.jsams.2016.08.008. 584
26 Supplemental Digital Content
Supplemental Digital Content 1.docx
Supplemental Digital Content 2.docx
Supplemental Digital Content 3.docx
Supplemental Digital Content 4.tif
Supplemental Digital Content 5.docx
Figure 1. 95% equivalence test for accelerometry-based estimated time spent in sedentary behaviors in 5-8 year-olds.
Legend Figure 1: Times estimated by wrist-worn ActiGraph and wrist-worn GENEActiv cut-points are equivalent to direct observation if 90% confidence intervals lie entirely within the equivalence region of direct observation.VA: vertical axis; VM: vector magnitude; SVM: gravity-subtracted signal vector magnitude; ROC: developed using receiver operating curve analysis; Regression: developed using regression analysis.
Figure 2. 95% equivalence test for accelerometry-based estimated time spent in sedentary behaviors in 9-12 year-olds.
27 gravity-subtracted signal vector magnitude; ROC: developed using receiver operating curve analysis; Regression: developed using regression analysis.
Supplemental Digital Content 4. 95% equivalence test for accelerometry-based estimated time spent in sedentary behaviors for the dominant wrist in a) 5-8 olds and b) 9-12 year-olds.
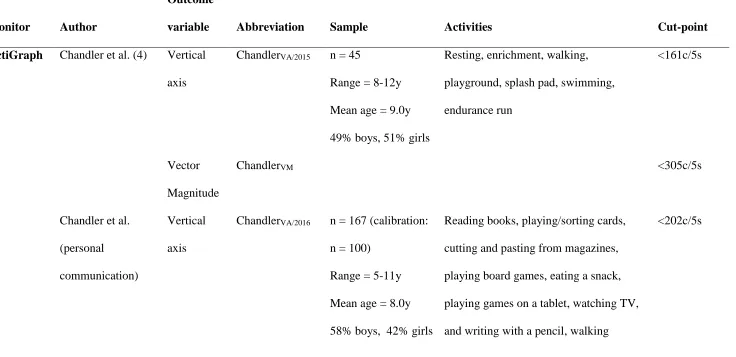
Table 1 Sedentary wrist cut-points
Monitor Author
Outcome
variable Abbreviation Sample Activities Cut-point
ActiGraph Chandler et al. (4) Vertical axis
ChandlerVA/2015 n = 45
Range = 8-12y Mean age = 9.0y 49% boys, 51% girls
Resting, enrichment, walking, playground, splash pad, swimming, endurance run
<161c/5s
Vector Magnitude
ChandlerVM <305c/5s
Chandler et al. (personal
communication)
Vertical axis
ChandlerVA/2016 n = 167 (calibration: n = 100)
Range = 5-11y Mean age = 8.0y 58% boys, 42% girls
Reading books, playing/sorting cards, cutting and pasting from magazines, playing board games, eating a snack, playing games on a tablet, watching TV, and writing with a pencil, walking
<202c/5s
[image:28.792.40.776.121.478.2]Crouter et al. (8) Vertical axis
CrouterVA/ROC n = 181 Range = 8-15y Mean age = 12.0y 53.6% boys, 46.4% girls
One out of four structured activity routines including free-living activities such as: resting, reading, watching TV, walking, running, computer games, cleaning, playing wall ball, soccer
≤35c/5s
CrouterVA/REG ≤105c/5s
Vector Magnitude
CrouterVM/ROC ≤100c/5s
CrouterVM/REG ≤275c/5s
Kim et al. (21) Vertical axis
KimVA n = 49
Range = 7-13y Mean age = 10.1y 40.8% boys, 59.2% girls
Set of 12 activities such as: reading, watching TV, walking, running, playing catch, basketball, stationary cycling
≤1756c/60s
Vector Magnitude
Notes Table 1: VA: vertical axis; VM: vector magnitude; c: counts; s: seconds; SVMg/gs: gravity-subtracted signal vector magnitude; g: gravity; gs: g ∙ seconds; ROC: developed using receiver operating curve analysis; Regression: developed using regression analysis GENEActiv Phillips et al. (30) SVMgs PhillipsSVM n = 44
Range = 8-14y Mean age = 10.9y 40.9% boys, 59.1% girls
Lying supine, seated DVD viewing, active computer games (boxing), using a Nintendo Wii, slow walking, brisk walking, slow
running and a medium run
Right: <6gs, left: <7gs
Schaefer et al. (35) SVMg SchaeferSVM n = 24 children Range = 6-11y Mean age = 9.2y 54.2% boys, 45.8% girls
Resting, colouring, Lego® building, Wii Sports® games, treadmill walking, jogging, running
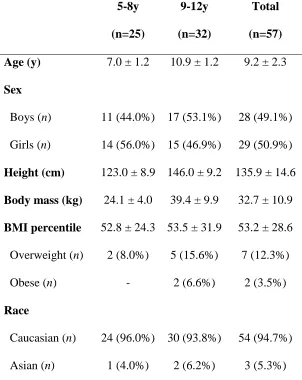
Table 2. Participant characteristics
5-8y
(n=25)
9-12y
(n=32)
Total
(n=57)
Age (y) 7.0 ± 1.2 10.9 ± 1.2 9.2 ± 2.3 Sex
Boys (n) 11 (44.0%) 17 (53.1%) 28 (49.1%) Girls (n) 14 (56.0%) 15 (46.9%) 29 (50.9%) Height (cm) 123.0 ± 8.9 146.0 ± 9.2 135.9 ± 14.6 Body mass (kg) 24.1 ± 4.0 39.4 ± 9.9 32.7 ± 10.9 BMI percentile 52.8 ± 24.3 53.5 ± 31.9 53.2 ± 28.6 Overweight (n) 2 (8.0%) 5 (15.6%) 7 (12.3%) Obese (n) - 2 (6.6%) 2 (3.5%) Race
Caucasian (n) 24 (96.0%) 30 (93.8%) 54 (94.7%) Asian (n) 1 (4.0%) 2 (6.2%) 3 (5.3%)
Characteristics of the participants are presented as mean ± SD, distributions of the sample are presented in numbers (n) and percentages.
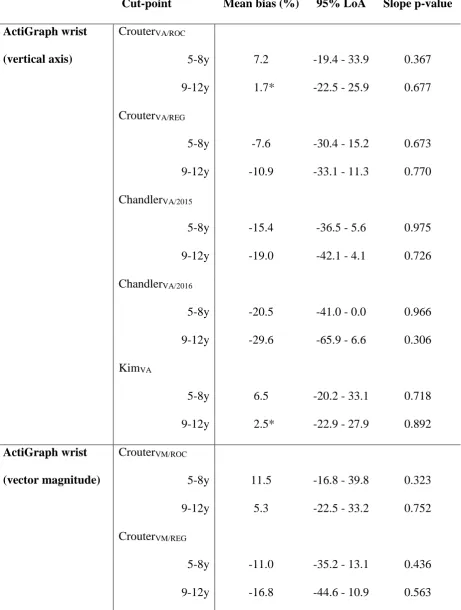
[image:31.612.79.381.111.491.2]Table 3 Agreement analysis of accelerometry-based estimations of sedentary behavior compared to direct observation.
Cut-point Mean bias (%) 95% LoA Slope p-value
ActiGraph wrist
(vertical axis)
CrouterVA/ROC
5-8y 7.2 -19.4 - 33.9 0.367 9-12y 1.7* -22.5 - 25.9 0.677 CrouterVA/REG
5-8y -7.6 -30.4 - 15.2 0.673 9-12y -10.9 -33.1 - 11.3 0.770 ChandlerVA/2015
5-8y -15.4 -36.5 - 5.6 0.975 9-12y -19.0 -42.1 - 4.1 0.726 ChandlerVA/2016
5-8y -20.5 -41.0 - 0.0 0.966 9-12y -29.6 -65.9 - 6.6 0.306 KimVA
5-8y 6.5 -20.2 - 33.1 0.718 9-12y 2.5* -22.9 - 27.9 0.892 ActiGraph wrist
(vector magnitude)
CrouterVM/ROC
5-8y 11.5 -16.8 - 39.8 0.323 9-12y 5.3 -22.5 - 33.2 0.752 CrouterVM/REG
5-8y -11.0 -35.2 - 13.1 0.436 9-12y -16.8 -44.6 - 10.9 0.563
[image:32.595.69.531.148.759.2]Notes Table 3: LoA: limits of agreement; VA: vertical axis; VM: vector magnitude; SVM: gravity-subtracted signal vector magnitude; c: counts; s: seconds; g: gravity; gs: g ∙ seconds. Mean bias was calculated as: measured SB time – estimated SB time; a positive value indicates underestimation; a negative value indicates overestimation. *Significantly equivalent to direct observation (p < 0.05).
ChandlerVM
5-8y -14.4 -38.5 - 9.7 0.401 9-12y -20.8 -49.8 - 8.1 0.542 KimVM
5-8y -4.1* -28.4 - 20.1 0.522 9-12y -13.3 -43.7 - 17.1 0.454 GENEActiv wrist
(signal vector
magnitude)
PhillipsSVM
5-8y -16.8 -29.6 - 3.9 0.744 9-12y -17.8 -47.3 - 11.6 0.737 SchaeferSVM
5-8y -9.6 -33.0 - 13.8 0.957 9-12y -12.6 -37.6 - 12.3 0.898
activPAL3TM 5-8y 12.6 -14.7 - 39.8 0.122
9-12y 1.4* -11.0 - 13.9 0.442
ActiGraph hip
(vertical axis)
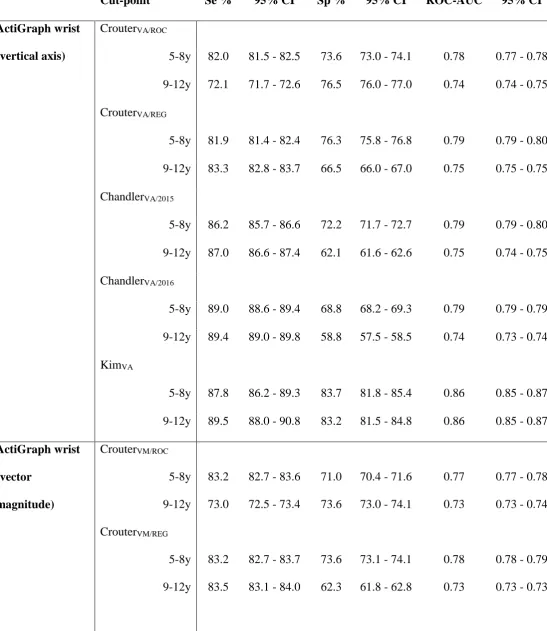
Table 4 Classification accuracy of accelerometry-based estimations of sedentary behavior.
Cut-point Se % 95% CI Sp % 95% CI ROC-AUC 95% CI
ActiGraph wrist
(vertical axis)
CrouterVA/ROC
5-8y 82.0 81.5 - 82.5 73.6 73.0 - 74.1 0.78 0.77 - 0.78 9-12y 72.1 71.7 - 72.6 76.5 76.0 - 77.0 0.74 0.74 - 0.75 CrouterVA/REG
5-8y 81.9 81.4 - 82.4 76.3 75.8 - 76.8 0.79 0.79 - 0.80 9-12y 83.3 82.8 - 83.7 66.5 66.0 - 67.0 0.75 0.75 - 0.75 ChandlerVA/2015
5-8y 86.2 85.7 - 86.6 72.2 71.7 - 72.7 0.79 0.79 - 0.80 9-12y 87.0 86.6 - 87.4 62.1 61.6 - 62.6 0.75 0.74 - 0.75 ChandlerVA/2016
5-8y 89.0 88.6 - 89.4 68.8 68.2 - 69.3 0.79 0.79 - 0.79 9-12y 89.4 89.0 - 89.8 58.8 57.5 - 58.5 0.74 0.73 - 0.74 KimVA
5-8y 87.8 86.2 - 89.3 83.7 81.8 - 85.4 0.86 0.85 - 0.87 9-12y 89.5 88.0 - 90.8 83.2 81.5 - 84.8 0.86 0.85 - 0.87 ActiGraph wrist
(vector
magnitude)
CrouterVM/ROC
5-8y 83.2 82.7 - 83.6 71.0 70.4 - 71.6 0.77 0.77 - 0.78 9-12y 73.0 72.5 - 73.4 73.6 73.0 - 74.1 0.73 0.73 - 0.74 CrouterVM/REG
5-8y 83.2 82.7 - 83.7 73.6 73.1 - 74.1 0.78 0.78 - 0.79 9-12y 83.5 83.1 - 84.0 62.3 61.8 - 62.8 0.73 0.73 - 0.73
ChandlerVM
5-8y 84.8 84.3 - 85.3 71.5 71.0 - 72.1 0.78 0.78 - 0.79 9-12y 84.8 84.4 - 85.3 59.6 59.1 - 60.2 0.72 0.72 - 0.73 KimVM
5-8y 93.6 92.3 - 94.7 77.0 74.9 - 79.0 0.85 0.84 - 0.86 9-12y 93.5 92.3 - 94.5 71.3 69.3 - 73.2 0.82 0.81 - 0.83 GENEActiv wrist
(signal vector
magnitude)
PhillipsSVM
5-8y 87.5 87.4 - 87.7 72.9 72.7 - 73.0 0.80 0.80 - 0.80 9-12y 86.8 86.7 - 87.0 73.3 73.1 - 73.4 0.80 0.80 - 0.80 SchaeferSVM
5-8y 82.6 82.4 - 82.7 75.4 75.2 - 75.6 0.79 0.79 - 0.79 9-12y 83.6 83.4 - 83.7 75.1 74.9 - 75.2 0.79 0.79 - 0.79
activPAL3TM 5-8y 97.9 97.8 - 98.0 87.0 86.9 - 87.2 0.92 0.92 - 0.93
9-12y 97.7 97.6 - 97.8 95.9 95.8 - 96.0 0.97 0.97 - 0.97 ActiGraph hip
(vertical axis)
5-8y 92.7 92.1 - 93.3 76.3 75.4 - 77.2 0.85 0.84 - 0.85 9-12y 93.6 93.0 - 94.1 75.9 75.0 - 76.7 0.85 0.84 - 0.85 Notes Table 4: Se: sensitivity; Sp: specificity; CI: confidence intervals; ROC-AUC: area
Supplemental Data File (.doc, .tif, pdf, etc.)
Click here to access/download
Supplemental Data File (.doc, .tif, pdf, etc.)
Click here to access/download
Supplemental Data File (.doc, .tif, pdf, etc.)
Click here to access/download
Supplemental Data File (.doc, .tif, pdf, etc.)
Click here to access/download
Supplemental Data File (.doc, .tif, pdf, etc.)