City, University of London Institutional Repository
Citation
:
Reid, B. A., Gavaises, M., Mitroglou, N., Hargrave, G. K., Garner, C. P., Long, E. J. & McDavid, R. M. (2014). On the formation of string cavitation inside fuel injectors.Experiments in Fluids, 55(1), .1662. doi: 10.1007/s00348-013-1662-8
This is the draft version of the paper.
This version of the publication may differ from the final published
version.
Permanent repository link:
http://openaccess.city.ac.uk/14413/Link to published version
:
http://dx.doi.org/10.1007/s00348-013-1662-8Copyright and reuse:
City Research Online aims to make research
outputs of City, University of London available to a wider audience.
Copyright and Moral Rights remain with the author(s) and/or copyright
holders. URLs from City Research Online may be freely distributed and
linked to.
City Research Online: http://openaccess.city.ac.uk/ [email protected]
1
On the formation of string cavitation inside fuel
injectors
B. A. Reid1, M. Gavaises2, N. Mitroglou2, G. K. Hargrave1, C.P. Garner1, E. J. Long1, and R. M. McDavid3
1 Wolfson School of Mechanical and Manufacturing Engineering, Loughborough University, Loughborough, Leicestershire LE11 3TU
2 School of Engineering and Mathematical Sciences, City University London, 10 Northampton Square, London EC1V 0HB, UK
3 Caterpillar Inc., Product Development & Global Technology Division, Mossville IL USA Abstract
The formation of vortex or ‘string’ cavitation has been visualised in the flow upstream of the injection hole inlet of an automotive-sized optical diesel fuel injector nozzle operating at pressures up to 2000 bar. Three different nozzle geometries and three-dimensional flow simulations have been employed to describe how, for two adjacent nozzle holes, their relative positions influenced the formation and hole-to-hole interaction of the observed string cavitation vortices. Each hole was shown to contain two counter-rotating vortices; the first extending upstream on-axis with the nozzle hole into the nozzle sac volume, the second forming a single ‘bridging’ string linked to the adjacent hole. Steady-state and transient fuel injection conditions were shown to produce significantly different nozzle flow characteristics with regards to the formation and interaction of these vortices in the geometries tested, with good agreement between the experimental and simulation results being achieved. The study further confirms that the visualised vortices do not cavitate themselves but act as carriers of gas phase components within the injector flow. Introduction
2
the local pressure is typically much higher that the fuel’s vapour pressure which has raised questions on how vaporised liquid can be found there; a more recent study of (Andriotis, Gavaises et al. 2008) suggested that string cavitation represents a transport process of vapour carried by the vortex flow rather than a phase-change process.
Until now, vortex or string cavitation structures have been observed in the sac volume of enlarged nozzle replicas at fluid pressures of only a few bar (selectively (Soteriou, Andrews et al. 1995; Arcoumanis, Gavaises et al. 1998; Soteriou, Smith et al. 1998; Arcoumanis, Flora et al. 1999) and only briefly observed in real-scale nozzle-holes operating at several hundred bar (Walther 2002, Roth, Giannadakis et al. 2005). The present work expands on the findings of (Reid, Hargrave G.K. et al. 2010) who reported the presence of cavitation strings to pressures up to 2000bar and explores the geometric influences on the formation of string cavitation at such conditions. In particular, the hole-to-hole interactions of the cavitation strings are investigated with respect to the positioning of the holes within the injector geometry. (Reid, Hargrave G.K. et al. 2010) proposed that the hole-to-hole interaction of cavitation strings was a result of the interaction between the vortices that generated the cavitation strings in each individual hole. Therefore, this paper explores the hypothesis that, by adjusting the proximity of the nozzle holes from one another, the hole-to-hole interaction, and thus the formation of string cavitation, can be better understood and ultimately controlled simultaneously with the pressure level within the nozzle’s sac volume.
Experimental set-up
3
[image:4.612.216.393.156.371.2]extended 1.8 mm from the underside of the obstruction plate and slotted into the sac volume, positioned such that its height left a 200 µm gap above the two rearward nozzle holes. A ‘D’ shaped hole, formed the opposing semi-circle, which continued through the plate to create a ‘D’-shaped flow entrance to the sac volume. Fuel entered the sac volume such that the downward flow was forced through an angle of 90 degrees, to then flow under the protrusion and exit through the two rearward nozzle holes.
Figure 1. Measured hole layout for ‘standard’ hole spacing
Figure 2. (a) Layout of the transparent nozzle manufactured; (b) Measured temporal variation of pressure during the transient operation
Injection pressures (Prail) was achieved using a high pressure fuel injection test rig based
on a common-rail hardware set-up using ultra-low sulphur diesel fuel as the working fluid with density and viscosity of 830kg/m3 and 2.65×10⁻³kg/m/s, respectively. The rig was designed to deliver fuel to the optical nozzle assembly under steady-state flow conditions and by transient injections of 2 ms duration, with both flow-states capable of reaching and maintaining a 2000 bar rail pressure, Prail. In the transient operation fuel was
delivered to the optical nozzle by means of a modified common-rail fuel injector, positioned upstream of the nozzle assembly, which contained a single 1 mm nozzle hole and acted as a high-speed valve producing the sac pressure trace shown in Figure 1b at
0 0.5 1 1.5 2 Time (ms)
0
0
.6
1
.2
2
.0
P
re
ss
u
re
(
P
a
10
-8)
[image:4.612.98.520.404.554.2]4
Prail = 2000bar. Nozzle back pressure, Pback, was created by injecting into a pressurised
nitrogen chamber downstream of the nozzle.
Imaging of the internal nozzle flow was carried out using two methods: High-speed imaging of the nozzle flow was captured using a Photron APX-RS high-speed camera, operating with a resolution of 512x512 pixels at 10,000 frames per second and fitted with a Nikon Micro-Nikkor 200mm lens set to f/2.8 and fitted with lens extension rings to provide a magnified image of the sac volume flow region below the needle. This was synchronised to an Oxford Lasers LS-20-50 copper vapour laser, which provided back-illumination of the optical nozzle via three optical fibres directed onto a diffusion screen placed at the rear of the nozzle assembly, producing a 25 ns illumination time per camera frame. Additionally, high resolution single-shot imaging of the nozzle flow was obtained using a 7.5MP Olympus E-330 DSLR camera, with illumination provided by a fluorescein dye cell placed at the rear of the nozzle assembly, pumped by a single 8 ns pulse from an Nd:YAG laser operating at λ=532 nm and synchronised to the camera shutter.
CFD Simulations
In the absence of quantitative measurements of the pressure and velocity fields in the areas where cavitation forms and develops, the computational fluid dynamics (CFD) code of (Giannadakis, Gavaises et al. 2008) was utilised; this model has been validated against a number of experimental data available for cavitating nozzles and has been further extended to consider effects related to injection under high pressure conditions (Theodorakakos A., Mitroglou N. et al. 2012); thus details of the model are not repeated here. Use of CFD was considered essential not only for assisting in the interpretation of the acquired images but also during the design process of the specific test nozzles utilised here. Model predictions guided the nozzle design as they indicated zones of strong vortex formation upstream of the nozzle holes that have now been verified experimentally by the presence of cavitation strings. The computational grids utilised comprised of ~2.5million computational cells. Pressure boundary conditions given by the experimental conditions simulated were employed at both the inlet and exit boundaries of the geometry shown in figure 2a as. As the flow within the nozzle is turbulent (Reynolds number defined on the basis of the mean injection velocity and hole diameter is of the order of 5x10⁴), the realisable k-ε model of turbulence with enhanced wall functions was utilised. The liquid flow was assumed incompressible; finally, regarding spatial discretisation, the 2nd order
scheme of (Jasak, Weller H.G et al. 1999) was used.
Results and discussion
We proceed now to the presentation of the results. These are divided into two sections, starting from the steady-state operation and moving afterwards to the transient cases.
Steady operation
The first stage of the investigation used the rig in its steady-state configuration. The continuity of the string formation characteristics across all values of Prail tested, given a
5
quality through the use of borosilicate optical plates. Therefore, testing was undertaken with fuel injection conditions of Prail = 150 bar, Pback = 20 bar. Figure 3 shows
representative results for each of the hole spacing configurations.
Figure 3: Representative flow images obtained at the three different nozzles tested. [Prail = 150 bar, Pback = 20 bar]
Two distinct two-phase flow structures are observed: the ‘bridging’ string that connects the two holes and two vertical strings, one in each hole, appearing to the side of the bridging string. The formation of the bridging string in the narrow-spacing case and its absence in the wide case, confirmed the hypothesis that the formation of the vortex depends on hole spacing and the subsequent interaction of vortices from both holes. High-speed video analysis showed the appearance of the bridging string in the narrow case was intermittent but frequent. The two vertical strings were also observed to appear intermittently and frequently, though more often than the bridging string with their location with respect to the hole edge (on the x-axis) remaining largely constant; the vertical strings typically appearing in 90% of captured frames and the bridging string in 20% of captured frames. The absence of the bridging string in the wide case resulted in the increased stability of the vertical string formation, where the two vertical strings were observed in both holes in almost every frame of the high speed video.
Figure 4. CFD simulations of the flow inside and upstream of the injection hole inlet (a) Flow lines coloured according to velocity magnitude and showing how the flow enters into the three
Narrow Standard
Wide
(a) (b) (c)
[image:6.612.116.498.125.279.2] [image:6.612.96.523.504.690.2]6
injection holes for standard-spacing (b) vortex core illustration for standard spacing and (c) vortex core illustration for wide spacing nozzles. The core of the recirculation zones depicted coincide with the bridging string and the two side strings. [Prail = 150 bar, Pback= 20 bar]
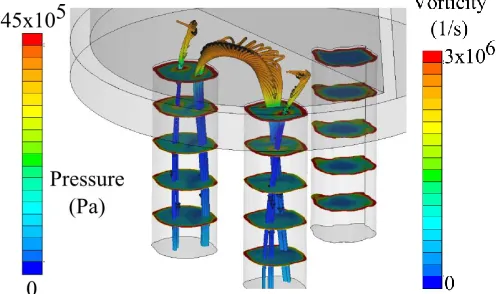
CFD simulations provide clear indication of the flow distribution inside and above the injection holes that lead to the formation of the observed structures. Figure 4a shows the flow path with the expected region of vortex formation located in the asymmetric entrance-flow to the two rearward holes of the multi-hole plate. Figure 4b and 4c depict flow lines on the horizontal mid plane between the hole’s entry and the bottom of the needle for the standard and wide hole spacing nozzles, respectively. The two counter-rotating vortices are evident as the swirling flow enters the injection holes located below the needle. Along the plane of symmetry, the flow has to turn either to the left or to the right, resulting to the formation of two counter-rotating vortices within each of these two adjacent injection holes. As the outer spinning motion upstream of the injection hole occupies a larger flow area and has a larger angular momentum, the outer vortex is stronger, as indicated by the larger vorticity (|rot u|) values calculated. The bridging vortex connects the two inner vortices. This vortex is weaker, as the almost half values of vorticity magnitude indicates. Increase of the distance between the holes isolates these two inner vortices that now develop independently and are not connected anymore. It is also clear that the front hole, which is effectively fuelled by the flow entering directly from upstream (see Figure 4a) without significant rotational motion, is free of cavitation strings, as high speed images have also confirmed. Figure 5 provides further insight to the nozzle flow; this time the streamlines of the liquid vortex have been isolated from the rest of the flow and they have been coloured according to pressure. The plots indicate that in the area where string cavitation develops, the pressure is similar to the rail pressure, which is much higher than the fuel’s vapour pressure. As the flow enters into the injection hole, a sharp pressure drop is realised with pressure falling below the fluid’s vapour pressure; as a result geometry-induced cavitation is formed at the hole inlet which both simulations and experiments (not reported here in detail – see Arcoumanis, Flora et al. (1999)) have revealed. Moreover, the contours of the vorticity magnitude plotted on planes normal to the injection hole’s axes along their length are also depicted on Figure 5. The images reveal the double-vortex structure forming inside the injection holes with the outer vortex that coincides with the vertical strings exhibiting higher vorticity values relative to the one forming the bridging string.
[image:7.612.185.433.541.688.2]7
local pressure and contours according to vorticity magnitude [Prail = 150 bar, Pback= 20
bar, standard hole spacing]
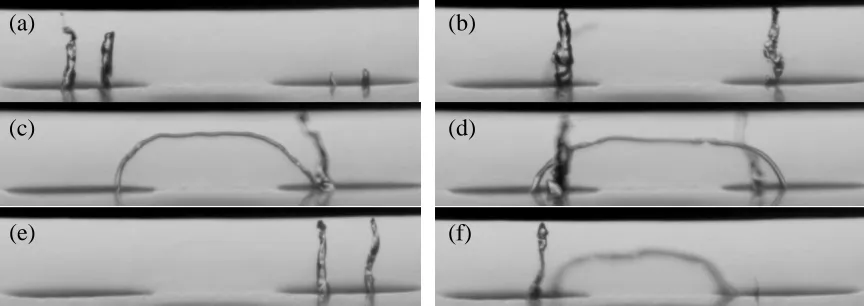
Figure 6. High resolution images of cavitation string variation in the standard
hole-spacing geometry. Prail = 150 bar, Pback= 20 bar
It should be noted that although these RANS simulations do indicate that strings develop at the core of the vortices present inside and in between the injection holes, in reality these vortices are time dependent. Previous experimental studies have indicated that cavitation strings are unstable (Roth, Giannadakis et al. 2005; Andriotis 2009); they form, appear and disappear in a transient mode even at fixed needle lift and flow rate conditions. These have been also confirmed particularly in the standard nozzle which exhibited significant flow instabilities. Figure 6 provides representative examples of the variation in appearance of the cavitation strings as captured using high-resolution single-shot imaging. These images were taken under the same steady-state flow conditions as in figure 3. Heightened detail of the cavitation string surface can be observed, and the depth of field created by the lens system (of the order of ten microns) suggests a variation in location of certain features along the y-axis. This is particularly evident in images (c), (d) and (f) of figure 6 where the bridging string and vertical string(s) appear in different focal planes. In image 6(d) it can be seen that the bridging string appears behind the vertical string of the left hole and in-front of the vertical string in the right hole.
However, this flow structure instability was not apparent in previous testing, carried out under transient injection conditions for this geometry (Reid et al. 2010). Here, with sufficient nozzle-flow velocity during a 2 ms injection event, there was no evidence of the erratic flow features seen in Figure 6. To investigate whether the injection conditions and nozzle-flow velocity could similarly affect the cavitation characteristics in the wide-spacing geometry, and potentially induce formation of the bridging string, a study of nozzle flow characteristics at injection pressures up to 2000 bar was undertaken for both steady-state and transient injection conditions. Due to the previously described relative stability of the narrow-spacing geometry, this geometry was not included as part of the further study. A representative frame from the video captured at Prail = 2000 bar,
Pback = 1 bar under steady-state flow conditions is shown in figure 7(a); during the
high-pressure phase of testing back high-pressure was minimised to Pback = 1 bar to maximise the
cavitation number and thus optimise the flow conditions for observable string cavitation
(a) (b)
(c) (d)
[image:8.612.94.526.113.266.2]8
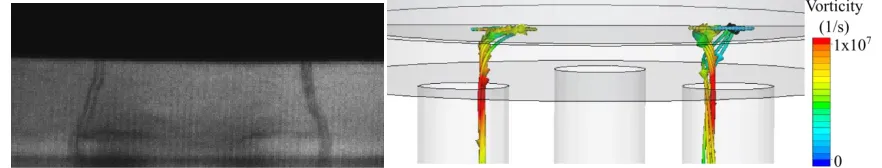
formation. As was observed during the lower pressure testing, the two vertical strings, extending out of the two rear holes appeared consistently but no formation of the bridging string was observed; this was the case for all pressures observed up to 2000 bar. Corresponding model predictions are shown on Figure 7b. It is interesting to notice that at elevated pressures the two counter-rotating vortex system that was developing under lower pressures both upstream and inside the injection holes has now combined to form just one central vortex that follows a helical motion. The vorticity magnitude values simulated in the area where the vertical strings develop are now almost double compared to those found on the bridging vortex. This vortex now originates from the same single vortex forming inside the injection hole which splits into two branches within the sac volume. It is thus clear that this time the flow exhibits a different structure compared to the lower pressures which explains the absence of bridging strings at elevated pressures.
Figure 7. (a) Representative flow image at elevated pressure of Prail=2050bar and
Pback=1bar for the standard spacing nozzle and (b) CFD simulation of the flow under the
same flow conditions; streamlines coloured according to vorticity magnitude
Transient operation
The apparent increase in coherence of the flow structure observed during transient injections, described previously, was again apparent, with the results for the transient injections into the wide hole spacing geometry differing from the steady state observations. Figure 8 shows representative images from the different fuel rail pressures that were tested for this geometry. The initial increases in Prail, from 500 bar to 1000 bar,
saw negligible difference in the physical appearance of the cavitation strings. At Prail = 1500 bar, density fluctuations, visible as the transient refraction of light through the
sac volume, became prominent in the region where the bridging string was expected to form, appearing laterally between the two vertical strings. The formation of a bridging string was not observed at this pressure however. In marked contrast to the previous results, obtained from the steady-state flow experiment, the formation of the bridging string became clearly visible at Prail = 2000 bar, shown in Figure 8. Subsequent testing
[image:9.612.86.527.252.336.2]9
Figure 8. Frame grabs of the cavitation string formation in the sac volume for the wide hole-spacing geometry for Prail = 500 bar, Prail = 1000 bar, Prail = 1500 bar and Prail = 2000 bar.
Pback = 1 bar. t = 1 ms ASOI
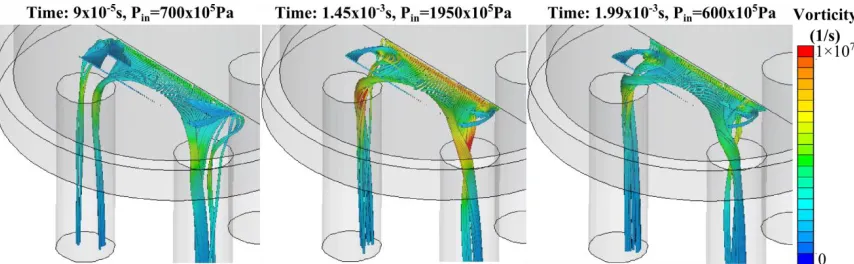
The formation of the bridging string in this nozzle geometry under transient flow conditions was also captured by the CFD simulations. Representative results can be seen in figure 9 at three time steps, corresponding to the start, peak injection pressure and close to end of injection; the actual pressure value at the selected images can be seen from the previous figure 2(b). The images confirm an increase in the coherence of the nozzle flow structure compared to that seen during continuous steady-state flow conditions, allowing the formation of the bridging string to take place where it had previously been supressed. This disparity between the nozzle flow characteristics of the two flow regimes demonstrated how the rapid increase in fluid pressure and flow-rate through the optical nozzle at the start of the fuel injection event played a critical role in establishing the subsequent internal nozzle flow; it is obvious that can have implications to the operation of diesel fuel injectors as such structures can appear and become more frequent with the expected increase in injection pressure that will be realised in such applications.
Figure 9: CFD simulations of the flow vortices at three time instances during the transient operation; time corresponds to that in Figure 2b.
Conclusions
The results of this experimental study and the additional insight provided by the modelling work allow us to conclude that:
500 bar 1000 bar
[image:10.612.96.520.72.220.2] [image:10.612.95.522.476.608.2]10
1. The occurrence of the hole-to-hole interaction of cavitation strings, observed here as the bridging string, was found to be affected by the spacing between adjacent holes. As hole spacing was increased the vorticity of the bridging vortex inside the injection holes observed at relatively lower pressures, was reduced thus eliminating the appearance of the bridging string and allowing formation of only the vertical strings. 2. Increase of injection pressure has a profound effect on the vortex flow upstream and
inside the injection hole. The two counter-rotating vortices were reduced to a single helical vortex; the bridging vortex was realised as a side branch of this vortex having however vorticity levels much lower than the vertical vortex.
3. The relationship between flow-rate and the observable nozzle flow structure was ultimately dependent on the levels of organised vorticity in the flow; highlighted by the significant differences between the results observed for steady-state and transient flow conditions. The dissipation of vorticity during steady state flow conditions led to an increase in disorganised vorticity, or turbulence, in the nozzle sac volume, inhibiting the formation of a coherent vortex between the two adjacent holes. Under transient flow conditions in the same nozzle geometry, the levels of vorticity, imparted into the flow by its rapid initial acceleration, dominated the small-scale turbulence between the holes, leading to the formation of a coherent vortex that could be sustained for the duration of the 2 ms injection and allowing formation of the bridging string at elevated pressures.
4. As a consequence, the interpretation of fuel injector nozzle flow characteristics based on steady-state flow analysis produced results that differed significantly from those of a real transient fuel injection event.
Acknowledgements
This work has been technically and financially supported by Caterpillar Inc. and the UK Technology Strategy Board. Project No, TP/3/DSM/6/I/15289. This project was co-funded by the Technology Strategy Board's Collaborative Research and Development programme, following an open competition.
The Technology Strategy Board is an executive body established by the Government to drive innovation. It promotes and invests in research, development and the exploitation of science, technology and new ideas for the benefit of business - increasing sustainable economic growth in the UK and improving quality of life.
References
Andriotis, A., M. Gavaises, et al. (2008). "Vortex flow and cavitation in diesel injector nozzles." Journal of Fluid Mechanics 610(1): 195-215.
Andriotis, A. G. M. (2009). "Influence of vortex flow and cavitation on near-nozzle Diesel spray dispersion angle." Atomization and Sprays 19(2): 247-261.
Arcoumanis, C., M. Badami, et al. (2000). "Cavitation in Real-Size Multi-Hole Diesel Injector Nozzles." SAE Transactions Journal of Engines, 2000-01-1249 109-3. Arcoumanis, C., H. Flora, et al. (1999). "Investigation of cavitation in a vertical
11
Arcoumanis, C., M. Gavaises, et al. (1998). "Analysis of the flow in the nozzle of a vertical multi-hole diesel engine injector." Transactions Journal of Engines, SAE paper 980811, SAE Transactions 107(3).
Badock, C., R. Wirth, et al. (1999a). "Investigation of cavitation in real size diesel injection nozzles." International Journal of Heat and Fluid Flow 20(5): 538-544. Badock, C., R. Wirth, et al. (1999b). The Influence of Hydro Grinding on Cavitation
inside a Diesel Injection Nozzle and Primary Break-Up under Unsteady Pressure Conditions. Proc. ILASS-EUROPE, Toulouse, France.
Blessing, M., G. König, et al. (2003). "Analysis of Flow and Cavitation Phenomena in Diesel Injection Nozzles and its Effect on Spray and Mixture Formation." SAE Paper 2003-01-1358.
Chaves, H., C. Kirmse, et al. (2000). The Influence of Nozzle Inlet Curvature on Unsteady Cavitation in Transparent Diesel Injection Nozzles. 1st International Colloquium on Microhydrodynamics, Paris, France.
Chaves, H., M. Knapp, et al. (1995). "Experimental Study of Cavitation in the Nozzle Hole of Diesel Injectors Using Transparent Nozzles." SAE Paper 950290.
Gavaises, M., D. Papoulias, et al. (2007). "Link between cavitation development and erosion damage if Diesel fuel injector nozzles." SAE Paper 2007-01-0246.
Giannadakis, E., M. Gavaises, et al. (2008). "Modelling of cavitation in diesel injector nozzles." Journal of Fluid Mechanics 616(1): 153-193.
Jasak, H., Weller H.G, et al. (1999). "High resolution NVD differencing scheme for arbitrarily unstructured meshes." International Journal for Numerical Methods in Fluids 31(2): 431-449.
Kim J. H., Nishida K., et al. (1997). Characteristics of internal flow in a diesel injection nozzle. ICLASS, Seoul, Korea.
Reid, B. A., Hargrave G.K., et al. (2010). "An investigation of string cavitation in a true-scale fuel injector flow geometry at high pressure." Physics of Fluids 22(031703). Roth, H., E. Giannadakis, et al. (2005). "Effect of multi-injection strategy on cavitation
development in diesel injector nozzle holes." SAE transactions 114(3): 1029-1045.
Schmidt, D. P. and Corradini M.L. (2001). "The internal flow of diesel fuel injector nozzles: a review." International Journal of Engine Research 2: 1-22.
Soteriou, C., R. Andrews, et al. (1995). "Direct injection diesel sprays and the effect of cavitation and hydraulic flip on atomization." SAE technical paper 950080.
Soteriou, C., M. Smith, et al. (1998). Diesel injection: laser light sheet illumination of the development of cavitation in orifices. IMechE Paper C529/018/98.
Soteriou C., Andrews R., et al. (1995). "Direct Injection Diesel Sprays and the Effect of Cavitation and Hydraulic Flip on Atomization." SAE Transactions, Journal of Engines Paper No 950080.
Theodorakakos A., Mitroglou N., et al. (2012). Simulation of heating effects caused by extreme fuel pressurisation in cavitating flows through Diesel fuel injectors. CAV2012, Singapore.
Walther, J. (2002) Quantitative Untersuchungen der Innenströmung in kavitierenden Dieseleinspritzdüsen, PhD. Thesis, TU Darmstadt
12

![Figure 3: Representative flow images obtained at the three different nozzles tested. [Prail = 150 bar, Pback = 20 bar]](https://thumb-us.123doks.com/thumbv2/123dok_us/1524048.104980/6.612.96.523.504.690/figure-representative-images-obtained-different-nozzles-tested-prail.webp)