FOR
E
XTREME
A
PPLICATIONS
T
HESIS BYS
COTTN
OLANR
OBERTSI
N PARTIAL FULFILLMENT OF THE REQUIREMENTS FOR THE DEGREE OFD
OCTOR OFP
HILOSOPHYC
ALIFORNIAI
NSTITUTE OFT
ECHNOLOGYP
ASADENA,
C
ALIFORNIA2014
©
2013
N
OTHING IS TOO SMALL…
P
UT DOWN IN RECORD EVEN YOUR DOUBTS AND SURMISES…
W
E LEARN FROMF
AILURE,
N
OT FROMS
UCCESS!
Metallic glasses have typically been treated as a “one size fits all” type of material. Every
alloy is considered to have high strength, high hardness, large elastic limits, corrosion resistance,
etc. However, similar to traditional crystalline materials, properties are strongly dependent
upon the constituent elements, how it was processed, and the conditions under which it will be
used. An important distinction which can be made is between metallic glasses and their
composites. Charpy impact toughness measurements are performed to determine the effect
processing and microstructure have on bulk metallic glass matrix composites (BMGMCs).
Samples are suction cast, machined from commercial plates, and semi-solidly forged (SSF). The
SSF specimens have been found to have the highest impact toughness due to the coarsening of
the dendrites, which occurs during the semi-solid processing stages. Ductile to brittle transition
(DTBT) temperatures are measured for a BMGMC. While at room temperature the BMGMC is
highly toughened compared to a fully glassy alloy, it undergoes a DTBT by 250 K. At this point, its
impact toughness mirrors that of the constituent glassy matrix. In the following chapter,
BMGMCs are shown to have the capability of being capacitively welded to form single,
monolithic structures. Shear measurements are performed across welded samples, and, at
sufficient weld energies, are found to retain the strength of the parent alloy. Cross-sections are
inspected via SEM and no visible crystallization of the matrix occurs.
Next, metallic glasses and BMGMCs are formed into sheets and eggbox structures are
tested in hypervelocity impacts. Metallic glasses are ideal candidates for protection against
micrometeorite orbital debris due to their high hardness and relatively low density. A flat single
layer, flat BMG is compared to a BMGMC eggbox and the latter creates a more diffuse projectile
successfully contained by the third.
A large series of metallic glass alloys are created and their wear loss is measured in a pin
on disk test. Wear is found to vary dramatically among different metallic glasses, with some
considerably outperforming the current state-of-the-art crystalline material (most notably
Cu43Zr43Al7Be7). Others, on the other hand, suffered extensive wear loss. Commercially available
Vitreloy 1 lost nearly three times as much mass in wear as alloy prepared in a laboratory setting.
No conclusive correlations can be found between any set of mechanical properties (hardness,
density, elastic, bulk, or shear modulus, Poisson’s ratio, frictional force, and run in time) and
wear loss. Heat treatments are performed on Vitreloy 1 and Cu43Zr43Al7Be7. Anneals near the
glass transition temperature are found to increase hardness slightly, but decrease wear loss
significantly. Crystallization of both alloys leads to dramatic increases in wear resistance. Finally,
wear tests under vacuum are performed on the two alloys above. Vitreloy 1 experiences a
dramatic decrease in wear loss, while Cu43Zr43Al7Be7 has a moderate increase. Meanwhile, gears
are fabricated through three techniques: electrical discharge machining of 1 cm by 3 mm
cylinders, semisolid forging, and copper mold suction casting. Initial testing finds the pin on disk
test to be an accurate predictor of wear performance in gears.
The final chapter explores an exciting technique in the field of additive manufacturing.
Laser engineered net shaping (LENS) is a method whereby small amounts of metallic powders
are melted by a laser such that shapes and designs can be built layer by layer into a final part.
The technique is extended to mixing different powders during melting, so that compositional
gradients can be created across a manufactured part. Two compositional gradients are
cross-sectional x-ray diffraction, and only the anticipated phases were present. 304L stainless
steel to Invar 36 was created in both pillar and as a radial gradient. It combines strength and
weldability along with a zero coefficient of thermal expansion material. Only the austenite phase
is found to be present via x-ray diffraction. Coefficient of thermal expansion is measured for four
First, I would like to thank my advisor, Bill Johnson. Back when I was doing graduate
school interviews, I remember Bill was the first professor I interviewed with. An hour later, I felt
torn. If every professor was as excited about their work as Bill, how would I ever choose where
to attend school? After visiting a few more schools the choice was obvious. I would be attending
Caltech. When I started in the lab in the fall of 2007, Aaron Wiest taught me the ropes and
helped guide me through my candidacy project.
After Aaron graduated, I found myself working with Doug Hofmann on semisolid forging
of metallic glass composites. Doug continued as a mentor to me throughout my graduate
career, and I look forward to working with him in the future in our lab at the Jet Propulsion
Laboratory.
I’d also like to thank all of my fellow labmates. Henry Kozachkov for always being a
sympathetic ear and being able to make me laugh harder than anyone else. Joanna Kolodziejska
for all her help with my later projects, and being willing to actually get stuff done when the rest
of us were at the point of giving up. Andrew Hoff for being continually eager to learn about
everything we’ve been doing in the lab, and help rekindle my passion for what I had been doing
throughout my graduate career. Xiao Lu for saving my bacon a number of times when I was
TAing APh 105. Dale Conner for our many discussions on research possibilities. It’s a shame our
melt spinner had to meet the fate it did. Marios Demetriou for always keeping group meeting
interesting.
My classmates at Caltech were also a continual source of inspiration. The first two years
Tiwary. During my time here at Caltech, I’ve also spent a lot of time TAing classes. Thank you to
everyone that attended recitations, asked questions, and helped me make the best of nine
terms of teaching assistant duties. The ISP lunches hosted by Daniel Yoder and Laura Flower Kim
offered a weekly chance to kick back, enjoy some good food, and learn about my colleagues
from all over the world. Their sponsoring of the summer softball team, the Asteroid Pirates, I
co-captained with Lisa Mauger also gave a lot of us a fun way of getting some sun.
Finally, I’d like to thank all those closest to me. My parents have always done their best
to stand by my decisions and support me throughout my struggles. It didn’t matter if it was
standing up for my argument with a teacher on displaying my artwork in elementary school or
moving 3000 miles from home to attend grad school. Last, but certainly not least, is my partner
through this long journey, Sanda Cea. Her faith in my ability to finish my degree at Caltech even
prior to my acceptance here has helped me stay positive time and time again. There’s no way I
would have been able to finish my thesis without the many nights you kept me company in the
office while I battled my way through this document. If you ever decide to write a thesis
T
ABLE OFC
ONTENTSTABLE OF CONTENTS ix
LIST OF FIGURES x
LIST OF TABLES xv
CHAPTER 1-INTRODUCTION 1
CHAPTER 2-EFFECTS OF PROCESSING AND TEMPERATURE ON CHARPY IMPACT TOUGHNESS IN METALLIC
GLASSES AND METALLIC GLASS MATRIX COMPOSITES 17
CHAPTER 3-CAPACITIVE JOINING AND ASSEMBLY OF BULK METALLIC GLASS MATRIX COMPOSITES 47
CHAPTER 4-METALLIC GLASSES AS SHIELDING FOR HYPERVELOCITY IMPACTS 59
CHAPTER 5-WEAR BEHAVIOR OF METALLIC GLASS GEARS 73
CHAPTER 6-CHARACTERIZATION OF TWO GRADIENT ALLOYS FABRICATED BY LASER ENGINEERED NET SHAPING 115
APPENDIX A-COMPLETE TABLE OF MEASURED PROPERTIES FOR WEAR TESTING 133
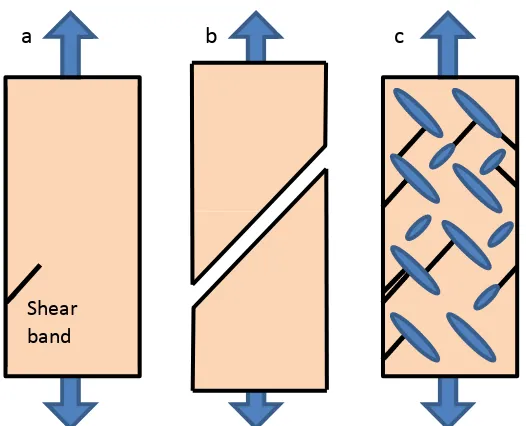
FIGURE 1-1:(A)A SHEAR BAND BEGINNING TO GROW IN A BMG.(B)FAILURE BY A SINGLE SHEAR BAND IN A BULK GLASS.
(C) MULTIPLE SHEAR BANDS GROWTH BEING ARRESTED BY A SECONDARY PHASE. ... 3
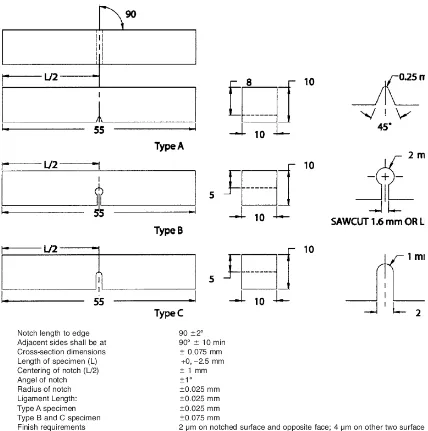
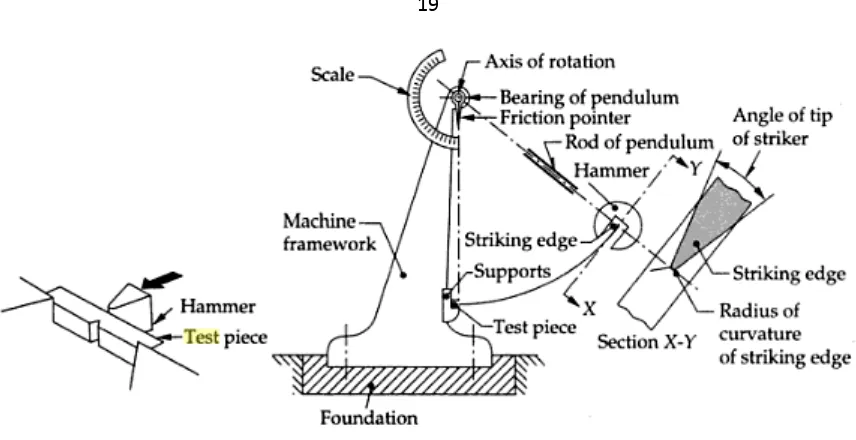
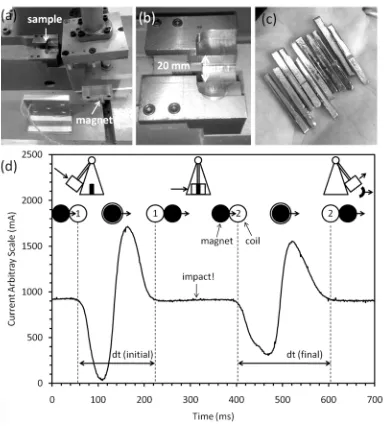
Figure 2-1: Geometry required for an ASTM standard Charpy impact test.1 Type A is the geometry modified for our testing due to limitation in casting thickness in BMG alloys. ... 18 Figure 2-2: A schematic of a Charpy impact test.2 ... 19 Figure 2-3: Instrumented small-scale Charpy testing. (a) The pendulum hammer has been stripped of
excess mass to reduce the impact energy. A plastic extension has been built to hold the magnet. As the pendulum swings, the magnet passes a coil before and after impact, which registers a current. (b) The modified sample holder has a shorter span length of 20 mm for compact Charpy samples. (c) Suction cast (SC) samples of the alloy DV1. (d) Induced current obtained from an impact test on DH3 using a digital oscilloscope. The hammer’s speed is reduced during impact, which broadens the second peak. The width of the coils and magnets are known to be dx = 1 cm, so the velocity of the hammer can be determined through v = dx/dt. The energy during the impact is
E
=
1
2
mv
2. ... 24 Figure 2-4: The temperature calibration curve for DH3 (Zr39.9Ti33.9Nb7.6Cu6.4Be12.5). ... 25 Figure 2-5: Compact Charpy impact toughness values from 11 alloys tested; one bulk metallic glass (BMG),six bulk metallic glass matrix composites (DH3, DV1, LM2) in various processing conditions, and four crystalline alloys. The processing conditions are commercially cast plate (CCP), crystalline (xtal), suction cast (SC), and semisolidly forged (SSF). The maximum hammer energy for the low drop height is displayed on the plot along with a scaled estimation of the full-sized Charpy toughness. On average, seven samples of each alloy were tested, and the average is plotted as a red circle. ... 28 Figure 2-6: Fracture surfaces from six BMGMC samples tested in this study, along with their impact
energy. X-ray scans from SSF DH3 and the completely crystalline state are also shown. Although the body-centered cubic dendrites remain in the crystalline sample, the matrix is no longer amorphous, as evident from the numerous starred peaks. Also shown are magnified fracture surfaces from SSF, DH3, and LM2, showing the difference in the fracture pattern. All images are of the fracture surface taken with backscattered electrons in a SEM. ... 30 Figure 2-7: (a) A backscattered SEM micrograph showing a fractured specimen of commercially cast LM2.
Despite the large, coarse dendrites, other factors (like oxygen content and partial crystallization) make this the most brittle alloy tested. (b) The edge of the crack from a region in (a) demonstrating very little toughness. (c) Another region near the edge of the crack showing that several shear bands have formed. (d) A region where the matrix has crystallized into an unknown brittle phase. ... 31 Figure 2-8: Backscattered SEM micrographs from the BMGMC DV1 (40% dendrite). (a) Crack originating at
the notch and then propagating through a SSF sample during a compact Charpy test. (b),(c) Higher magnification of shear bands interacting with the Ti-based dendrites (e) Crack propagating through a SC sample during compact Charpy test. (e),(h) Higher magnification micrographs of shear bands in the SC sample along with the nominal microstructure. ... 33 Figure 2-9: (a) Crack arrest and branching after impact in a SSF sample. (b) Near the edge of the crack,
many shear bands have formed and been arrested by the soft dendrites. (c) Magnification of a region in (a) demonstrating that even far away from the crack, shear bands still form in the glass matrix. (e) Crack propagating through a SC sample of DH3 and (f),(g) higher magnification images of the shear bands and microstructure. ... 35 Figure 2-10: Charpy impact toughness vs. temperature for pure Sn and the BMG Vitreloy 1 compared with
literature, despite the smaller specimen size. An estimate of the full-sized Charpy toughness is shown on the right axis. All the data is shown. ... 38 Figure 2-11: Charpy impact toughness vs. temperature for the BMGMC DH3 and its glass matrix, made
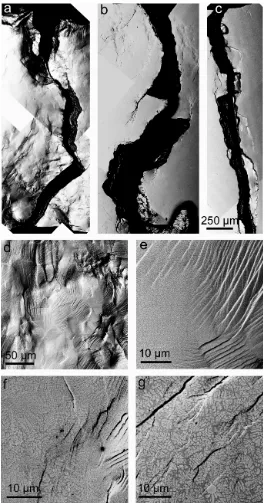
separately. The curves represent the averages all of the data, which are also shown. Both alloys were produced via suction casting and notched identically... 38 Figure 2-12: (a-c) SEM micrographs from the surface of polished Charpy specimens in the BMGMC DH3
showing how the crack morphology changes with temperature. (a) 300K, (b) 163 K, and (c) 100 K. (d-e) Enlarged micrographs of the shear bands on the surface of the DH3 sample impacted at room temperature. Similar images are shown for cryogenic specimens, (f) 163 K and (g) 100 K. ... 41 Figure 2-13: (a) SEM micrograph of the fracture surface from the monolithic BMG DH3-Matrix impacted at
300K. (b) DH3-Matrix 100 K. (c) Fracture surface from BMGMC DH3 at 100 K. In all samples the notch is at the bottom of the images. ... 42 FIGURE 3-1:(A)MAXIMUM SHEAR STRESS VERSUS WELDING POWER FOR PLATES OF THE BMGMCDH1 THAT WERE SUBJECTED
TO FOUR WELDS FOR EACH POWER.THE SCHEMATIC SHOWS THAT THE GEOMETRY OF THE PLATES WAS DESIGNED SO THAT THE TENSION TEST APPLIES PURE SHEAR TO THE WELDED REGIONS.THE RED SOLID CIRCLES REPRESENT FAILURE IN THE WELDS WHILE THE FILLED BLUE CIRCLES REPRESENT FAILURE OUTSIDE THE WELDED REGION.(B-C)EXAMPLES OF HOW COPPER ELECTRODES CAN BE BENT TO DO “PROJECTION WELDING.” IN THIS CASE, A SQUARE HONEYCOMB OF THE
BMGMC DH1 IS WELDED TOGETHER FROM CORRUGATED STRIPS.(D)A TRUSS WELDED FABRICATED BY WELDING TOGETHER 1 MM DIAMETER RODS OF THE BMGMCDH1 AT THE NODES. ... 50
FIGURE 3-2:(A)AN OPTICAL IMAGE OF THE NODES BETWEEN TWO WELDED DH1 EGG-BOXES SHOWING THE EXTENT OF FLOW DURING THE WELDING.(B-E)PROGRESSIVELY ENLARGED SEM MICROGRAPHS SHOWING THE MICROSTRUCTURE OF THE WELDED REGIONS.THE LOW MAGNIFICATION MICROGRAPH IN (B) SHOWS THE THAT MATERIAL HAS FLOWED FROM UNDER THE WELDING ELECTRODES.AT HIGHER MAGNIFICATION (C) THERE IS A CLEAR SEAM BETWEEN THE TWO WELDED PIECES THAT DISAPPEARS IN THE LOCATION UNDER THE ELECTRODES, INDICATING A SOLID WELD.(D-E)ENLARGEMENTS OF THE WELD REGION SHOWING FLOW LINES FROM THE JOINING BUT ALSO SHOWING DENDRITES THAT WERE UNAFFECTED BY THE FLOWING GLASS MATRIX.THE WELD IS COMPRISED ON THE GLASS MATRIX FROM EACH SAMPLE HAVING BEEN HEATED AND JOINED UNDER THE COMPRESSIVE LOADS WITHOUT THE DENDRITES BEING AFFECTED.THE DENDRITE MICROSTRUCTURES IN
(D-E) ARE NOMINAL FOR THE SAMPLE OUTSIDE THE WELDED REGION. ... 52
FIGURE 3-3: QUASISTATIC COMPRESSION TESTING OF TWO DH1 EGG-BOXES THAT WERE WELDED TOGETHER AT FIVE LOCATIONS. THE BLUE CURVE REPRESENTS A WELDING POWER OF 20 J (PICTURED ON TOP) WHILE THE RED CURVE REPRESENTS 40 J(PICTURED ON BOTTOM).UNDER COMPRESSION, THE SAMPLES EXPERIENCE A MIXED-MODE BUCKLING FROM EDGE EFFECTS WHICH ULTIMATELY BREAKS THE WELD.AT 40 J, THERE IS A SIGNIFICANT AMOUNT OF BUCKLING BEFORE THE WELD FAILS, INDICATING A HIGHER QUALITY WELD.THIS IS VERIFIED BY THE COMPRESSION DATA, WHICH SHOWS A HIGHER ENERGY ABSORPTION IN THE 40 J WELDED SAMPLES. ... 54 FIGURE 4-1:A SCHEMATIC OF A WHIPPLE SHIELD WITH A FRONT BUMPER, EMPTY SPACE, AND A REAR WALL TO CATCH DEBRIS.
(B)IMPACTS WILL CREATE A CLOUD OF DEBRIS BOTH FORWARDS AND BACKWARDS.(C)IF THE DEBRIS CLOUD IS NOT SUFFICIENTLY DIFFUSE IT CAN RESULT IN EITHER FURTHER PENETRATION OR DETACHED SPALL FROM THE REAR WALL.
IMAGE FROM REFERENCE 5. ... 61
FIGURE 4-2:HYPERVELOCITY FACILITY AND TEST SAMPLES –(A)VIEW OF THE NASAAMES VERTICAL GUN RANGE, WHICH CONSISTS OF A TWO-STAGE LIGHT GAS GUN CAPABLE OF FIRING PROJECTILES IN TWO DIFFERENT CONFIGURATIONS TO ALLOW SIMULATIONS OF IMPACTS FROM 0.8 TO 5.5 KM/S.THE ENVIRONMENTAL TEST CHAMBER IS OVER 2 M HIGH AND THE ANGLE OF IMPACT CAN BE CHANGED USING MULTIPLE PORTS ON THE SIDE. (B)FORGING CHAMBER USED TO FABRICATE THIN PLATES AND EGGBOX STRUCTURES. (C) EXAMPLE OF A 10 G INGOT OF THE BMGMC DH1
ALLOWS FOR THE COLLECTION OF DEBRIS FROM THE IMPACT.DURING SOME IMPACTS, A WITNESS PLATE WAS USED INSTEAD TO ASSESS DAMAGE.(G)SETUP OF THE HIGH-SPEED CAMERAS USED TO CAPTURE THE IMPACT.THREE CAMERAS CAN BE SEEN IN THE IMAGE (ONE IS AT THE UPPER RIGHT). ... 64
FIGURE 4-3:COMPARISON OF SURFACE GEOMETRY DURING HYPERVELOCITY IMPACTS IN BMG COMPOSITE PANELS.(A)BACKLIT SIDE-VIEW IMAGES FROM A 3.17 MM ALUMINUM SPHERE IMPACTING A 0.6 MM THICK DH1 EGGBOX, SHOWN IN (C), AT
2.7 KM/S FOR THE FIRST 102 µS AFTER IMPACT.THE MULTI-FACETED SURFACE EFFECTIVELY DIFFUSES THE IMPACT INTO A BROAD DEBRIS CLOUD.(B)THE SAME VELOCITY IMPACT AS (A) INTO A 0.7 MM THICK BMGMC COMPOSITE SHEET.THE IMPACT CONDITIONS AND ALLOY ARE THE SAME BETWEEN (A) AND (B) BUT THE SURFACE GEOMETRY IS DIFFERENT.IN (B) THE DEBRIS CLOUD IS TIGHTLY CLUSTERED AFTER IMPACT.(C)PLOT OF LIGHT INTENSITY VERSUS FRAME NUMBER FOR THE HYPERVELOCITY TESTS IN (A,B).AS AN ESTIMATION OF ENERGY RELEASED DURING IMPACT, IMAGE ANALYSIS WAS USED TO DETERMINE THE LENGTH AND INTENSITY OF THE LIGHT.THE EGGBOX IS MUCH MORE EFFECTIVE THAN THE THIN SHEET AT DISSIPATING ENERGY.(D,E)IMAGE ANALYSIS WAS USED TO DESIGNATE A RANGE OF ANGLE OF THE DEBRIS CLOUD THAT CAPTURES AT LEAST 95% OF THE DEBRIS.THE EGGBOX GEOMETRY (D) HAS A 25° WIDER SPREAD THAN THE THIN SHEET
(E).(F,G)LONG EXPOSURE IMAGES FROM THE IMPACTS IN THE EGGBOX (F) AND THE THIN SHEET (G) ILLUSTRATING THE DIFFERENCE IN LIGHT INTENSITY DURING THE IMPACT.THE RED LIGHT IS THE LASER USED TO TRIGGER THE HIGH-SPEED CAMERA. ... 66
FIGURE 4-4: HYPERVELOCITY IMPACT OF A WELDED BMG COMPOSITE CELLULAR STRUCTURE. (A) SCHEMATIC OF THE CAPACITIVE JOINING PROCESS FOR A BMG COMPOSITE.(B)SHAPED ELECTRONS ON A SPOT WELDER WERE USED TO WELD EGG-BOXES TOGETHER.(C)SEM MICROGRAPH FROM TWO EGG-BOX PANELS WELDED TOGETHER.(D-E)EGG-BOX PANELS WHICH HAVE BEEN WELDED TOGETHER.(F)ALUMINUM HSP STRUCTURE.(G)BACKLIT SIDE VIEW OF THE THREE LAYER EGG-BOX STRUCTURE BEING IMPACTED BY A 3.17 MM ALUMINUM PROJECTILE AT 2.3 KM S-1 SHOWING PENETRATION OF THE FIRST LAYER AND SLIGHT PENETRATION OF THE SECOND LAYER.(H)PLOT SHOWING PROJECTILE DIAMETER VERSUS PROJECTILE VELOCITY FOR ALUMINUM SANDWICH PANELS WITH ALUMINUM FACESHEETS CALCULATED FROM BALLISTIC LIMIT SOFTWARE.S IS THE HEIGHT OF THE HONEYCOMBS AND T IS THE THICKNESS OF THE FACE SHEETS.(I)THE LAYERED EGG-BOX STRUCTURE LOADED INTO THE SAMPLE HOLDER.(J)A LONG EXPOSURE IMAGE SHOWING THE LIGHT GENERATED DURING THE HYPERVELOCITY IMPACT. ... 68
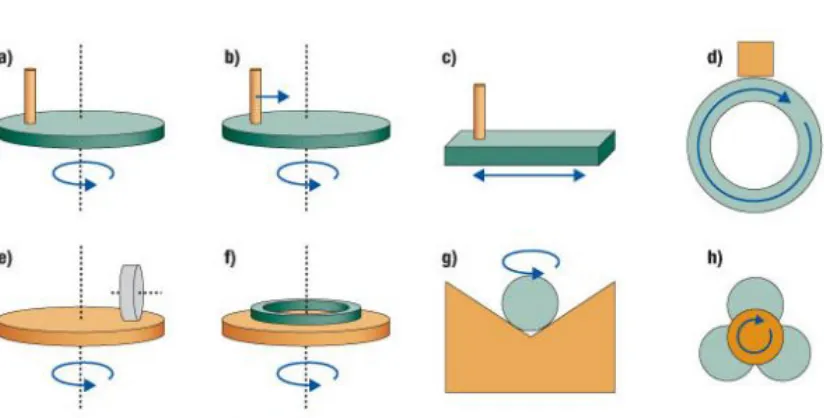
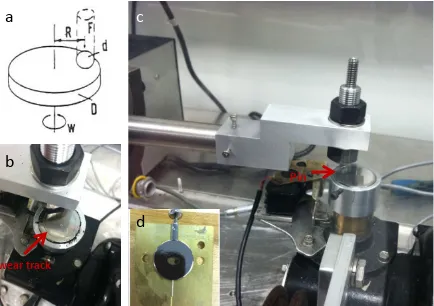
FIGURE 5-1:COMMON WEAR TEST GEOMETRIES:(A) PIN-ON-DISC WITH CIRCULAR TRACK (B) PIN-ON-DISC WITH SPIRAL TRACK
(C) PIN-ON-PLATE (D) BLOCK-ON-RING (E) DISC-ON-WHEEL (F) THRUST WASHER (G) BALL-ON-PRISM (H) FOUR BALL.PIN -ON-DISC AND PIN-ON-PLATE MAY BE IDENTIFIED AS BALL-ON-DISC OR BALL-ON-PLATE, RESPECTIVELY, IF THE PIN HAS A HEMISPHERICAL TIP.8 ... 74 FIGURE 5-2: A)A SCHEMATIC FOR A CYLINDER-ON-DISK TEST. B)HIGHLIGHTING THE MOUNTING SYSTEM FOR THE CYLINDER AND
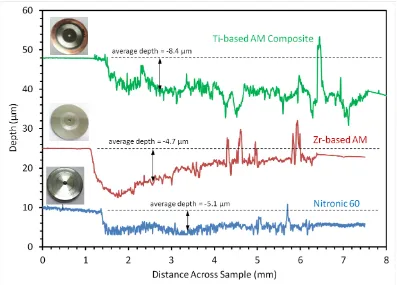
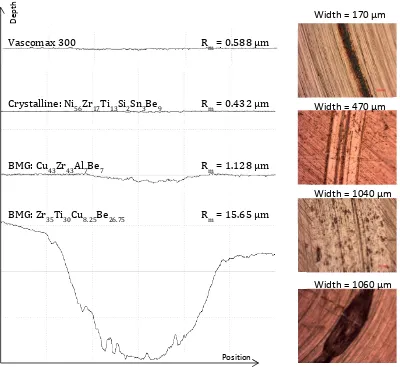
DEMONSTRATING THE LINE CONTACT. C)A CYLINDER-ON-DISK TEST IN PROGRESS. ... 79 FIGURE 5-3:PROFILOMETRY DATA FOR THREE SAMPLES.THE TI-BASED COMPOSITE AND ZR-BASED AM WERE BOTH POLISHED
TO A 0.02 UM FINISH, WHILE THE NITRONIC 60 SAMPLE WAS FINISHED ON A LATHE.INSET ARE IMAGES OF EACH SAMPLE POST-WEAR. ... 81
FIGURE 5-4: A)A SCHEMATIC DIAGRAM OF THE ASTM STANDARD PIN-ON-DISK TEST. B)AN OVERHEAD VIEW OF A POD TEST IN PROGRESS.WEAR DEBRIS CAN BE SEEN ON THE EDGES OF THE SAMPLE HOLDER. C)AN OVERVIEW OF THE POD TESTER.
THE PIN IS LOCATED AT THE END OF A LONG ARM TO ALLOW FOR PRECISE APPLICATION OF A NORMAL FORCE. D)AN AS -CAST SAMPLE PRIOR TO REMOVAL OF GATE MATERIAL. ... 83
FIGURE 5-5:A COMPARISON OF LINE PROFILES BETWEEN DIFFERENT ALLOYS AFTER A PIN-ON-DISK TEST.A LARGE DIFFERENCE CAN BE SEEN BETWEEN THE CURRENT GEAR MATERIAL,VASCOMAX, AND ONE OF THE WORST PERFORMING BMG ALLOYS TESTED. ... 88
THERE SEEMS TO BE NO TREND. B) K VERSUS E/H.THE QUOTIENT OF ELASTIC MODULUS TO HARDNESS CAN BE SEEN AS A RATIO OF ELASTICITY VERSUS RESISTANCE TO PLASTIC DEFORMATION. C)AS EXPECTED,E IS FAIRLY PROPORTIONAL TO HV. ALL ALLOYS ARE AMORPHOUS... 90
FIGURE 5-8: K, THE DIMENSIONAL WEAR COEFFICIENT VERSUS EACH OF THE ELASTIC CONSTANTS. K IS IN UNITS MM³/(N-M). .. 92
FIGURE 5-9: A)A TYPICAL FRICTION VS TIME PLOT FROM THE ALLOY CU43ZR43AL7AG7.THE RED SECTION IS THE RUN-IN PERIOD, AT WHICH THERE IS LITTLE FRICTION DUE TO A LACK OF WEAR DEBRIS ALONG THE TRACK.THE GREEN REGION IS THE STEADY STATE REGION, AND WHERE THE AVERAGE FRICTION FORCE WAS MEASURED. B) K VERSUS AVERAGE FRICTION. C) K VS RUN IN TIME. D)RUN IN TIME VERSUS AVERAGE FRICTION.ONLY AMORPHOUS ALLOYS ARE SHOWN... 93
FIGURE 5-10:WEAR LOSS AND HARDNESS DATA AFTER ANNEALING OF ZR35TI30BE27.5CU7.5 ... 95 FIGURE 5-11:WEAR LOSS AND HARDNESS DATA AFTER ANNEALING OF CU43ZR43AL7BE7 ... 96 FIGURE 5-12: A) A MICROGRAPH OF DEBRIS ALONG THE WEAR TRACK OF CRYSTALLIZED CU43ZR43AL7BE7. B) AQBSD MICROGRAPH OF THE WEAR TRACK.BRIGHTER SPOTS INDICATE HIGHER Z ELEMENTS. C)LOCATION SELECTED FOR EDS OF WEAR DEBRIS. D)LOTS OF IRON WAS FOUND IN THE WEAR TRACK, WHILE NONE WAS FOUND IN BULK AREAS OF THE SAMPLE (NOT SHOWN). ... 97 FIGURE 5-13:A COMPARISON OF WEAR COEFFICIENTS FOR TWO ALLOYS UNDER AIR AND VACUUM.THE ZRTI ALLOY SEES
NOTABLE IMPROVEMENTS, WHILE THE CUZR ALLOY HAS DECREASE PERFORMANCE. ... 100
FIGURE 5-14: A)THE SEMISOLID FORGING SETUP. B)A PREALLOYED BMGMC INGOT SET UP TO BE FORGED. C)A FINISHED COMPOSITE GEAR ONCE IT HAS BEEN REMOVED FROM THE MOLD. D)THE COMPLETED GEAR ONCE IT HAS HAD A HOLE DRILLED AND AXLE INSERTED. E) A PERSPECTIVE IMAGE SHOWING THE FINISH ON THE GEAR TEETH. F) A SEM MICROGRAPH WHERE SOME OF THE CASTING DEFECTS ARE VISIBLE. ... 102
FIGURE 5-15: A)THE GEAR MOLD FULLY ASSEMBLED WITHOUT THE CAP ON TOP. B)AN IMAGE A CAST GEAR STILL IN THE MOLD.
UPPER GATE MATERIAL STILL CONNECTS TO THE POOL IT WAS CAST FROM. C)THE BOTTOM OF THE MOLD. D)GEAR ONCE IT HAS BEEN REMOVED FROM THE MOLD. E)LEFT, GEAR WITH A KEYWAY MACHINED OUT.RIGHT, A GEAR WITH FLASHING REMOVED AND FACES GROUND TO A 16 µM FINISH. ... 103
FIGURE 5-16:THE GEAR TESTING MACHINE.KEY COMPONENTS ARE LABELED. ... 104
FIGURE 5-17:WEAR LOSS PER HOUR FOR EACH OF THE GEAR PAIRS TESTED. ... 105
FIGURE 5-18:TOP, APPEARANCE OF GEARS PRIOR TO TESTING.BOTTOM, EFFECTS OF WEARING ON EACH OF THE ALLOYS.THE ARROWS ON THE VASCOMAX IMAGE HIGHLIGHT THEIR WEAR. ... 107
FIGURE 5-19:ABOVE:DARKFIELD IMAGES OF CUZRALBE AND UNCOATED VASCOMAX GEARS.SMALL AMOUNTS OF WEAR CAN BE SEEN ON THE LEFT SIDE OF THE TEETH FOR BOTH GEARS.BELOW:THE DIFFERENCE IN EDGE PROFILES BETWEEN UNWORN (BLACK) AND WORN (RED) GEARS. ... 108
FIGURE 6-1:SCHEMATIC OF THE LASER DEPOSITION (LD) BUILDING HEADS USED TO FABRICATE GRADIENT ALLOYS.(B) IMAGE OF THE LD PROCESS FABRICATING SEVERAL TEST SPECIMENS OF THE TI-V GRADIENTS.(C)THREE GRADIENT ALLOY SPECIMENS; A HOLLOW CYLINDER, A PLATE AND A BEAM.(D)EXAMPLE OF A “FOREST” OF GRADIENT ALLOY POSTS USED TO VARY GRADIENT COMPOSITIONS. ... 117 FIGURE 6-2:(A)A BINARY TI-V PHASE DIAGRAM. Α IS HCP AND Β IS BCC.(B)TERNARY TI-AL-V PHASE DIAGRAM.THE ADDITION
OF ALUMINUM TO THE SYSTEM APPEARS TO BROADEN THE TWO PHASE REGION SLIGHTLY. THE OUTLINED PATH DEMONSTRATES THE COMPOSITIONS CONTAINED IN THE TESTED PILLAR.6,7 ... 120
FIGURE 6-3:(A)A HARDNESS VS POSITION PLOT FOR THE TI-6-4 TO V SAMPLE.(B)3D MAPPING OF XRD INTENSITIES ACROSS THE SAMPLE.A SLOW CHANGE IN DIFFRACTION ANGLES IS APPARENT IN THE BCC PHASE.(C)INDEXED DIFFRACTION PATTERNS IDENTIFIED TO IN (A).THE COEXISTANCE OF BOTH HCP AND BCC PHASES IS DEMONSTRATED. ... 121
COMPOSITIONS IN A RADIAL DIRECTION.(B)IMAGE OF TWO RADIALLY GROWN ALLOYS WHERE A 304L TO INVAR 36 GRADIENT WAS APPLIED TO A ROTATING A286 STAINLESS STEEL ROD.(C)A CALCULATED PHASE DIAGRAM AT 923K SHOWING THE GRADIENT PATH FROM 304L TO INVAR 36. PHASE DIAGRAM CALCULATED BY OUR COLLABORATOR,
RICHARD OTIS FROM PENN STATE... 124
FIGURE 6-6:(A)PRINTED AND MACHINED INSERTS FOR CARBON FIBER AND ALUMINUM HONEYCOMB SHEETS.(B)AN INSERT INSTALLED INTO A PANEL.(C)BEFORE AND AFTER A PULL-OUT TEST. ... 126
FIGURE 6-7:X-RAY SCANS WERE OBTAINED FOR THE RADIAL SAMPLE AS WELL AS FOR THE LINEAR SAMPLE OF 304L TO INVAR
36.THE RADIAL ALLOY WAS SECTIONED ACCORDING TO THE MAP ABOVE AND X-RAY SCANS WERE PERFORMED ON EACH SECTION, SHOWN AT RIGHT.ONLY THE AUSTENITE PHASE WAS DETECTED... 127
FIGURE 6-8:(A)A REPRESENTATIVE THERMAL EXPANSION MEASUREMENT PLOTTING PROBE POSITION VS. TEMPERATURE.THE FIRST CYCLE WAS ALWAYS DISCARDED SINCE IT WAS USED TO “SEAT” THE SAMPLE PROPERLY UNDER THE LOAD.(B)
EXPANSION OF THE CYLINDER VERSUS TEMPERATURE.FOUR OF THOSE MEASUREMENTS ARE SHOWN, ONE FROM THE
TABLE 2-1:PHYSICAL & MECHANICAL PROPERTIES OF SAMPLES MEASURED VIA CHARPY IMPACT TESTING. ... 26
TABLE 2-2:SUMMARY OF DH3DTBT IMPACTS ... 44
TABLE 4-1:BALLISTIC LIMIT EQUATIONS FOR VARIOUS MATERIALS ... 62
TABLE 5-1:SUMMARY OF PIN-ON-DISK RESULTS ... 80
TABLE 6-1:BUILD CONDITIONS FOR THE TI-6AL-4V GRADIENT ALLOY. ... 118
TABLE 6-2:LINEARIZED CTES AND CHANGE IN CTE FROM AMBIENT TEMPERATURES TO 373 K ... 130
Materials Science is a field which seeks to understand the interrelationship between
processing, properties, structure, and performance. This thesis will approach each of these
cornerstones of the field through the study of metallic glasses. Due to their sensitivity to slow
cooling rates, they offer distinct challenges in processing, while at the same time, they offer
unique processing capabilities through technologies such as rapid discharge forming1 and
electromagnetic forming.2 The properties of metallic glass are also their own unique set. Bulk
metallic glasses (BMGs) have largely been treated as a one size-fits-all material. They can have
high strength, large elastic limits, high hardness, high toughness, corrosion resistance, and a
host of other commonly desirable traits, but all of these properties are not true for every alloy.
The critical constraints of each application need to be considered individually. Saying metallic
glasses are resistant to corrosion is like saying because titanium alloys are popular materials for
aerospace applications, cadmium should be a good choice as well, because they both have a
hexagonal closed packed crystal structure.
The first non-crystalline metallic alloys were discovered by Klement, Willens, and Duwez
in 1960 during a series of experiments designed to probe the effects of extremely high cooling
rates on the eutectic microstructure.3 It was already known that as the cooling rate was
increased, the interlaminar spacing would decrease.4 Previous efforts in rapid cooling had been
performed by propelling small droplets of molten alloy into another liquid. However, the cooling
rate was limited by the vapor barrier which would be created by the molten droplet evaporating
a liquid, as well as the need for the molten droplet to spread out rapidly into a thin layer to
minimize the distance for heat to diffuse. Duwez was able to overcome both of these obstacles
from the droplet.5 Through this method, an Au-Si binary glass was formed.3 Previously, the
optimal technique for quenching molten metals was to allow droplets to fall into a viscous liquid
to quench the molten droplet.
For almost a decade glasses were only able to be formed as either splats or thin ribbons.
Even though this the melt spinning technique would eventually yield MetGlas, a commercially
viable material, the field itself was limited by the thin casting limits.6 Chen and Turnbull broke
through this barrier by producing various alloys of the Pd-Si-Au/Ag/Cu family which were able to
be cast to thicknesses greater than 1 mm.7 Not until the developments of the Pd-Ni-Cu-P and
Zr-Al-Ni-Cu alloys developed by the Inoue group at Tohoku University and the Zr-Ti-Be family of
alloys developed by the Johnson group at Caltech were glassy alloys available in excess of a
centimeter.8–10
With these new materials came a new wave of interest in metallic glass research. Now,
more complicated geometries than simple ribbons could be created. These bulk glass formers
lead to the initial commercial development of bulk metallic glasses. Products such as golf clubs
and cell phone cases rapidly came to market. However, it was found that the lack of control
during processing lead to impurities present in the final product which had devastating effects
on the properties. Instead of being tough and strong, they were brittle.11–13
A fully amorphous MG’s microstructure lacks grains, dislocations, or any of the other
hallmarks of a traditional crystalline solid. Their microstructure is fairly simple. They can deform
elastically up to their elastic limit, after which point they typically fail catastrophically due to a
single shear band. So, taking cues from effective methods of toughing other metals, the thought
extruding metallic glass powders with crystalline fibers,19 and more.20 An alternative approach is
to partially crystallize the BMG upon cooling, which results in a multi-phase structure.21 This led
to the development of a new class of bulk metallic glass matrix composites, where a soft
crystalline dendrite is grown to inhibit crack growth and increase toughness.
However, it wasn’t until a study by Conner et. al.22 that the cause for the increased
toughness of metallic glass composites could be fully explained. It was discovered that if a
metallic glass’ thickness is, at most, twice the alloy’s plastic zone size, then, in bending, ductility
could be achieved. As a shear band grows from the outside of a bending surface, it will
eventually reach the neutral axis of stress. At this point the tensile force will be zero, preventing
the shear band from propagating any further. On the compressive side of the whisker, shear
bands would not be able to propagate, since they are constrained by compressive stresses. By
taking this result and expanding on it, an idea for a desired maximum length scale for a
continuous amorphous matrix is apparent.
Figure 1-1: (a) A shear band beginning to grow in a BMG. (b) Failure by a single shear band in a bulk glass. (c) Multiple shear bands growth being arrested by a secondary phase.
Shear
Shear
Shear band
increased toughness can be expected. Initially a shear band will nucleate and begin to grow. As
long as it interacts with a second phase particle prior to becoming large enough to cavitate the
shear band’s growth will be arrested. At this point, the tip of the shear band will be blunted (the
radius of curvature will go from extremely sharp to the size of the second phase particle). It is
now energetically favorable to nucleate new shear bands instead of trying to propagate the
initial one. For this reason, a well reinforced composite glass will exhibit superior plasticity
(Figure 1-1).
The next step was to combine the idea of a BMG with a crystalline dendrite inside of it,
along with controlling the spacing of the dendrite’s arms to be approximately the critical shear
band length. Hofmann et al.23 were able to achieve this goal by holding molten ZrTiNbCuBe
alloys below the liquidus temperature, but above the solidus. This technique allowed body
centered cubic (bcc) dendrites to nucleate and grow. Previously, the composites had been
rapidly quenched, and as such, the dendrite microstructure was heavily dependent upon the
location within the sample and the apparent cooling rate. Dendrites nearest the surface
experienced the fastest cooling, and wound up with very small dendrite morphologies. Those at
the center had time for grain refinement, and wound up with more favorable mechanical
properties, as their spacing was closer to the critical shear band length. Holding the entire ingot
in the semisolid region allows dendrites to nucleate everywhere and grow at the same rate
throughout. The whole sample can then be quenched, resulting in relatively uniform properties.
Ductility was able to be achieved even in pure tension through this technique.24
The ability to hold a bulk metallic glass matrix composite (BMGMC) within the semi-solid
continual reliance on “beating the clock.” In other words, when processing a BMG one must
always avoid crystallization. If a part requires multiple heating and cooling steps (such as
forming feedstock ingots, then later heating and forging them into a final shape), crystallization
must be avoided at all times. Even if the final part is to be sub-mm in thickness, if the feedstock
ingot is thicker, then the critical casting thickness must be large enough for the feedstock to
quench sufficiently. It must also not crystallize during heating prior to forging as well as after the
forming process. On the other hand, if a BMGMC is being semisolidly processed,25 the original
ingot can be allowed to crystallize during cooling into feedstock. This is because during semisolid
forging the ingot is reheated back above the solidus temperature. At this point, any crystals
which have formed in the matrix will melt, leaving a mixture of liquid and equilibrium dendrite.
The liquid can then readily be revitrified with a sufficient cooling rate.
Another class of BMGs containing crystals is those which partially crystallize in an
uncontrolled manner upon quenching; these have been demonstrated in numerous studies.26–29
A problem with this method is the inconsistency in properties of the final alloy, as well as the
microstructure’s strong dependence upon the geometry of the final part. While an alloy may
give an optimal microstructure for a 1 mm rod, when processed into a half millimeter thick
sheet the dendrites may not have enough time to fully grow. Likewise, for a 2 mm thick rod the
center may cool too slowly, and an excess of crystals could form. It may be a possibility to design
an alloy around a particular application. First, determine the final geometry which will be used,
then develop particular alloys for each situation. This method seems fairly difficult, however, as
generally things are not of uniform thickness, and, even if they are, cooling rates may vary
heavily dependent upon both the thermodynamics of a system as well as the kinetics inside the
system, it is informative basic theories of crystallization from a liquid. When a new crystalline
phase, α, begins to form from a liquid, it will take up some volume of the liquid. It will also
create a liquid/crystal interface. Both of these terms have an energetic cost, and if growth is
assumed to be spherical, the resultant energy change in the system is
( )
r
slr
G
VG
=
−
∆
∆
2 33
4
4
π
σ
π
(1)where ∆GV is the change in Gibbs free energy from the liquid to the crystal, σsl is the interfacial
energy between the solid and liquid phases, and r is the radius of the nuclei. A system is at
equilibrium when G is minimized. This minimum will be reached when the volume term
becomes equivalent to the surface energy term. This can be found by taking
( )
∆
=
0
c rr
G
δ
δ
,where rc is the critical radius.
0
4
8
−
2∆
=
V
sl
r
G
r
σ
π
π
sl
V
r
G
r
π
σ
π
8
4
2∆
=
V sl
G
r
∆
=
2
σ
(2)This relationship can then be reinserted into our initial equation to find the critical free energy
difference, ∆Gc
∆
=
∆
323
16
V sl
c
G
G
π
σ
(3)Another thought experiment which can be performed is estimating the amount of total
For the first nuclei to form
( )
3 33
4
3
4
r
vt
V
=
π
=
π
(4)For any nuclei forming later, it would begin its growth at time τ,
(
)
3 33
4
'
=
π
v
t
−
τ
V
(5)For a given amount of time, dτ, there will be Ndτ nuclei forming. So, in the beginning of
transformation (before particle impingement occurs) the total extended volume is
(
)
∫
−
=
te
Nv
t
d
f
0
3 3
3
4
π
τ
τ
α
4 3 3 Nv t
fe
π
α = (6)
As stated above, this will only be valid for very short times, or when f is small. In order to extend
the theory to longer times, the overlap of nuclei forming inside existing nuclei which have
already grown must be taken into account. For this reason, above, fe
αis given as the fraction of
volume which has been transformed, including multiple counting of areas due to overlapping
nuclei. The actual volume transformed is related by
L e
f
df
df
α=
α(
α)
αα
df
f
df
=
e1
−
(7)
Rearranging , integrating, and solving for fraction transformed
(
)
∫
∫
=
−
edf
df
f
α αα
1
( )
( )
ee
f
f
f
f
α α α α−
−
=
−
=
−
exp
1
exp
1
(8)Substituting back in the value for fe
αfrom above
−
−
=
3 43
exp
1
Nv
t
f
απ
(9)By grouping all of the constants on the right hand side together, a familiar result, the
Johnson-Mehl-Avrami-Kolmogorov, is reached.
(
Kt
n)
f
α=
1
−
exp
−
(10)Where K is a collection of the nucleation rate, growth velocity, and geometric factors. By
generalizing t4 to tn, different types of growth can be modeled. If desired, this equation can be
further rewritten.
(
)
(
)
[
]
( )
(
)
[
f
]
( )
K
n
( )
t
Kt
f
Kt
f
n nln
ln
1
ln
ln
ln
1
ln
ln
1
ln
+
=
−
−
=
−
−
−
=
−
α α α (11) By performing this simplification, plottingln
[
−
ln
(
1
−
f
α)
]
versus ln( )
t , the slope will give theresultant n. In the initial case, n = 4, and that could be seen as a particle growing in three
dimensions, plus additional particles linearly being added to the system. In the cases of n = 1, 2,
or 3 for transformations involving site saturation, it would indicate nucleation on surfaces,
edges, and points, respectively.30 In the third situation, growth could initially be seen as n = 4,
but as soon as the point sites saturate, it changes to a value of 3. Likewise, if, instead of the α
nuclei growing as spheres, they grew as circular platelets without saturated sites, it could be
been discussed. While they will not be derived explicitly here, the nucleation rate can be found
to be equal to31:
∆
−
=
T
k
G
A
N
b cexp
η
(
)
∆
−
=
V b slG
T
k
A
N
33
16
exp
π
σ
η
(12)Where kb is Boltzmann’s constant, A is comprised of constants, and η is the viscosity, whose
temperature dependence can be given as
( )
−
=
0 0exp
T
DT
T
T
η
η
(13)The growth velocity can be expressed as
(
)
∆
−
−
=
T
k
G
L
k
v
b c bφ
η
π
1
exp
3
2(
)
∆
−
−
=
V b sl bG
T
k
L
k
v
2 33
16
exp
1
3
φσ
π
πη
(14)where φ is the average atomic volume and L is the average atomic diameter. By returning to
Equation (9) above and inserting all of the expressions given, a full model can be given for the
evolution of the microstructure of a material.
(
)
(
)
∆
−
−
∆
−
−
−
=
− n n V b sl b V b slt
G
T
k
L
k
G
T
k
A
f
1 3 2 33
16
exp
1
3
3
16
exp
3
exp
1
π
φσ
πη
σ
π
η
π
α (15) ( ) ( )
−
−
−
=
− ∆ − − ∆ − n n G T k T TDTb
e
e
t
L
e
Ak
f
kbT slGVThe viscosity, growth velocity, and nucleation rate are all exponentially dependent upon
temperature. As the temperature decreases the nucleation rate will grow quickly, and the
growth velocity will also decrease rapidly. From this, we can see there will be a specific
temperature at which the product of the nucleation and growth rates will reach a maximum,
and this would be the temperature at which the growth of α would be fastest. In terms of
forming a BMG, this is the critical temperature which must be rapidly cooled to in order to stand
a chance at vitrification. Taking this as a way to think about the accidental composites, one can
readily see how sensitive they can be to processing conditions. Indeed, casting a 2 mm rod from
a copper mold will have different cooling conditions versus a copper mold. In this case, one may
have the desired microstructure, while the other would not.
The following chapters will deal with a number of different methods, properties,
processes, and new applications for metallic glasses and their composites. In this introduction,
an outline has been made of the past history of metallic glasses, starting from their origins as a
thin, difficult to process material to the development of bulk metallic glasses which are able to
be cast in excess of one inch in thickness. The importance of designing metallic glasses such that
their feature size is on the order of their plastic zone size is necessary in preventing catastrophic
failure. Finally, the way to design composites to take advantage of this knowledge was
discussed.
The second chapter is a study of how Charpy impact toughness can be affected by
processing conditions. Various alloys are fabricated through suction casting, semi-solid forging,
and commercially cast plates. Their performance is compared with that of traditional
well-highest impact toughness at room temperature and maintains parity with the well-performing
BMGs even at cryogenic temperatures.
In the next chapter, the feasibility of joining bulk metallic glass matrix composites
through rapid capacitive discharge is demonstrated. A series of measurements are performed to
determine the maximum strength which can be achieved after welding, and it is found to be
approximately that of the parent material. A cross section of the weld interface is inspected via
SEM, and no traces of crystallization are found. The dendrite microstructure has not been
heated sufficiently to be remelted nor heated long enough to coarsen. The matrix was able to be
fully revitrified.
The fourth chapter explores the use of both bulk metallic glasses and bulk metallic glass
matrix composites as energy absorbing materials in hypervelocity impacts. Flat sheets of
Vitreloy 1 and an eggbox geometry of DH1 are impacted with a 3.17 mm aluminum sphere
travelling at 2.7 km/sec. The eggbox’s facets spread the ejected material out over a greater area,
and are found to generate more light during the impact, implying a greater amount of energy
was absorbed. The composite eggboxes are also welded into a multilayered Whipple shield, and
they are able to fully stop the aluminum projectile with a velocity of 2.3 km/sec. The first two
layers are penetrated, but the third stops any debris from passing through. The multilayered
composites were found to outperform aluminum honeycomb sandwich panels for a given
thickness. Metallic glasses and their composites are found to have a very promising future for
hypervelocity impact protection, due to their high hardness and low melting point.
Next, preliminary measurements are performed to qualify metallic glasses as a potential
temperatures. For this reason, Curiosity’s gearboxes were outfitted with lubricants and heaters
to prevent the gears from wearing excessively. Unfortunately, this requires substantial amounts
of power and adds mass. Metallic glasses are reputed for their resistance to wear and are have
been shown to lack a ductile to brittle phase transition,32,33 so they should retain many of their
attributes even at low temperatures.
A large series of metallic glass alloys are created and their wear loss is measured in a
pin-on-disk test. Wear is found to vary dramatically among different metallic glasses, with some
considerably outperforming Vascomax (most notably Cu43Zr43Al7Be7). Others, on the other hand,
suffered extensive wear loss. Commercially available Vitreloy 1 was found to be much worse in
wear compared to lab quality, likely due to impurities present during processing. This could
explain some of the variability observed in the literature about this alloy. No conclusive
correlations can be found between any set of mechanical properties (hardness, density, elastic,
bulk, or shear modulus, Poisson’s ratio, frictional force, and run in time) and wear loss. Heat
treatments are performed on Vitreloy 1 and Cu43Zr43Al7Be7. Anneals near the glass transition
temperature are found to possibly increase hardness slightly, but decrease wear loss
significantly. Crystallization of both alloys leads to dramatic increases in wear resistance. Finally,
wear tests are performed on the two alloys above. Vitreloy 1 experiences a dramatic decrease in
wear loss, while Cu43Zr43Al7Be7 has a moderate increase. Meanwhile, gears are fabricated
through three techniques: electrical discharge machining of 1 cm by 3 mm cylinders, semisolid
forging, and copper mold suction casting. Initial testing finds the pin-on-disk test to be an
Laser engineered net shaping (LENS) is a method whereby small amounts of metallic powders
are melted by a laser such that shapes and designs can be built layer by layer into a final part.
The technique is extended to mixing different powders during melting, so that compositional
gradients can be created across a manufactured part. Two compositional gradients are
fabricated and characterized. Ti-6Al-4V to pure vanadium was chosen for its combination of high
strength and light weight on one end, and high melting point on the other. It was inspected by
cross-sectional x-ray diffraction, and only the anticipated phases were present. A 304L stainless
steel to Invar 36 transitionary alloy was fabricated in both linear and radial gradients. It
combines strength and weldability along with a zero coefficient of thermal expansion material.
Only the austenite phase is found to be present via x-ray diffraction. Coefficient of thermal
expansion is measured for four compositions, and is found to be tunable depending on
(1) Johnson, W. L.; Kaltenboeck, G.; Demetriou, M. D.; Schramm, J. P.; Liu, X.; Samwer, K.; Kim, C. P.; Hofmann, D. C. Beating crystallization in glass-forming metals by millisecond heating and processing. Science 2011, 332, 828–33.
(2) Johnson, W. L.; Kltenboeck, G.; Demetriou, M. D.; Roberts, S.; Samwer, K.; Kaltenboeck, G.; Demetrious, M. Electromagnetic forming of metallic glasses using a capacitive discharge and magnetic field 2013, 2, 1–27.
(3) Klement, W.; Willens, R. H.; Duwez, P. Non-crystalline structure in Solidified Gold-Silicon Alloys. Nature 1960, 187, 869–870.
(4) Hultgren, R.; Olsen, W. T. Effect of rate of freezing on degree of segregation in alloys.
AIME Trans 1950, 1323.
(5) Duwez, P.; Willens, R. H.; Klement, W. Continuous Series of Metastable Solid Solutions in Silver-Copper Alloys. J. Appl. Phys. 1960, 31, 1136.
(6) Liebermann, H.; Graham, C. Production of amorphous alloy ribbons and effects of apparatus parameters on ribbon dimensions. IEEE Trans. Magn. 1976, 12, 921–923.
(7) Chen, H. .; Turnbull, D. Formation, stability and structure of palladium-silicon based alloy glasses. Acta Metall. 1969, 17, 1021–1031.
(8) Inoue, A.; Zhang, T.; Nishiyama, N.; Ohba, K.; Masumoto, T. Preparation of 16 mm diameter rod of amorphous Zr65Al7.5Ni10Cu17.5 alloy. Mater. Transations, JIM 1993,
34, 1234–1237.
(9) Peker, A.; Johnson, W. L. A highly processable metallic glass: Zr41.2Ti13.8Cu12.5Ni10.0Be22.5. 1993, 63, 2342–2344.
(10) Inoue, A.; Nishiyama, N.; Matsuda, T. Preparation of Bulk Glassy Pd40Ni10Cu30P20 Alloy of 40 mm in Diameter by Water Quenching. Mater. Trans. - JIM 1996, 37, 181–184.
(11) Gebert, A.; Eckert, J.; Schultz, L. Effect of oxygen on phase formation and thermal stability of slowly cooled Zr65Al7.5Cu17.5Ni10 metallic glass. Acta Mater. 1998, 46, 5475–5482.
(12) Liu, C. T.; Chisholm, M. F.; Miller, M. K. Oxygen impurity and microalloying effect in a Zr-based bulk metallic glass alloy. Intermetallics 2002, 10, 1105–1112.
metallic glass matrix composite with tensile plasticity. Scr. Mater. 2010, 62, 278–281.
(15) Conner, R. D.; Choi-Yim, H.; Johnson, W. L. Mechanical properties of
Zr57Nb5Al10Cu15.4Ni12.6 metallic glass matrix particulate composites. J. Mater. Res.
2011, 14, 3292–3297.
(16) Conner, R. D.; Dandliker, R. B.; Johnson, W. L. Mechanical properties of tungsten and steel fiber reinforced Zr41.25Ti13.75Cu12.5Ni10Be22.5 metallic glass matrix composites.
Acta Mater. 1998, 46, 6089–6102.
(17) Clausen, B.; Lee, S. Y.; Ustundag, E.; Aydiner, C. C.; Conner, R. D.; Bourke, M. Compressive yielding of tungsten fiber reinforced bulk metallic glass composites. Scr. Mater. 2003, 49, 123–128.
(18) Cho, S.-M.; Han, J.-H.; Lee, J.-K.; Kim, Y.-C. Fe-Based Nano-Structured Powder Reinforced Zr-Based Bulk Metallic Glass Composites by Powder Consolidation. Korean J. Mater. Res.
2009, 19, 504–509.
(19) Bae, D. H.; Lee, M. H.; Kim, D. H.; Sordelet, D. J. Plasticity in Ni59Zr20Ti16Si2Sn3 metallic glass matrix composites containing brass fibers synthesized by warm extrusion of powders. Appl. Phys. Lett. 2003, 83, 2312.
(20) Lee, K. S.; Kang, S.-H.; Lee, Y.-S. Synthesis of Zr-based bulk metallic glass–crystalline aluminum alloy composite by co-extrusion. Mater. Lett. 2010, 64, 129–132.
(21) Szuecs, F.; Kim, C. P.; Johnson, W. L. Mechanical Properties of
Zr56.2Ti13.8Nb5.0Cu6.9Ni5.6Be12.5 Ductile Phase Reinforced Bulk Metallic Glass Composite. Acta Mater. 2001, 49, 1507–1513.
(22) Conner, R. D.; Li, Y.; Nix, W. D.; Johnson, W. L. Shear band spacing under bending of Zr-based metallic glass plates. Acta Mater. 2004, 52, 2429–2434.
(23) Hofmann, D. C.; Suh, J.-Y.; Wiest, A.; Duan, G.; Lind, M.-L.; Demetriou, M. D.; Johnson, W. L. Designing metallic glass matrix composites with high toughness and tensile ductility.
Nature 2008, 451, 1085–9.
(24) Hofmann, D. C.; Suh, J.-Y.; Wiest, A.; Lind, M.-L.; Demetriou, M. D.; Johnson, W. L.
Development of tough, low-density titanium-based bulk metallic glass matrix composites with tensile ductility. Proc. Natl. Acad. Sci. U. S. A. 2008, 105, 20136–40.
(25) Hofmann, D. C.; Kozachkov, H.; Khalifa, H. E.; Schramm, J. P.; Demetriou, M. D.; Vecchio, K. S.; Johnson, W. L. Semi-solid induction forging of metallic glass matrix composites.
composite with high corrosion resistance and excellent mechanical properties. Acta
Mater. 2006, 54, 3713–3719.
(27) Chang, H. J.; Yook, W.; Park, E. S.; Kyeong, J. S.; Kim, D. H. Synthesis of metallic glass composites using phase separation phenomena. Acta Mater. 2010, 58, 2483–2491.
(28) Lim, K. R.; Na, J. H.; Park, J. M.; Kim, W. T.; Kim, D. H. Enhancement of plasticity in Ti-based metallic glass matrix composites by controlling characteristic and volume fraction of primary phase. J. Mater. Res. 2010, 25, 2183–2191.
(29) Park, J. M.; Jayaraj, J.; Kim, D. H.; Mattern, N.; Wang, G.; Eckert, J. Tailoring of in situ Ti-based bulk glassy matrix composites with high mechanical performance. Intermetallics
2010, 18, 1908–1911.
(30) Cahn, J. W. Transformation kinetics during continuous cooling. Acta Metall. 1956, 4, 572– 575.
(31) Schroers, J.; Wu, Y.; Busch, R.; Johnson, W. L. Transition from Nucleation Controlled to Growth Controlled Crystallization in Pd43Ni10Cu27P20 Melts. Acta Mater. 2001, 49, 2773–2781.
(32) Li, H.; Tao, K.; Fan, C.; Liaw, P. K.; Choo, H. Effect of temperature on mechanical behavior of Zr-based bulk metallic glasses. Appl. Phys. Lett. 2006, 89, 041921.
(33) Roberts, S.; Zachrisson, C.; Kozachkov, H.; Ullah, A.; Shapiro, A. a.; Johnson, W. L.; Hofmann, D. C. Cryogenic Charpy impact testing of metallic glass matrix composites. Scr.
Chapter 2 – Effects of Processing and Temperature on Charpy Impact
Toughness in Metallic Glasses and Metallic Glass Matrix Composites
Introduction to Charpy Testing
Charpy impact testing (CIT) is an ASTM standard fracture mechanics technique used to
measure a material’s notch toughness at moderately high strain rates. It is defined by the ASTM
standard E231, requiring a 55x10x10 mm beam with a 45°, 2 mm deep notch cut into the
midpoint of the 55 mm side (Figure 2-1). The testing apparatus consists of a weighted hammer
mounted at the end of a pendulum. The hammer can be raised to a known height and the
sample to be tested placed in the path of the hammer’s swing, with the notch facing away from
the impact surface (Figure 2-2). By measuring the height of the hammer’s swing after impacting
the sample, a measurement of the energy absorbed by a sample can be taken.
) (hf hi
mg
E= −
∆ (1)
The lost potential energy is converted into work, which fractures the sample by driving a crack
initiating at the notch. The sample geometry, with the notch facing away from the hammer’s
impact, is used to cause a stress concentration at the tip of the notch to ensure the sample fails
instead of bending along the rest of the bar.
While the results obtained from a CIT are not necessarily quantitative by nature, it is a
useful tool to make qualitative comparisons between different materials or conditions on a
material’s toughness. It will not provide a measurement of a quantitative property, such as
Figure 2-1: Geometry required for an ASTM standard Charpy impact test.1 Type A is the
Figure 2-2: A schematic of a Charpy impact test.2
Some materials, upon cooling below a critical temperature, will exhibit a rapid decrease
in their measured impact toughness. This change is called a ductile to brittle transition (DTBT).
The CIT provides a rapid and reliable method to measure the relative change in impact
toughness of a material as it becomes more brittle. This is primarily because the CIT test can be
performed in a matter of seconds after removing a test specimen from a cryogenic bath or oven,
allowing the entire test to be performed isothermally. In contrast, a plane-strain fracture
toughness test would have to be performed in an environmental chamber for non-ambient
temperature testing. It is known that fcc materials do not undergo a DTBT, while bcc and hcp
metals do. Some cryogenic work has been done on BMGs to assess their ambient impact
toughness, as well as their elevated and cryogenic toughness. Two Charpy studies were
performed by Raghavan et al.3,4 where in one study the BMG Vitreloy 1 was tested from 100 K to
450 K, and in the other the samples were annealed and then tested from 100 K to 600 K.
Toughness was shown to dramatically decrease with increasing temperature in both studies. H
increase in compressive strength and plasticity at 123 K. Yu et al.7 studied the temperature
dependence of the various elastic moduli at cryogenic temperatures. Qiao et al. 8 summarized
the ultimate tensile strength of BMGs from 75 to 300 K. Not surprisingly, the properties of BMGs
remain relatively unchanged even at cryogenic temperatures. The toughness does decrease with
temperature, but in a linear fashion similar to fcc metals, instead of the sharp
order-of-magnitude drop associated with bcc metals and those with a DTBT.
Although the toughness of BMGs doesn’t decrease significantly at cryogenic
temperatures, their initial toughness is fairly low compared with most high-performance
engineering materials (e.g. titanium, steel, and aluminum alloys). To address this shortcoming,
bulk metallic glass matrix composites (BMGMCs) have been developed to offer significantly
higher toughness at room temperature due to the ability of a soft, bcc crystalline phase to stop
shear band propagation. Qiao et al8 performed compression tests on two BMGMCs to observe if
the embedded bcc crystalline dendrites exhibited an expected DTBT temperature. In both alloys
there was significant compressive plasticity at room temperature, but at 77 K the sample was
brittle. Unfortunately, only two temperatures were measured (room temperature and 77 K), so
there was not enough information to confirm or reject the existence of a DTBT in BMGMCs. In
this chapter, measurements were performed at ten different temperatures ranging from 100 K
to 300 K to allow for a more complete view of how impact toughness varies with temperature.
Using impact testing instead of compressive testing is also preferred, as plasticity can be
influenced by frictional forces during compression tests. Compression tests are also slow,
prepared using different processing conditions. This was done to provide a baseline for further
Charpy testing of both BMGs and BMGMCs that cannot be formed into the shapes required for
larger mechanical tests. This chapter also represents the first Charpy study of BMGMCs, done to
compliment work done in the literature with quasistatic and dynamic mechanical testing.9–14
Experimental
This chapter focuses on comparing the impact behavior of three BMGMCs to Vitreloy 1
(a monolithic BMG) as well as some traditional crystalline alloys. The first BMGMC tested is a
titanium-based alloy DV1 (Ti48Zr20V12Cu5Be15), with 40% crystal volume fraction. The second is a
zirconium-titanium-based alloy DH3 (Zr39.9Ti33.9Nb7.6Cu6.4Be12.5), with 67% crystal volume fraction.
LM2 (Zr71.9Ti9.3Nb6Cu6.15Ni4.6Be1.6), a commercially available zirconium-based composite material,
is 40% crystalline. Vitreloy 1 (Zr41.2Ti13.8Cu12.5Ni10Be22.5) is the BMG used for comparison, and is
the most widely commercially used BMG (under the trade name LM1). Several crystalline alloys
were also used for comparison with the BMG alloys. These include Ti-6Al-4V, Al-7075, Al-2024,
and SS 304. To measure ductile to brittle transitions, both 99.9% pure tin and DH3-Matrix
(Zr35Ti30Cu8.25Be26.75), a BMG with composition equivalent to that of the glass matrix in DH3, are
used. A summary of their properties can be seen in Table 2-1.
BMG alloys were produced by arc melting high purity elements in a Ti-gettered argon
atmosphere. Suction cast (SC) samples were then remelted in a mini-arc melter and cast into
3x3x30 mm beams. A notch 0.5 mm deep, 1 mm wide, 90° cut was made using an endmill.
Semi-Solid Forged (SSF) samples were held isothermally above their solidus temperatures prior to
forging to allow for dendrite coarsening before being formed into 3 mm thick plates. The plates
manner.
Charpy tests were performed on a modified Riehle Impact Testing Machine, which was
instrumented to detect small changes in hammer velocity (Figure 2-3). Standard Charpy
machines operate from two drop heights, 61 and 122 cm (24 and 48 in), with two hammer
masses so that four maximum impact energies can be obtained: 41, 81, 163, and 325 J.
Unfortunately, full-sized Charpy testing on Zr-Be-based BMGs from literature indicate only 1-5 J
of energy is absorbed, whereas Zr-Be-based BMGMCs absorb 25-45J.3,4,15–17 Full sized Charpy
specimens can be very difficult to fabricate out of various BMGs. A very large critical casting
thickness is required, and ingots of at least 30 g would be required (very difficult with
laboratory-scale equipment). Changing the sample geometry to 30x3x3 mm allows for rapid
fabrication through suction casting in a mini arc melter. In the future, poor glass formers can
also be directly compared, since this is an easier geometry for fabrication. Since the impact
toughness of the BMG alloys is relatively low, plane-stress effects are absent even in the smaller
beams, which means comparisons to tests done in larger specimens are proportional. The
cross-sectional area of the compact samples in the current work is approximately 10 times smaller
than full-sized samples, so the amount of energy absorbed would be nearly undectable using
standard drop heights and hammer masses. Therefore, the Charpy tester was modified by
reducing the drop height and the hammer mass, and the impact energy was measured both by
dial and by instrumentation. Equating the potential energy of the hammer at the drop height
(PE=mgh) with the kinetic energy of the hammer at impact (KE=mv2 2), the initial velocity (v 0)
of the hammer before the impact is found to be a function only of the initial drop height.
gh
plastic arm on the side of the hammer pendulum. Two 1 cm diameter copper coils were
mounted on a plate 70 mm apart, with their midpoint located at the impact location
Figure 2-3
a
. The coils were wired to a digital oscilloscope connected to a computer. When themagnet attached to the hammer passes the first coil, a voltage that registers as a sinusoidal
peak on the oscilloscope is created. During the impact with the specimen, the hammer slows
down before it passes the second coil, creating a difference in the width of the sinusoidal peak.
The energy absorbed by the sample can then be determined through
(
2 2)
0 2 1
f
v v m
E= − (3)
The velocity of the hammer can be determined by v=∆x ∆t, where
∆
t
is the width ofthe sinusoidal pulse (the transit time of the magnet across the coil) and
∆
x
is the width of thecoil. Using the known standard drop height of the hammer, the initial velocity was calculated to
be 3.46 m/s; using this known velocity,
∆
x
was calculated to be ~1.0 cm for each coil bymeasuring the peak width. Using the known original impact energy and hammer height, the
original effective mass of the hammer was calculated as 6.8 kg. An example of this procedure is
demonstrated in Figure 2-3d. To accommodate the small-scale specimens, the energy of the
hammer was reduced by decreasing the hammer mass to 2.7 kg and the initial velocity to 2.0
m/s. The new drop height was calculated to be 21 cm (from the measured velocity) and, thus,
the total energy of the hammer was reduced from 41 to 5.6 J. For samples requiring more than
5 J to fracture, a second drop height was calibrated at 83 cm, imparting 22.2 J of energy at
for the small-scale tests.
To calibrate the impact temperatures for the DTBT measurements, a series of heating
curves was measured for each alloy. This was done by attaching a thermocouple to a specimen,
holding the sample in liquid nitrogen until it reached equilibrium, quickly loading the sample
into the testing setup, and then recording the temperature as a function of time as the sample
heated due to contact with air and the sample fixture. This was repeated several times for each
sample, so a plot of temperature vs. time could be obtained for each sample. The heating curve
for DH3 is shown in Figure 2-4. The validity of the testing setup for measuring DTBT was verified
by measuring an accurate DTBT temperature for 99.9% Sn.
Microstructures of the samples were analyzed through x-ray diffraction, backscattered
scanning electron microscopy (QBSD-SEM), Rockwell hardness testing, acoustical
measurements, and optical microscopy.
0 50 100 150 200 250 300 350
0 20 40 60 80 100 120
Te
mp
er
at
ur
e [
K]
Seconds In Sample Fixture [s]
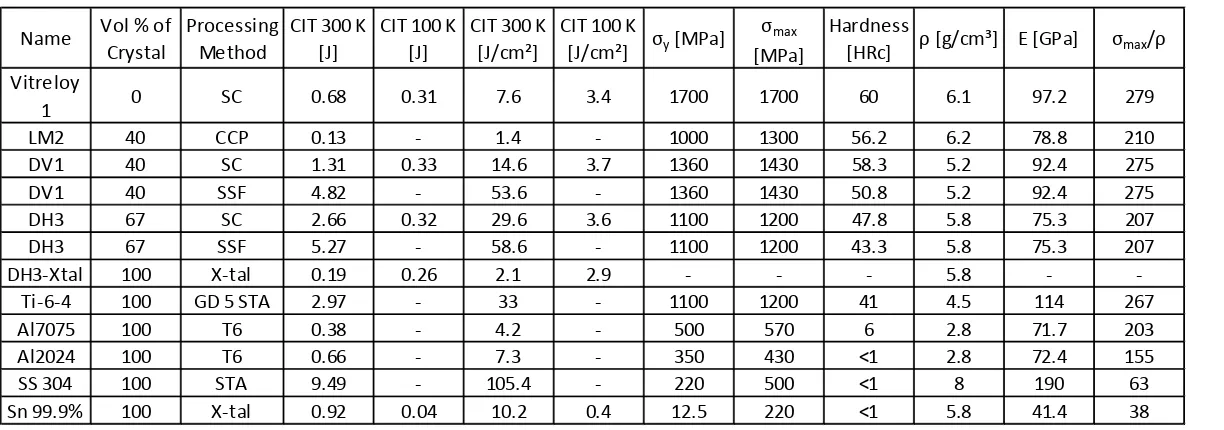
Table 2-1: Physical & mechanical properties of samples measured via Charpy impact testing.
Name Vol % of Crystal Processing Method CIT 300 K [J] CIT 100 K [J] CIT 300 K [J/cm²] CIT 100 K [J/cm²] σy [MPa] σmax
[MPa]
Hardness
[HRc] ρ [g/cm³] E [GPa] σmax/ρ
Vitreloy
1 0 SC 0.68 0.31 7.6 3.4 1700 1700 60 6.1 97.2 279
LM2 40 CCP 0.13 - 1.4 - 1000 1300 56.2 6.2 78.8 210
DV1 40 SC 1.31 0.33 14.6 3.7 1360 1430 58.3 5.2 92.4 275
DV1 40 SSF 4.82 - 53.6 - 1360 1430 50.8 5.2 92.4 275
DH3 67 SC 2.66 0.32 29.6 3.6 1100 1200 47.8 5.8 75.3 207
DH3 67 SSF 5.27 - 58.6 - 1100 1200 43.3 5.8 75.3 207
DH3-Xtal 100 X-tal 0.19 0.26 2.1 2.9 - - - 5.8 -
-Ti-6-4 100 GD 5 STA 2.97 - 33 - 1100 1200 41 4.5 114 267
Al7075 100 T6 0.38 - 4.2 - 500 570 6 2.8 71.7 203
Al2024 100 T6 0.66 - 7.3 - 350 430 <1 2.8 72.4 155
SS 304 100 STA 9.49 - 105.4 - 220 500 <1 8 190 63
Sn 99.9% 100 X-tal 0.92 0.04 10.2 0.4 12.5 220 <1 5.8 41.4 38
σy, σmax, and E for all crystalline alloys (other than DH3-matrix) were obtained from matweb.com. Processing routes for metallic glasses are
Results and Discussion
Influence of Processing Conditions of Charpy Impact Energy
Compact Charpy impact testing was performed on a total of 12 alloys: six containing an
amorphous phase and six fully crystalline alloys. Table 2-1 gives compositions and processing
conditions for the alloys tested. Figure 2-5 is a visual plot of the data in Table 2-1, which shows
the impact energy (in Joules) for each sample along with impact energy per cross-sectional area
(in J/cm²). On average, seven samples of each type were impacted to observe the effect of
processing variation on impact energy, and the mean value for each alloy is shown in Figure 2-5
with a red circle. As a baseline, the monolithic BMG Vitreloy 1 (abbreviated Vit 1) was also
evaluated via Charpy testing, as was done by several other groups.3,4,16,17 Vit 1, which is the most
widely studied and commercialized BMG to date (often und