City, University of London Institutional Repository
Citation
:
Pullen, K. R. and Dhand, A. (2014). Characterization of Flywheel Energy
Storage System for Hybrid Vehicles. Paper presented at the SAE 2014 World Congress &
Exhibition, 08-04-2014 - 10-04-2014, Detroit, USA.
This is the unspecified version of the paper.
This version of the publication may differ from the final published
version.
Permanent repository link:
http://openaccess.city.ac.uk/3930/
Link to published version
:
http://dx.doi.org/10.4271/2014-01-1796
Copyright and reuse:
City Research Online aims to make research
outputs of City, University of London available to a wider audience.
Copyright and Moral Rights remain with the author(s) and/or copyright
holders. URLs from City Research Online may be freely distributed and
linked to.
City Research Online:
http://openaccess.city.ac.uk/
[email protected]
Characterization of Flywheel Energy Storage System for Hybrid Vehicles
Aditya Dhand and Keith Pullen
City University London
Abstract
Flywheels are excellent secondary energy storage devices and several applications in road vehicles are under development. They can be used in hybrid vehicles with an internal combustion engine (ICE) as the prime mover or can be used in hybrid energy storage (HES) to complement the battery. When used in HES, they are utilized to load level the battery so as to protect it from peak loads and enhance its capacity and life. This paper deals with defining the main characteristics of the flywheel for an application as a secondary energy storage device for an electric vehicle. Various strategies for defining flywheels are explained. A real world customer usage data is also presented. This data is analyzed and its results are used to support the selection of the flywheel characteristics. The results show that the chosen flywheel is sufficiently sized to perform its intended tasks for a c-segment passenger car electric vehicle.
Introduction
The development of battery electric vehicles (BEV) must continue since this offers the leading route towards a zero emission transport system. The fuel flexibility of the BEV offers the greatest potential to utilize power from renewable or low emission sources to be used in the transport system. However the low range and high cost of BEVs remain two important issues which impede their popularity [1]. The most crucial element of the BEV is the battery which strongly affects its range and cost. Some of the important properties of batteries are specific energy, specific power, life cycle, safety and cost. These depend on its chemistry, shape of the cell etc. Batteries offer either high specific power or high specific energy but not both. The energy capacity of the battery in the BEV is directly related to its range. The battery power is related to the electric machine power which is usually based on the performance requirements of the vehicle such as the acceleration and gradeability. The performance of the battery strongly depends on its operating temperature. It shows significantly poorer performance at high (>45 deg C) and low (<-10 deg C) temperatures [2]. At these temperatures the effect of peak currents on the battery performance is much worse. Temperature and depth-of-discharge dependent battery aging effects affect the cycle life of the battery and so does the usage pattern. Driving the BEV in heavy traffic can cause significant battery heating and aging [3].
To improve the energy storage it is beneficial to hybridize it combining a high energy battery with a high power source. There are various devices which could qualify as a secondary storage system for the BEV such as high power battery, supercapacitor and high speed flywheel (FW). Among these,
FW is the only device that keeps the energy stored in the same form as the moving vehicle i.e. mechanical energy. They have the characteristics of high specific power, high specific energy, long cycle life, high energy efficiency, quick recharge, low cost and environmental friendliness. They do not suffer from temperature dependence and their state of charge is most easily determined. Their attractive properties make them an excellent secondary storage device to be used in hybrid vehicles (HV) and electric vehicles (EV).
Flywheel in BEV
The aim of the FW is to improve energy efficiency of the battery by taking care of the peak loads, which would reduce losses in the battery and increase range of the BEV. This would also lead to improvement of battery life and the battery can be optimized as pure energy source. This is termed as load leveling whereby the battery handles the average loads and the FW handles the peak loads. The other aim is to perform regenerative braking which could achieve higher efficiency due to absence of energy conversion. A third possibility could be reduction of the main electric machine (EM) size. In a BEV the peak torque performance of the EM is decided by the vehicle launch and acceleration requirements. The lower bound of the design torque limit of the EM decides the hill climbing and top speed ability of the vehicle [4-5]. By utilizing a flywheel in combination with a mechanical continuously variable transmission (CVT) these performance requirements might be met completely or partially. Note that this is only possible with a mechanical CVT driven flywheel as with any type of electric transmission the prime mover has to be sized to carry the entire power.
The energy capacity of the flywheel can be sized in a number of different ways. Some authors suggest using particular drive cycles, usually the homologation cycles such as new European driving cycle (NEDC) or federal test procedure (FTP) to size the FW [6]. In this approach the authors calculate the average power required in FTP cycle and calculate the size of the FW based on the delta power between the average and the actual power required during the cycle. The battery is providing constant fixed power and the FW is taking care of the transients during the cycle. The disadvantage with this approach is that the control strategy is already fixed; the cycles are specific and are assumed to be known at the start. Also these cycles do not represent real world conditions.
and both the HES configurations show reduced losses compared to the original BEV. This is an interesting approach though is difficult to adapt to the current study as the losses in the transmission of the FW are unknown at this point.
Some authors suggest another way of sizing the FW, which is according to the energy needed to accelerate the vehicle from 0 to some final speed like 100 kph which is usually lower than the maximum speed of the vehicle in a specific time [8]. The authors also state that if energy capacity of FW is sized according to this acceleration requirement, it would meet the energy needed for acceleration in standard drive cycles as the increase in kinetic energy (KE) of the vehicle in any period, equal to the 0 to 100 kph acceleration duration, during the cycle is less than the acceleration requirement. This is corroborated further by analysis.
Another way is that the energy stored in the FW should be equal to the KE of the vehicle at some specific cruise speed if the FW is to be used mainly for regenerative braking [9]. A third way would be sizing the FW according to certain deceleration requirement directly. Since in the flywheel assisted battery electric vehicle (FWBEV) the FW would be used for storing regenerative brake energy and load leveling which might entail charging the FW from the battery during low vehicle power demand, the FW has been sized according to the energy needed to accelerate the vehicle from 0 to 100 kph.
A C-segment hatchback passenger car is taken as the base vehicle for this study as this is the one of most common cars used in private transport especially in Europe. A vehicle model for the base BEV is created in AVL Cruise and is used to calculate the vehicle speed profile going from 0-100 kph. The time take for the vehicle to do this acceleration is 10.99 s. Using the information of the BEV; a simple model of the HV is built in Simulink® to calculate the energy needed to perform the targeted acceleration. The total mass of the HV used for this calculation is taken to be base vehicle mass, which is kerb mass plus one driver mass of 75 kg, and the FW and CVT system mass. The assumed mass of the FW and the CVT system is taken to be 40 kg which is a good estimation for road cars [10]. Table 1 gives the HV parameters. According to the calculation, for the HV to achieve the same acceleration performance as the base vehicle, the required energy is 0.192 kWh. This is a reasonable estimation of the energy required and assuming a conservative efficiency of 75% for the FW and transmission system the energy required to be stored in the FW is 0.256 kWh. The peak input power for the system would be around 96 kW for the 0-100 kph operation.
[image:3.612.321.579.55.138.2]This is the maximum useful energy or the energy capacity of the FW. FWs are normally categorized as high speed FWs with a maximum speed over 20,000 rpm. Maintaining a reasonable FW maximum speed of 30,000 rpm, which is much lower than the Flybrid FW maximum speed of 64,500 rpm used in Formula 1 KERS [10] and is closer to the maximum FW speed taken by others for similar class of vehicle [11], and taking the ratio of maximum to minimum FW speed as 2, the minimum FW speed comes out to be 15,000 rpm. This gives inertia value of 0.249 kgm2 with an energy capacity of 0.256 kWh or 922 kJ. In the next section, further analysis will be done to confirm the size of the flywheel energy storage system (FESS).
Table 1 Hybrid vehicle parameters
Target acceleration [0-100 kph] 10.99 s Vehicle mass 1560 kg
Frontal area 2.29 m^2 Drag coefficient 0.29 Wheel radius 301 mm Rolling resistance 0.009
Road Data Analysis
A road data analysis has been performed to validate the FW requirements during real world usage. For this purpose real world car usage data has been downloaded from [12]. The data has been gathered from drivers between 2005 and 2012 from various locations in the US and in Europe and comprises of 420 files. The vehicles covered are mostly passenger cars. The data has been acquired from global positioning system (GPS) of the vehicles and includes the vehicle speed and more crucially the road elevation. The total measured distance is about 23,000 km.
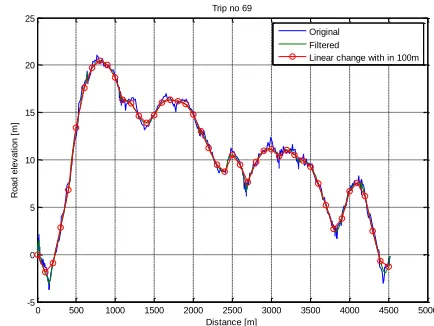
The data has been analyzed in MATLAB®. The data has been cleaned to remove irregularities which come with real world measurements. Trips less than 1 km have been removed. The total number of trips is 746 after data processing. The road elevation data from GPS is quite noisy. To clean the data, it has been filtered and further it has been assumed that the elevation changes linearly in road span of 100m. The maximum road gradients recommended are in the range of 13% for urban roads [9] and this has been taken as the maximum gradient for the data. Fig. 1 shows the comparison of the data before and after processing.
Figure 1 Elevation data
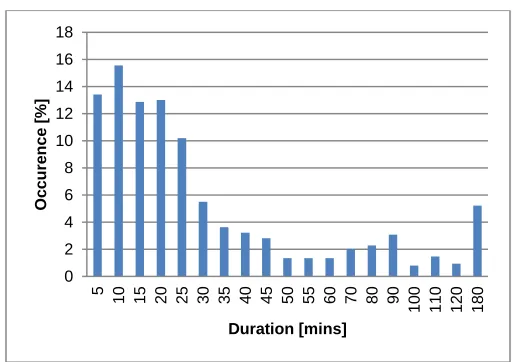
The Fig. 2 shows spread of average speed of the trips. It can be seen that the majority have trips have low average speeds which would indicate that these are urban trips. Further Fig. 3 and 4 show the distribution of trip distance and trip duration. Again it can be noted that most trips are less than 20 km in distance travelled and 30 min in duration. Another interesting comparison is the Fig. 5 showing average velocity and root mean square acceleration. It can be clearly see that majority of trips have the RMS acceleration between 0.05 - 0.1g, which is the same case for most of the real world drive cycles. Further Fig. 6 shows the RMS gradient vs. average velocity for the
0 500 1000 1500 2000 2500 3000 3500 4000 4500 5000 -5
0 5 10 15 20 25
Distance [m]
R
o
a
d
e
le
v
a
ti
o
n
[
m
]
Trip no 69
Original Filtered
[image:3.612.338.555.431.594.2]trips. Naturally majority of the higher gradient trips occur at lower average velocities. Also more than 44% of the trips have a RMS gradient value of more than 2%.
Figure 2 Average speed distribution
[image:4.612.33.291.77.256.2]Figure 3 Distance distribution
[image:4.612.337.555.289.464.2]Figure 4 Duration distribution
Figure 5 Average speed vs. RMS acceleration
Figure 6 Average speed vs. RMS gradient
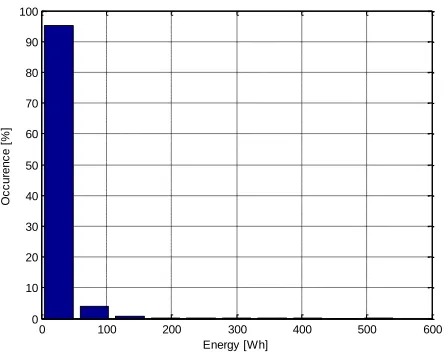
Further the power demand is calculated using the vehicle information during each trip. Fig. 7 shows the ratio of peak power to average power for the trips. The average power is calculated by integrating the instantaneous power over the entire cycle and dividing the resulting energy by the cycle duration. During the average power calculation, it is assumed that all the brake energy is regenerated. As it can be seen the peak power is many times the average power in real world driving which also supports the utilization of a power handling device. Further a negative power demand signifies a braking event for the vehicle. Using this information the braking events in a trip are identified and the energy which would need to be dissipated by brakes is calculated. From this calculation, a total of 69,537 braking events amounting to 746 kWh are found out whose distribution is given in the Fig. 8. Out of these events there are a mere 56 events amounting to 15.7 kWh where the energy dissipated is more than 0.20 kWh per event. Note all the power calculations are done at the wheel.
0 5 10 15 20 25
10 20 30 40 50 60 70 80 90 100 110
Oc
c
ure
nce
[
%
]
Average speed [kph]
0 5 10 15 20 25 30 35 40
5 10 15 20 25 30 35 40 45 50 75 100 150 200
Oc
c
ure
nce
[
%
]
Distance [km]
0 2 4 6 8 10 12 14 16 18
5
10 15 20 25 30 35 40 45 50 55 60 70 80 90
100 110 120 180
Oc
c
ure
nce
[
%
]
Duration [mins]
0 20 40 60 80 100 120 0
0.05 0.1 0.15 0.2 0.25 0.3 0.35
Average speed [kph]
R
M
S
a
c
c
e
le
ra
ti
o
n
[
g
]
0 20 40 60 80 100 120 0
1 2 3 4 5 6 7 8 9 10
Average speed [kph]
R
M
S
g
ra
d
ie
n
t
[%
[image:4.612.34.295.309.485.2] [image:4.612.33.290.535.716.2]Figure 7 Ration of peak to average power vs. Average power
The Fig. 8 below shows the fact that energy dissipated in most braking events is relatively small. Thus it can be concluded that the FW is adequately sized to perform regenerative braking during real world usage. One must note the fact that not all the energy which is dissipated during braking is recoverable. The regenerative braking usually takes place on two wheels rather than four so some energy will be lost. Also the power required during heavy braking events is very high and it is difficult to capture sufficient energy during those events though they occur rather infrequently.
Figure 8 Distribution of brake events
During most real world analysis or drive cycle analysis the effect of elevation is disregarded. The same analysis was repeated by disregarding the elevation. In this case the total braking events are 67,051 in number which amount to 613.3 kWh of energy. The braking energy is 17.8% less than when gradient is considered. By considering gradient, a downhill slope would give more chance of regenerative braking during deceleration and similarly an uphill slope would give less.
Another Fig. 9 shows the maximum change in the KE of the vehicle calculated at intervals of 11s which is roughly the time taken to accelerate the vehicle from 0-100 kph. The KE in the vehicle at 100 kph is about 167 Wh and that would have been the ideal energy capacity of the FW if one was to disregard
[image:5.612.333.555.119.295.2]resistances and inefficiencies. As it can be seen from the Fig. 9, there are hardly any trips where the maximum change in KE over any 11s period is above 167 Wh. Thus it can be said that the FW is adequately sized to meet any acceleration requirement during driving. The above analysis supports the FW size chosen. The final FW capacity is taken to be 256 Wh.
Figure 9 Maximum change in KE over 11 s vs. Average speed
Conclusions
Flywheels are ideal secondary storage devices for hybrid and electric vehicles. They can be used to load level the battery in these vehicles to improve its capacity and life. In this paper the main characteristics of the flywheel for an application as a secondary energy storage device for an electric vehicle are defined. Various methodologies which are used for defining flywheels are presented. A real world customer usage data is analyzed and its results are used to support the selection of the flywheel characteristics. The results show that the chosen flywheel is sufficiently sized to perform its intended tasks as a secondary storage system for a battery electric vehicle.
References
1. Boulanger, A. G., Chu, A.C., Maxx, S. and Waltz, D.L., “Vehicle Electrification: Status and Issues”, Proceedings of the IEEE, Vol 99, no 6, June 2011
2. Miller, J. , “Energy storage system technology challenges facing strong hybrid, plug-in and battery electric vehicles”, IEEE Vehicle Power and Propulsion Conference, 2009 3. Kun, L., Wu, J., Jiang, Y., Hassan, Z. at al., “Large-scale
battery system modeling and analysis for emerging electric-drive vehicles”, proceedings of the 16th
ACM/IEEE international symposium on Low power electronics and design - ISLPED '10, 2010
4. Miller, M.A., Holmes, A.G., Conlon, B.M., and Savagian, P.J., “The GM “ Voltec ” 4ET50 Multi-Mode Electric Transaxle”, SAE paper 2011-01-0887, 2011
5. Barnard, R.H. and Jefferson, C.M., “Criteria for sizing the prime mover and energy storage capacity in hybrid vehicles”, 30th
ISATA Conference on Electric and Hybrid Vehicles, 1997
6. Santiago, J., Oliveira, J.G., Lundin, J., Abrahamsson , J. et al., Design parameters calculation of a novel driveline for electric vehicles, World Electric Vehicle Journal, Vol. 3, 2009
0 2 4 6 8 10 12 14 16 18 20
0 5 10 15 20 25 30 35 40 45 50
Average power [kW]
P e a k p o w e r/ a v e ra g e p o w e r
0 100 200 300 400 500 600 0 10 20 30 40 50 60 70 80 90 100 Energy [Wh] O c c u re n c e [ % ]
0 20 40 60 80 100 120 0 20 40 60 80 100 120 140 160 180 200
Average speed [kph]
[image:5.612.48.270.390.568.2]7. Romaus , C., Gathmann, and K., Böcker, J., “Optimal Energy Management for a Hybrid Energy Storage System for Electric Vehicles Based on Stochastic Dynamic Programming”, IEEE Vehicle Power and Propulsion Conference, 2010
8. Gao, Y., Gay, S.E., Ehsani, M., Thelen, R.F. et al., “Flywheel electric motor/generator characterization for hybrid vehicles”, IEEE 58th Vehicular Technology Conference, 2003
9. Martinez-Gonzalez, P., “A study on the integration of a high-speed flywheel as an energy storage device in hybrid vehicles”, PhD Thesis, Imperial College London, 2010
10. Cross, D. and Hilton, J., “High speed flywheel based hybrid systems for low carbon vehicles”, Hybrid & Eco Friendly Vehicles Conference, 2008
11. Diego-Ayala, U., Martinez-Gonzalez, P., and Pullen, K., “A Simple Mechanical Transmission System for Hybrid Vehicles Incorporating a Flywheel”, Hybrid & Eco Friendly Vehicles Conference, 2008
12. Charge Car, www.chargecar.org, accessed 05.10.2012