City, University of London Institutional Repository
Citation
:
Faggio, G., Silva, O. & Strange, W.C. (2017). Heterogeneous Agglomeration. Review of Economics and Statistics, 99(1), pp. 80-94. doi: 10.1162/REST_a_00604This is the published version of the paper.
This version of the publication may differ from the final published
version.
Permanent repository link:
http://openaccess.city.ac.uk/16577/Link to published version
:
http://dx.doi.org/10.1162/REST_a_00604Copyright and reuse:
City Research Online aims to make research
outputs of City, University of London available to a wider audience.
Copyright and Moral Rights remain with the author(s) and/or copyright
holders. URLs from City Research Online may be freely distributed and
linked to.
City Research Online: http://openaccess.city.ac.uk/ [email protected]
HETEROGENEOUS AGGLOMERATION
Giulia Faggio, Olmo Silva, and William C. Strange*
Abstract—Many prior treatments of agglomeration explicitly or implicitly assume that all industries agglomerate for the same reasons. This paper uses U.K. establishment-level coagglomeration data to document substan-tial heterogeneity across industries in the microfoundations of agglomera-tion economies. It finds robust evidence of organizaagglomera-tional and adaptive agglomeration forces as discussed by Chinitz (1961), Vernon (1960), and Jacobs (1969). These forces interact with the traditional Marshallian (1890) factors of input sharing, labor pooling, and knowledge spillovers, establishing a previously unrecognized complementarity between the approaches of Marshall and Jacobs, as well as others, to the analysis of agglomeration.
I. Introduction
T
HIS paper considers heterogeneity across industries in the microfoundations of agglomeration economies. Marshall (1890) notes the existence of three sources of agglomeration economies: labor pooling, input sharing, and knowledge spillovers. Many subsequent treatments of agglomeration either explicitly or implicitly suppose that all industries agglomerate for the same reasons, with the three Marshallian forces affecting all industries similarly. An important instance of this is the extrapolation of indivi-dual cases to the larger economy, such as the drawing of very general lessons about agglomeration from the specific case of the Silicon Valley. Another is the pooling of data to examine common tendencies in agglomeration even across industries that theory suggests would agglomerate differ-ently. This paper documents the existence of significant het-erogeneity and shows that its pattern has important implica-tions for our understanding of the nature of agglomeration economies.The paper’s empirical analysis focuses on the relation-ship between the coagglomeration of industry pairs and Marshallian links between industries. The motivation for this approach is that the variation in the characteristics of industries that colocate sheds light on the microfoundations of agglomeration economies. Ellison, Glaeser, and Kerr
(2010), who developed this approach, show that proxies for labor pooling, input sharing, and knowledge spillovers between an industry pair are positively and significantly related to colocation. Our paper explores how these results vary across industries, guided by classic non-Marshallian analyses of agglomeration. Jacobs (1969) stresses the unplanned nature of the creation of new work in cities, while Vernon (1960) discusses how cities help manage the instability involved in certain production processes. Chinitz (1961) argues for a positive role of small firms in the gen-eration of agglomgen-eration economies, another example of this non-Marshallian research. Similarly, Porter’s (1990) influential analysis of industry clusters identifies a positive role for competition. The pattern of heterogeneity that we document is consistent with these non-Marshallian micro-foundations that focus on adaptive and organizational fac-tors.1
Our analysis makes use of establishment-level data from the U.K. Business Structure Database (BSD) covering the years 1997 to 2008. We initially estimate benchmark mod-els of the relationship between measures of industry links and coagglomeration across all manufacturing industries, as in Ellison et al. (2010). We then consider heterogeneity in ways suggested by Jacobs’s and Vernon’s notions of adap-tation and Chinitz’s organizational approach, as well as by more recent research on the role of human capital in the agglomeration process (e.g., Rauch, 1993; Glaeser & Saiz, 2004; Moretti, 2004). Using coagglomeration to look at these aspects of agglomeration is unique in the literature. Furthermore, we examine the interaction between Marshal-lian forces and other elements of agglomeration rather than looking at Marshall as a rival to Jacobs and others, which is also unique and in contrast with the previous literature. In this sense, the paper is an attempt to create a de´tente between Marshall and Jacobs.
The empirical analysis leaves no doubt that agglomera-tion works differently for different industries. The key empirical results are as follows. First, in a great variety of coagglomeration models, we show the robust predictive power of Marshall’s agglomeration forces. This confirms prior work and supports our focus on interactions between Marshallian and non-Marshallian approaches. Second, a quantile regression that differentiates pairs by their ten-dency to coagglomerate provides results that are consistent with Jacobs’s analysis of unplanned knowledge spillovers and labor pooling. Third, differencing by entry and industry age provides robust evidence of an adaptive element to
Received for publication August 4, 2014. Revision accepted for publica-tion December 2, 2015. Editor: Gordon Hanson.
* Faggio: City, University of London; Silva: London School of Eco-nomics; Strange: University of Toronto.
This work was based on data from the Business Structure Database and the Quarterly UK Labour Force Survey, produced by the Office for National Statistics (ONS) and supplied by the UK Data Service Secure Lab. The data are Crown Copyright and reproduced with the permission of the controller of HMSO and Queen’s Printer for Scotland. The use of the data in this work does not imply the endorsement of ONS or the UK Data Service Secure Lab in relation to the interpretation or analysis of the data. This work uses research data sets that may not exactly reproduce National Statistics aggregates. We thank ESRC-UK, SSHRC-Canada, and STICERD-LSE for financial support and Simona Iammarino, William Kerr, and Gianluca Tarasconi for sharing data. We are grateful for the helpful comments we received from three referees, Gordon Hanson, Steve Gibbons, Stephan Heblich, Antonio Miscio, Henry Overman, Michael Storper, Jacques Thisse, and participants at various conferences and semi-nar presentations.
A supplemental appendix is available online at http://www.mitpress journals.org/doi/suppl/10.1162/REST_a_00604.
1The modern theoretical literature offers various formal results
consis-tent with the informal treatments in the classics. See, for instance, Duran-ton and Puga (2001, 2004), Strange, Hejazi, and Tang (2006), and Helsley and Strange (2001).
The Review of Economics and Statistics, March 2017, 99(1): 80–94
agglomeration, consistent with Vernon. This manifests itself more strongly in labor pooling and knowledge spil-lovers than in input sharing. Fourth, differentiation by the sector’s technology orientation and workforce education shows that agglomeration is not just a high-technology phe-nomenon. However, high-technology sectors show stronger evidence of knowledge spillovers, while low-technology industries show stronger evidence of input sharing and labor pooling. These findings are broadly consistent with learning playing an important role in the agglomeration pro-cess, as suggested by Jacobs and Vernon. Finally, agglom-eration effects, in particular those related to input sharing, tend to be stronger when firms are smaller, consistent with Chinitz.
In addition to building on the classics in the agglomera-tion literature, the paper also builds on more recent econo-metric work on agglomeration.2The line of research closest to this paper examines the relative importance of Marshal-lian forces using what might be called ‘‘horse race’’ models. For example, Audretsch and Feldman (1996) and Rosenthal and Strange (2001) regress levels of agglomeration on proxies for the presence of labor pooling, input sharing, and knowledge spillovers. Another recent approach is Jofre-Monseny, Marı´n-Lo´pez, and Viladecans-Marsal (2011), who estimate count models of new firms as functions of proxies for Marshallian forces. A related body of work consists of papers that separately consider Marshall’s three forces. See, among others, Fallick, Fleischman, and Rebitzer (2006), Almazan, De Motta, and Titman (2007), Davis and Dingel (2013), and Serafinelli (2015) on labor markets; Holmes (1999) on input sharing; and Jaffe, Traj-tenberg, and Henderson (1993), Arzaghi and Henderson (2008), and Lin (2012) on patents, networking and learning, and the creation of new work. This body of work presents persuasive evidence that the three Marshallian forces are present. Our paper provides further such evidence and extends this line of research by incorporating theories of organization and adaptation.
While the agglomeration literature has much to say about how agglomeration economies are generated, it has less to say about heterogeneity in microfoundations. Henderson, Kuncoro, and Turner (1995) show that agglomeration economies differ between high- and low-technology indus-tries in an analysis of urban growth. However, they consider whether agglomeration economies arise from own-industry activity or from urban diversity rather than directly consid-ering Marshall’s three forces. Together with Glaeser et al. (1992), this paper has spawned a literature that contrasts Marshall versus Jacobs rather than studying the interactions between Marshallian and non-Marshallian forces in charac-terizing heterogeneous agglomeration, as we do. More recently, Hanlon and Miscio (2014) estimate a dynamic
industry growth model and establish the importance of input-output linkages and labor pooling. Their results show that smaller firms both benefit from and produce stronger agglomeration effects. Glaeser and Kerr (2009) and Rosenthal and Strange (2010) also consider the idea that agglomeration economies are stronger when there are many small firms. In these papers, agglomeration is organiza-tional. Duranton and Puga (2001), although largely a theo-retical exercise, present empirical evidence on location decisions over an industry’s life cycle that is consistent with a model of cities as nurseries that tend to young industries. Strange et al. (2006) show a systematic tendency for indus-tries facing more uncertainty in Marshallian dimensions to agglomerate. In both of these papers, agglomeration is fun-damentally adaptive. As a group, this literature suggests that there is reason to believe that agglomeration economies are heterogeneous. Our analysis systematically documents the pattern of this heterogeneity and what this implies for our understanding of agglomeration economies.
Taken as a whole, our results argue for caution in extra-polation from individual cases of agglomeration. This is important because extrapolation from cases is a central part of the justification for cluster policy.3 Unfortunately, as satisfying as it is to draw conclusions from interesting and salient examples of agglomeration such as the Silicon Val-ley and computers or Detroit and cars, our findings show clearly that different industries respond differently to agglomerative forces. Similarly, our results suggest that one should interpret horse race models on the relative strength of agglomeration effects with care since these specifications do not allow for heterogeneous effects across industries. All of this is consistent with the advice offered by the cluster policy review paper by Chatterji, Glaeser, and Kerr (2013). Policymakers should recognize that agglomeration issues are complex, and there is much to recommend caution in cluster policies. Careful pilot projects have the potential to uncover what works and what does not for particular indus-tries. Policies that are consistent with growth in general are likely to help clusters emerge. Conversely, policies target-ing specific industries run the risk of picktarget-ing losers rather than winners, given the uncertainties associated with het-erogeneity in agglomeration economies.
The remainder of the paper is organized as follows. Sec-tion II discusses our empirical approaches. SecSec-tion III pre-sents the baseline Marshallian analysis. Section IV consid-ers Jacobs’s unplanned interactions, while section V considers heterogeneity. Section VI concludes.
II. Coagglomeration and Agglomeration Forces
A. Measuring Coagglomeration
Our analysis of microfoundations is based on the ten-dency of industries to colocate across metropolitan areas.
2See Hanson (2001), Rosenthal and Strange (2004), Behrens and
Robert-Nicoud (2014), and Combes and Gobillon (2014) for reviews of
We use the Ellison and Glaeser (1997) measure of coagglo-meration, which is standard in the field. LetNidenote total
employment in industry i, and nmi denote employment in
metropolitan areamand industryi. Letsmi¼nmi/Nidenote
the share of a given industry i’s employment in metropoli-tan aream, and letxmdenote the metropolitan area’s share
of national employment. For two industries i and j, the Ellison-Glaeser measure of coagglomeration can be written as (Ellison et al., 2010):
cCij ¼ PM
m¼1ðsmixmÞ smjxm
1PMm¼1ð Þxm 2
: (1)
This measure is related to the covariance of industries across metropolitan areas.
We construct measures of coagglomeration of U.K. man-ufacturing industries using data from the Business Structure Database (BSD) for the period 1997 to 2008. The data come from administrative records covering 99% of economic activity in the United Kingdom. We use BSD data at the local unit (i.e., plant or establishment) level, including both single- and multiplant enterprises. For each local unit, infor-mation is available on employment, industrial activity, year of birth (start-up date) and death (termination date), and postal codes. We use this detail to assign each local unit to a travel-to-work area (TTWA; see below). The raw data include approximately 3 million local units every year. After a series of data cleaning procedures, our data set com-prises more than 2 million plants annually over twelve years.4
To quantify coagglomeration, we focus on three-digit industries of the U.K. Standard Industry Classification (SIC) 1992 and restrict our attention to manufacturing
(SIC151–SIC372). In line with the literature, we do not consider other sectors (such as services) because measuring the extent of labor pooling, input sharing, and, especially, knowledge spillovers in those industries is challenging. After excluding and recombining sectors that present a lim-ited or erratic evolution in the number of plants or employ-ment, or both, we are left with a final sample of 94 manu-facturing three-digit industries. This gives 4,371 unique pairs a year over twelve years (1997–2008), for an overall count of 52,452 observations.
The level of geographical aggregation we use is the TTWA, geographical entities defined so that at least 75% of the resident population works in the area and 75% of the people working in the area reside there. TTWAs were devised to delineate areas that are self-contained labor mar-kets and economically relevant aggregates. As of 2007, there were 243 TTWAs in the United Kingdom. In our ana-lysis, we focus on 84 urban TTWAs with more than 100,000 residents. In some extensions, we also consider rural TTWAs and use other levels of aggregation such as regions.
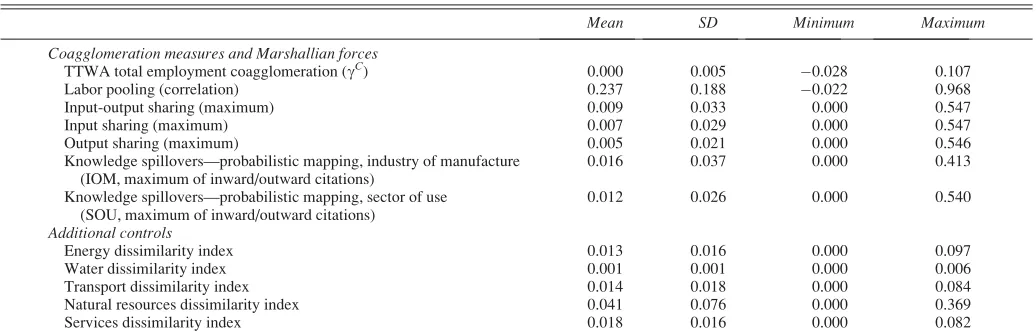
To measure coagglomeration, we compute Ellison et al.’s (2010)gCmeasure based on the total employment shares of the selected 94 three-digit industries contained in the 84 urban TTWAs. Descriptive statistics are presented in table 1. The mean and median ofgCare centered at 0 with a stan-dard deviation of 0.005, a minimum of0.028, and a maxi-mum of 0.107. Relative to Ellison et al. (2010), U.K. coag-glomeration displays less dispersion, although it is similarly skewed toward positive values.
In extensions to our core analysis, we use variants ofgC. In particular, we calculate (a) a measure of coagglomeration constructed using the number of plants rather than their employment, (b) a version ofgC
that excludes London, (c) a measure that includes single-plant companies only (d) a version that includes both urban and rural areas, and (e) a measure that excludes publishing (SIC221) and printing
TABLE1.—DESCRIPTIVESTATISTICS
Mean SD Minimum Maximum
Coagglomeration measures and Marshallian forces
TTWA total employment coagglomeration (gC) 0.000 0.005
0.028 0.107 Labor pooling (correlation) 0.237 0.188 0.022 0.968 Input-output sharing (maximum) 0.009 0.033 0.000 0.547 Input sharing (maximum) 0.007 0.029 0.000 0.547 Output sharing (maximum) 0.005 0.021 0.000 0.546 Knowledge spillovers—probabilistic mapping, industry of manufacture
(IOM, maximum of inward/outward citations)
0.016 0.037 0.000 0.413 Knowledge spillovers—probabilistic mapping, sector of use
(SOU, maximum of inward/outward citations)
0.012 0.026 0.000 0.540
Additional controls
Energy dissimilarity index 0.013 0.016 0.000 0.097 Water dissimilarity index 0.001 0.001 0.000 0.006 Transport dissimilarity index 0.014 0.018 0.000 0.084 Natural resources dissimilarity index 0.041 0.076 0.000 0.369 Services dissimilarity index 0.018 0.016 0.000 0.082
Data refer to pairwise combinations of manufacturing SIC1992 three-digit industries. The sample includes 94 three-digit sectors for a total of 4,371 unique pairwise correlations a year for twelve years (1997– 2008). The complete data set contains 52,452 observations. See the online appendix for details of included sectors and the text for details on construction of the other variables.
IOM¼industry of manufacture; SOU¼sector of use.
4We use data from England, Scotland, and Wales but drop Northern
[image:4.630.59.577.88.255.2]and reproduction of media (SIC222). Descriptive statistics of these alternative measures are very similar to those pre-sented in table 1. Furthermore, their correlation with our main measure is always high—between 0.76 (when only including single-plants firms) and 0.99 (when considering both urban and rural areas).
B. Marshallian Agglomeration Forces
Marshall attributes the spatial concentration of industry to three forces: labor pooling, input sharing, and knowledge spillovers. In this section, we discuss the variables we use in order to measure the flow of goods, people, and ideas across industrial pairs. Our proxies are deliberately very similar to those used in Ellison et al. (2010), which we con-sider to be best practice given available data. Descriptive statistics are presented in table 1.
To assess the potential for labor pooling, we use the 1995–1999 U.K. Labour Force Survey (LFS) data. The LFS is a representative survey of households living in the United Kingdom. The data report a worker’s industry and standard occupation classification (SOC) 1990. The U.K. SOC cate-gorizes occupations on the basis of skill level and content. We use the 331 occupation groups defined by the three-digit SOC classification in conjunction with the 94 three-digit manufacturing industries to calculate Shareio and Sharejo.
These measure the shares of employees of occupationoin industries i andj, respectively. Using this information, we measure the similarity of employment in industries i andj
by computing the correlation between Shareio andSharejo.
The mean value is 0.237 with a standard deviation of 0.188. To assess input sharing, we use the ONS input-output (I-O) analytical tables for 1995 to 1999.5 We calculate the shares of inputs that each industry within a pair buys from the other as fractions of their total intermediate inputs and the shares of outputs that they sell to each other as fractions of their total output, excluding direct sales to consumers. We then construct three different proxies for input-output linkages. First, we consider the maximum between the share of inputs that sectoriis buying from sectorj, and vice versa. Next, we recover the maximum between the share of output that sector i is selling to sector j, and vice versa. These capture upstream and downstream linkages, respec-tively. Finally, we consider the maximum of these two proxies as a synthetic measure of the linkages between pairs. The mean for all three proxies is close to 0, suggest-ing that most pairs do not share inputs to an important degree. In fact, 30% of the sector pairs do not share any input or output, while 75% of the pairs share less than 0.005.
To construct a proxy for knowledge spillovers, we track patent citation flows using information on U.K. inventors
contained in the European Patent Office (EPO) data for the years 1997 to 2009. Approximately 144,000 patents were filed by U.K. inventors over this period, generating more than 77,000 citations. Using this information, we measure the extent to which patents associated with industry i cite patents associated with industryjand vice versa. The main difficulty lies with creating a mapping between sectors and patents, which are categorized using technological classes rather than a standard industrial classification. Following the literature, we adopt two approaches and use a probabil-istic mapping based on the industry of manufacture (IOM) and an alternative probabilistic mapping based on the sector of use (SOU). After applying these procedures, we investi-gate the number of citations that a patent in sector i is receiving from patents in sectorjand the number of patents in sectorjthat a patent in sectoriis citing. These measures are analogous to the input sharing proxies described above. Our two indicators consider the maximum patent-citation flow between sectoriand sectorj, normalized by total cita-tions in that industry, using either the IOM or the SOU probabilistic mapping. Table 1 shows that average knowl-edge spillover shares are 0.012 (SOU) and 0.016 (IOM). Both distributions are highly skewed with median values on the order of 0.003/0.004 and 75% of the industries having citation flows below 0.011/0.013.
In addition to Marshallian agglomeration forces, we con-trol for access to resources and infrastructure that might affect location choices. Using the I-O tables, we gather information on industries’ use of primary resources and other nonmanufactured inputs in order to quantify industry-pair dissimilarity in these respects.6We measure dissimilar-ity of pairs as (one-half of) the absolute value of the differ-ence in the shares of the various inputs used by the pair. Specifically, we build a measure of the share of inputs that an industry is purchasing from the seven I-O primary nat-ural resource industries (including agriculture, forestry and fishing, and mining and quarrying). We also control for use of water and energy by separately considering the share of inputs bought from water-related service companies and from energy-related industries (both electricity and gas). Further, we consider the share of inputs bought from trans-port-related sectors (including railways, air, water, and other land transport) to control for the importance of trans-port costs. Finally, following Overman and Puga’s (2010) analysis of labor pooling, we create a proxy for access to business services by considering the share of inputs bought from this sector.7
5We refer to this as input sharing in line with prior use even though
there are both upstream and downstream elements to our measure, as in Krugman (1991).
6Ellison et al. (2010) use the U.S. spatial distribution of natural
resources, transport costs, and labor inputs to predict coagglomeration. This approach cannot be replicated in the United Kingdom because the geographical scale of the country makes the spatial distribution of resources and natural infrastructure much more homogeneous and because differences in the cost of resources, such as gas, oil, water, and electricity, are negligible due to regulatory constraints.
7This group includes computer services, R&D activities, legal
C. Beyond Marshall: Adaptive and Organizational Aspects of Agglomeration
As discussed in section I, there has been considerable empirical research on Marshall’s three forces. The literature on non-Marshallian aspects of agglomeration is much less developed. Within this literature, the approach that has received the most attention is Jacobs (1969), who focuses on adaptation, specifically on the unplanned nature of ‘‘the creation of new work.’’ It is common to treat Jacobs as pro-posing an alternative to Marshall, as in the Glaeser et al. (1992) and Henderson et al. (1995) papers on urban growth. There is a natural sense in which this is true. Marshall sees increasing-returns forces as promoting the spatial concen-tration of industry. Jacobs, in contrast, focuses primarily on knowledge spillovers and sees the creation of new work as being enhanced by local diversity. There is another sense, however, in which Jacobs and Marshall ought not to be pre-sented as polar opposites. Jacobs’s analysis of knowledge is certainly in the spirit of Marshall, and she clearly mentions the labor and input market aspects of the creation of new work.
In this spirit, this paper examines complementarities between Marshall and Jacobs and offers a novel approach to investigating these issues. Previous work has studied the Marshall-versus-Jacobs dichotomy by regressing measures of local productivity, growth, or wages on measures of local specialization or diversity, typically proxied by a Herfindahl index of industrial concentration. While the specialization measure is tightly tied to Marshall’s ideas, the diversity variable is only loosely linked to Jacobs. Her intuition is that a diverse city offers opportunities for unplanned, unpre-dictable, or otherwise unusual interactions among different industries, leading to increased creation of new work arising from these unexpected connections.
The idea behind our approach is to focus on differences between industry pairs that agglomerate frequently and those that do not. While there are many factors that deter-mine whether agglomeration is more or less common, the unplanned, unpredictable, or unusual interactions at the heart of Jacobs’s analysis are more likely to be found among industry pairs that are infrequently colocated. Con-versely, planned or otherwise predictable interactions that arise from strategic migration decisions and entrepre-neurial survival are likely to be found among industry pairs that colocate frequently. Following this logic, we investi-gate heterogeneity in the response to Marshallian forces between more and less coagglomerated industry pairs using quantile regressions to identify Jacobs-type agglomeration economies.
Jacobs is not Marshall’s only important successor in the study of agglomeration. In Chinitz (1961), New York dif-fers from Pittsburgh because its industry is organized in a less concentrated fashion, making it a friendlier environ-ment for start-ups and innovation. Porter (1990) similarly argues that competition is healthy for a business cluster.
Vernon (1960) writes about the importance of ‘‘instability’’ for increasing-returns industries, arguing that newer indus-tries with more entry are the ones that benefit more from locating in a large city. Others have emphasized the impor-tance of human capital (e.g., Rauch, 1993; Glaeser & Saiz, 2004; Moretti, 2004) and creativity (Florida, 2003), both of which are related to a city’s adaptive capacity. As with Jacobs, we believe these approaches to agglomeration should be seen as complements to Marshall rather than as substitutes or alternative explanations. This intuition informs our empirical work.
In order to test these non-Marshallian mechanisms, we examine the pattern of heterogeneity in Marshallian agglomeration effects using a sectoral breakdown that cap-tures the various non-Marshallian approaches. To begin, we use information collected by the OECD in 1997 to classify sectors as high or low technology. Next, we gather data on the share of college graduates in each industry using the LFS and classify sectors as high or low education according to whether this share is above or below the median (at 0.078). Finally, we use BSD data to split our sample along the following dimensions:
a. Sectors where the first year of opening of currently operating plants is above or below the median across all years and sectors (at 1967). These industries are labeled new and old, respectively.8
b. Sectors where the share of entrants—the incidence of new firms at timetin the total number of firms in that year—is above or below the median across all years and industries (at 0.10). These are labeled dynamic and steady sectors.
c. Sectors where the average size of the entrants—firms operating at timetthat did not exist at timet 1—is above or below the median size across all years and sectors (at 8.59). We label these as large entrant and small entrant sectors.
d. Sectors where the average size of the incumbents— firms operating both at timetandt 1—is above or below the median size across all years and sectors (at 18.95). These are labeled large incumbent and small incumbent sectors, respectively.
Given that the level of observation in our data set is the industry pair, we use this information to classify combina-tions where both sectors belong to one group (e.g., both high technology or both low technology) and mixed pairs where the two sectors belong to different groups (e.g., one high and one low technology). More details about the con-struction of these groupings, number of observations in each block, and further descriptive statistics are presented in table W1 in the online appendix.
8We rank industries by the age of the oldest currently operating plant,
We then study the pattern of heterogeneity in the inten-sity of the Marshallian forces across these groups to shed light on non-Marshallian approaches to agglomeration. In particular, we analyze heterogeneity along the new-versus-old and dynamic-versus-steady dimension to provide evidence about adaptive aspects of agglomeration, as in Vernon and Jacobs. We focus on the high technology-versus-low technology and high education-technology-versus-low edu-cation spectrum to quantify the importance of related ideas about human capital and adaptive capacity. Finally, we study heterogeneity along the dimensions of entrants’ and incumbents’ size to shed light on the organizational aspects of agglomeration, as in Chinitz.
III. Coagglomeration and Marshallian Microfoundations: U.K. Evidence
A. Univariate and Multivariate OLS Regression Analysis
In this section we study the microfoundations of agglom-eration economies by linking the proxies for the three Mar-shallian forces discussed above to industry-pair coagglo-meration. Our results come from regressions of the following kind:
cCijt¼ aþbLPLPijþbIOIOij
þbKSKSijþ
X5
k¼1kkDiss
k
ijþeijt; (2)
where cC
ijt is the Ellison et al. (2010) measure of
coagglo-meration between sectors i and j at timet; LPij, IOij, and
KSijare proxies for labor pooling (LP), input sharing (IO),
and knowledge spillovers (KS) between sectorsiandj aver-aged over the relevant years (see section IIB for details); and Disskij is one of the five measures of dissimilarity between sectorsiandjin terms of use of primary resources and nonmanufacturing inputs. Finally, eijt is an error term
uncorrelated with all other variables. We allow for an arbi-trary degree of correlation in the shocks of sector pairs over the years and cluster standard errors at this level. The data set consists of 4,371 unique combinations of 94 manufac-turing sectors over twelve years, giving a total of 52,452 observations.9Throughout the analysis, we standardize our variables to have unitary standard deviation.
As Ellison et al. (2010) note, the motivation for this approach is that the characteristics of industries that fre-quently colocate can shed light on the microfoundations of agglomeration economies. For instance, if industries that frequently buy from and sell to each other coagglomerate to a large degree, this suggests that input sharing is an
impor-tant agglomeration force. This in turn requires that coagglo-meration is related to the strength of the agglocoagglo-meration economies operating within the industry pair.
In addition to being intuitively appealing, Ellison et al. (2010, mathematical appendix) prove this property formally in the context of a specific model of agglomeration with industries partitioned into groups that must colocate in order to have a positive profit. With sequential location choices, in this all-or-nothing agglomeration model, indus-tries that benefit from coagglomeration will coagglomerate. They note that it is likely that this result would hold in weaker form with somewhat weaker agglomeration econo-mies. It is worth observing, however, that there is a funda-mental coordination problem in the determination of city composition (Helsley & Strange, 2014), and it is possible that coagglomeration fails to occur even when it would be mutually beneficial or that coagglomeration does occur when it is not. Nonetheless, there are good reasons to believe that equilibrium coagglomeration does increase when the strength of the agglomeration effect is stronger. First, there is a robust empirical relationship between proxies for agglomeration forces within an industry pair and equilibrium coagglomeration. In addition to Ellison et al. (2010), a number of papers (Kolko, 2010; Jacobs, Koster, & Van Oort, 2013; Gabe & Abel, 2013) find evi-dence of this sort. Thus, it seems that the selection among the multiple equilibria noted by Helsley-Strange is skewed in favor of a positive relationship between the benefits of coagglomeration and the coagglomeration that occurs in equilibrium. Second, O’Sullivan and Strange (2015) use an agent-based model to select from multiple-equilibrium city compositions. They also show a positive relationship between the strength of the spillovers within an industry pair and equilibrium coagglomeration.
Focusing on coagglomeration rather than on the cross-sectional pattern of industry clustering (as in Audretsch & Feldman, 1996, and Rosenthal & Strange, 2001), has addi-tional advantages. First, this approach looks directly at links between industry pairs and thus sheds light on the mechan-isms of agglomeration in a way that looking at the concen-tration of industries cannot. Second, studying the links between coagglomeration and pair-wise Marshallian forces helps dealing with unobservables that could bias the results when the unit of observation is the industry but are less likely to be important when the analysis is carried out at the industry-pair level. We return to this point in section IIIB. Of course, the emphasis we put on these advantages does not imply that we consider coagglomeration the only valid approach to studying agglomeration microfoundations. We simply argue that it is a valid approach and one we can flex-ibly use to study heterogeneous patterns by neatly charac-terizing the nature of industry pairs.
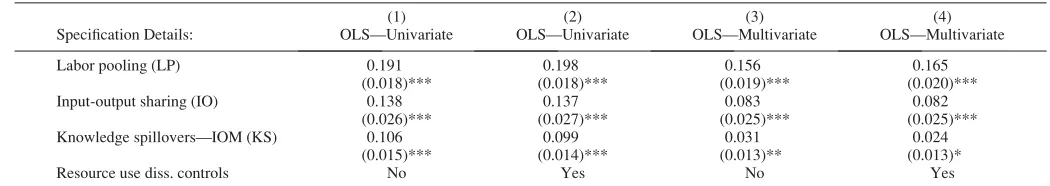
The first set of results is presented in table 2. Columns 1 and 2 tabulate results from univariate regressions where we consider only one Marshallian force at a time (and include dissimilarity controls in column 2). The results show that
9Our proxies for the Marshallian forces are measured at the beginning of
labor pooling has the largest and most significant associa-tion with coagglomeraassocia-tion. A 1 standard deviaassocia-tion increase corresponds to 19% of a standard deviation increase in gC. For input sharing and knowledge spillovers, the correspond-ing increases are 14% and 10%, respectively. This pattern is consistent with Ellison et al. (2010), who also document weaker agglomerative effects from knowledge spillovers. Interestingly, controlling for the dissimilarity proxies does not change in any meaningful way the three Marshallian coefficients, suggesting that access to natural resources and nonmanufacturing industries does not bias the results in simple models without the additional controls.
Columns 3 and 4 present coefficients from the multivari-ate regressions. We still find labor pooling to have the strongest relationship with coagglomeration with an esti-mated effect of approximately 0.16 of a standard deviation. On the other hand, the coefficients on input sharing and knowledge spillovers decline to 0.082 and 0.024–0.031, respectively. All in all, our findings are comparable to Elli-son et al. (2010), with all three of Marshall’s forces show-ing a positive relationship with coagglomeration.
We carry out a number of robustness checks. Results are reported in table W2 in the online appendix. First, we study whether upstream linkages are more important than down-stream connections. We find that the effect of input sharing is twice as large as the effect of output sharing, but this dif-ference is not significant and does not affect the other coef-ficients. Second, we investigate whether focusing on a spe-cific year in our sample changes the picture. To do so, we run regressions for 1997, 2002, and 2008 separately. We find a slight attenuation in the effects of LP, IO, and KS as we move toward more recent years, but the differences are not substantial. Third, we investigate whether using the proxy for knowledge spillovers based on the SOU probabil-istic mapping affects the findings. The conclusions reached so far still hold: all three Marshallian forces matter, though the effect of labor pooling seems somewhat weaker. We also find that the link with knowledge spillovers is stronger with this proxy, while the effect of input sharing is weaker. Since the SOU mapping is partly based on the technology (and the related patents) contained in goods bought and sold as intermediates across industrial sectors, it incorporates some of the linkages stemming from input sharing and attenuates the effect of IO. Given this issue, our preferred
proxy uses the IOM mapping that we use throughout the rest of the paper.10
Finally, we check that our results are not affected if we change our measure of coagglomeration to be based on (a) number of plants as opposed to total employment, (b) local units belonging to single-plant enterprises only, (c) both urban and rural areas. We also experiment with excluding publishing (SIC221) and printing and related activities (SIC222) since these sectors are classified among services in the U.S. industrial classification. None of these robust-ness checks affect our findings.
B. Addressing Endogeneity Concerns
The literature on the microfoundations of agglomeration economies has put forward two sources of possible bias in OLS estimation: reverse causation and sorting. In this section, we discuss these issues and provide a set of robustness checks and Instrumental Variables (IV) estimates to address them.
The reverse causation argument is laid out in Ellison et al. (2010). Firms in industries with strong Marshallian links could choose to locate together in order to benefit from those links. Alternatively, firms that locate together for other reasons could later forge Marshallian links. In contrast to Ellison et al. (2010), we see the reverse phenom-enon of coagglomeration leading to productive links as being a type of agglomeration economy. For instance, if two firms realize after choosing locations that they can hire from the same labor market, then they benefit from labor pooling. Similarly, if two firms learn from each other ex post, then the resulting technological improvement is an instance of knowledge spillovers. These agglomeration economies are in fact in the spirit of Jacobs (1969), who gives numerous examples of accidental agglomeration
TABLE2.—THERELATIONSHIP BETWEENCOAGGLOMERATIONgCANDMARSHALLIANFORCES
(1) (2) (3) (4)
Specification Details: OLS—Univariate OLS—Univariate OLS—Multivariate OLS—Multivariate Labor pooling (LP) 0.191 0.198 0.156 0.165
(0.018)*** (0.018)*** (0.019)*** (0.020)*** Input-output sharing (IO) 0.138 0.137 0.083 0.082
(0.026)*** (0.027)*** (0.025)*** (0.025)*** Knowledge spillovers—IOM (KS) 0.106 0.099 0.031 0.024
(0.015)*** (0.014)*** (0.013)** (0.013)* Resource use diss. controls No Yes No Yes
See the note to table 1 and the online appendix for details on definitions of variables. Variables are standardized to have zero mean and unit standard deviation. Robust standard errors clustered on industry pairs are reported in parentheses. All regressions consider the period 1997 to 2008. Significant at ***1%, **5%, and *10%.
10One related concern is that input-output linkages partly capture
[image:8.630.52.577.91.184.2]economies. Even so, we describe below a strategy to address this issue and arrive at estimates that capture the effect of Marshallian links on agglomeration rather than the reverse.
As for sorting, the main concern is that agglomeration, which increases productivity in possibly unobservable ways, might be correlated with coagglomeration. To clarify matters, consider two industries, apparel and printing/pub-lishing, which are agglomerated for historical reasons in London. Assume that both industries are highly productive because of some advantages connected to this location. Further assume that more productive industries are able to use a wider range of workers because they are better at spotting the ‘‘right types’’ in a large agglomerated market. Conversely, think of two other industries, such as wood laminate and manufacturing of furniture, that operate in a small city, are low productivity, and are not efficient at sharing workers. Estimating the effect of labor pooling on coagglomeration by comparing these pairs would bias the results by conflating the true effect of LP with a productive advantage arising because of urbanization economies enjoyed by firms locating in more agglomerated places. Although this argument is logically correct, the unobserva-bles that would give rise to these patterns would need to have a particular structure and imply that agglomeration is correlated to both coagglomeration and the strength of the linkages between sectors measured by our proxies. One of the advantages of the method that Ellison et al. (2010) developed is that by studying the relation between coloca-tion and industry-pair links, the approach deals with a num-ber of unobservables that are not easily related to pair-specific linkages. Therefore, we believe that the arguments brought forward in the literature do not undermine our findings.
A number of robustness checks, reported in online ap-pendix table W3 and discussed in the online apap-pendix, provide further support for this conclusion. These include approaches that address reverse causation, a possible corre-lation between agglomeration and coagglomeration, and the
possibility that industrial organization affects coagglomera-tion. None of these checks substantially changes our findings.
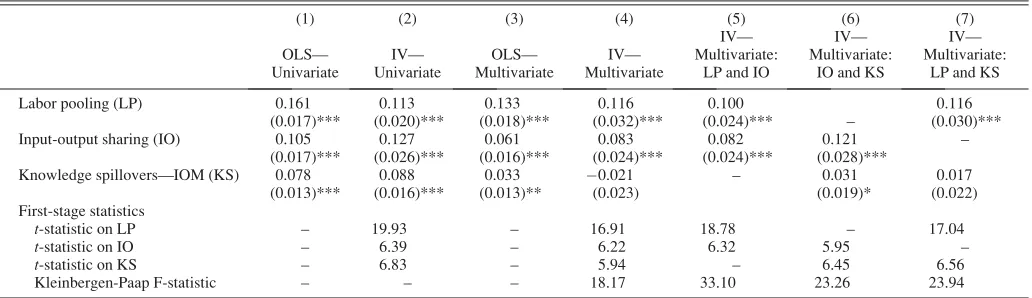
To conclude this section, we discuss a number of IV regressions where we instrument the three Marshallian forces using proxies constructed using U.S. data. This approach follows Ellison et al. (2010). We instrument LP using a measure of the correlation between sector pairs in their use of different types of workers as categorized by the National Industrial-Occupation Employment Matrix (NIOEM) published by the U.S. Bureau of Labor Statistics. We instrument IO with an identical measure obtained using the 1987 Benchmark Input-Output Accounts published by the Bureau of Economic Analysis (BEA). Finally, we instrument the flows of patent citations among U.K. inven-tors as recorded by the EPO using the flows of citations among US inventors as tracked by the NBER patent data-base. More information is provided in the online appendix. The validity of this approach relies on thoroughly control-ling for colocation that is driven by natural advantages and shared use of nonmanufacturing resources. Hence, in all our IV specifications we include the proxies for sector dissimilarities.
Results are presented in table 3. Following Ellison et al. (2010), we exclude pairs where the two three-digit indus-tries fall in the same two-digit group and a number of sec-tors that were aggregated in the data construction process. Columns 1 and 3 show that OLS results do not change as a result of these exclusions. Column 2 presents IV regressions where we include and instrument one Marshallian force at the time. The IV coefficients are very close to their OLS counterparts in column 1. Column 4 presents multivariate IV regressions where we enter and instrument all three Mar-shallian forces simultaneously. We find positive and signifi-cant effects for LP and IO. The size of the associations is similar to the OLS counterparts (see column 3). However, KS loses its significance and turns slightly negative. We believe this is due to collinearity between measures that makes instrumented knowledge spillovers hard to
disentan-TABLE3.—INSTRUMENTALVARIABLEREGRESSIONS
(1) (2) (3) (4) (5) (6) (7) OLS—
Univariate
IV— Univariate
OLS— Multivariate
IV— Multivariate
IV— Multivariate:
LP and IO
IV— Multivariate:
IO and KS
IV— Multivariate:
LP and KS Labor pooling (LP) 0.161 0.113 0.133 0.116 0.100 0.116
(0.017)*** (0.020)*** (0.018)*** (0.032)*** (0.024)*** – (0.030)*** Input-output sharing (IO) 0.105 0.127 0.061 0.083 0.082 0.121 –
(0.017)*** (0.026)*** (0.016)*** (0.024)*** (0.024)*** (0.028)***
Knowledge spillovers—IOM (KS) 0.078 0.088 0.033 0.021 – 0.031 0.017 (0.013)*** (0.016)*** (0.013)** (0.023) (0.019)* (0.022) First-stage statistics
t-statistic on LP – 19.93 – 16.91 18.78 – 17.04
t-statistic on IO – 6.39 – 6.22 6.32 5.95 –
t-statistic on KS – 6.83 – 5.94 – 6.45 6.56 Kleinbergen-Paap F-statistic – – – 18.17 33.10 23.26 23.94
[image:9.630.61.577.90.239.2]gle from labor pooling and input sharing. A similar argu-ment is put forward by Ellison et al. (2010), who report in their appendix weak results when instrumenting KS. To partly address this issue, in columns 5 to 7, we enter the proxies for Marshallian forces two at a time. In column 5, we include LP and IO and confirm that both have a positive and significant association with gC. In column 6, we con-sider IO and KS. We find that both measures are positively and significantly associated with coagglomeration and that the KS estimate is very similar to the one documented using OLS (see column 3). Finally, in column 7, we instrument LP and KS and find that both are positively associated with coagglomeration. Although only LP is significant at con-ventional levels, the coefficient on KS points in the right direction and is reasonably sizable—at about half of its OLS counterpart. All in all, the evidence in table 3 confirms our previous findings and supports our claim that endogene-ity is unlikely to bias OLS results significantly.
IV. Heterogeneous Agglomeration: Jacobs Meets Marshall
This section begins the presentation of results that allow for heterogeneity across industries. Specifically, it takes a new approach toward examining Jacobs’s (1969) analysis of how new work is created by exploring complementarities between Jacobs and Marshall. The approach has at its core a simple idea: the coagglomeration of industries that only rarely colocate is different from the coagglomeration of
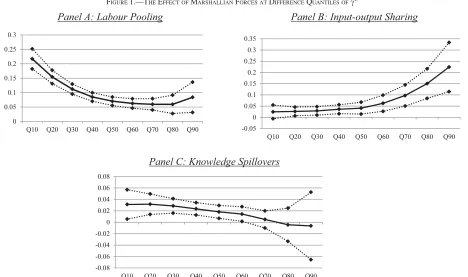
industries that are often found together. It is the former that captures the sorts of unplanned, unpredictable, or unusual interactions that Jacobs has in mind. To test this idea, we estimate the Marshallian models discussed in the previous section without constraining the Marshallian forces to have the same effect for all industry pairs. More precisely, we estimate equation (2) in a way that allows the effects to vary between the most and least coagglomerated pairs. This esti-mation is carried out using quantile regressions that simul-taneously include all three Marshallian forces, as well as controls for natural advantages. Figure 1 presents the results for labor pooling, input sharing, and knowledge spillovers. The confidence intervals come from bootstrapped standard errors clustered on industry pairs.
It is immediately clear that the pattern of aggregate results in table 2 conceals considerable variation across industry pairs. Figure 1.A presents results for labor pooling. There is clear heterogeneity across pairs according to their coagglomeration. While labor pooling has a positive and statistically significant contribution to industry-pair coag-glomeration across the board, the effect is much larger for the less coagglomerated pairs. Labor pooling has an asso-ciation of around 0.22 and 0.16 (both significant) for indus-try pairs in the two bottom deciles, declining to around 0.06 to 0.08 (significant) in the top half of the coagglomeration distribution. Figure 1B shows a pattern for input sharing that is exactly opposite. For this force, the association is lar-ger for the most coagglomerated pairs. The input-sharing coefficient increases from approximately 0.03
(insignifi-FIGURE1.—THEEFFECT OFMARSHALLIANFORCES ATDIFFERENCEQUANTILES OFgC
Panel A: Labour Pooling Panel B: Input-output Sharing
Panel C: Knowledge Spillovers 0
0.05 0.1 0.15 0.2 0.25 0.3
Q10 Q20 Q30 Q40 Q50 Q60 Q70 Q80 Q90 -0.05
0 0.05 0.1 0.15 0.2 0.25 0.3 0.35
Q10 Q20 Q30 Q40 Q50 Q60 Q70 Q80 Q90
-0.08 -0.06 -0.04 -0.02 0 0.02 0.04 0.06 0.08
Q10 Q20 Q30 Q40 Q50 Q60 Q70 Q80 Q90
[image:10.630.85.553.83.360.2]cant) for the bottom decile to 0.15 and 0.23 (both signifi-cant) for the top two deciles. Figure 1C shows yet another pattern, with the effect of knowledge spillovers positive and significant up to the 60th percentile. The coefficient becomes smaller over the range, declining from 0.03 in the bottom decile to 0.02 at the median, and the estimation becomes increasingly imprecise for the most coagglomer-ated industries, for which the effect is no longer signifi-cantly different from 0.
The pattern of heterogeneity has interesting implications for Jacobs’s ideas. The input sharing results in figure 1B are contrary to Jacobs. They suggest that input sharing primar-ily is associated with the colocation of pairs that coagglo-merate extensively. There is little to be gained from links between industries that are not very coagglomerated. In other words, there is strong evidence that interactions that are most typical and are likely to be planned have the lar-gest association with coagglomeration. It is useful to con-sider an example from Marshall. He writes, ‘‘Many cutlery firms [in Sheffield] for instance put out grinding and other parts of their work, at piece-work prices, to working men who rent the steam power which they require, either from the firm from whom they take their contract or from some-one else’’ (Marshall, 1890, p. 172). Our data show that Sheffield continues to be a center of cutlery production today (table W4 in the online appendix). Moreover, cutlery and manufacturing of basic iron and steel is one of the most highly coagglomerated pairs. It is entirely understandable that a cutlery maker would deliberately plan its location to secure its metal input supply.11
The results on labor pooling and knowledge spillovers, however, are much more in the spirit of Jacobs. Regarding knowledge spillovers, the effects are not even significant for highly coagglomerated pairs. As for labor pooling, the effects diminish drastically as coagglomeration increases. In other words, both of these sorts of interactions between industries have a larger effect when the industries colocate less frequently and interactions are more likely to be the sort of unexpected connections on which Jacobs focuses. There is an interesting parallel here to the Duranton and Puga (2001) nursery city phenomenon: certain interactions have greater effects with less frequent colocation; others have greater effects with more frequent colocation.
Three issues are worth considering. First, working at the TTWA level of aggregation could affect our findings, since Marshallian forces have different effects at different geo-graphical scales (Rosenthal & Strange, 2003, 2008). As noted previously, TTWAs are defined by commuter flows, which depend on the scale of labor markets. This could make it more likely to find a relationship between coagglo-meration and labor pooling than one between coagglomera-tion and input sharing, since input-output linkages could
take place over greater distances. To address this issue, we replicate the analysis using eighteen macroregions (as defined in the BSD data). Our results are presented in figure W1 in the online appendix and fully confirm our findings. We also check whether our results change if we maintain the original TTWA geography but focus only on the 28 big-gest cities and conurbations out of 84—the top 30%. We find this is not the case.
Second, the labor pooling proxy is based on the correla-tion between the two industries’ occupacorrela-tion mixes, while the input-sharing variable is constructed using maximum flows in the sector pair. This could imply that our approach is skewed toward picking up significant input-output lin-kages only for highly coagglomerated industries, while the labor pooling measure could be more significant in other parts of the distribution. We believe this issue does not affect our conclusion since we find that knowledge spil-lovers behave very much like labor pooling, despite being measured in the same way as input sharing (i.e., as the max-imum flow of patent citations across pairs). This suggests that the pattern we observe is not mechanically driven by the way our proxies are constructed.
Third, we do not observe whether coagglomeration has arisen from unplanned or unpredictable accidents, as in Jacobs. Instead, we only observe industry pair coagglo-meration. Although this is likely to be related to whether coagglomeration is planned or unplanned, other forces also contribute to whether an industry pair coagglomerates. For instance, pollution controls could make it more difficult for heavy industries to colocate. Agglomeration and dispersion forces such as these introduce noise into the process deter-mining coagglomeration and create measurement error in the mapping between the planned or unplanned nature of agglomeration and colocation frequency. Presumably this measurement issue would make it more difficult to obtain the striking pattern in the quantile models—in particular, the remarkable difference between labor pooling and input sharing. This suggests that our findings might understate the heterogeneity of agglomeration forces along the planned–unplanned dimension.
V. Heterogeneous Agglomeration: Adaptation and Organization
A. New Industries and Entry
This section presents our empirical results on the adapta-tional and organizaadapta-tional aspects of agglomeration econo-mies. We extend the traditional Marshallian approach by examining how the patterns of coagglomeration depend on the interaction between Marshallian forces and the nature of the industry in question. We therefore allow Marshall’s microfoundations to be complementary to other explanations.
We begin with adaptation and nursery city ideas, which are considered by estimating models based on two parti-tions of industry pairs. The first focuses on industry age,
11See table W4 for other highly coagglomerated industry pairs, such as
captured by the age of the oldest active plant. The second focuses on the share of new firm entry in the industry. This approach generates the partitions of pairs detailed in section II. For age, the new industries group includes pairs where both sectors are younger than the median age across indus-tries. For entry, the dynamic industries group includes pairs where both industries have an entrant share that is above the median. In both cases, we include additional controls for, respectively, age and entry share averaged across the two sectors in the pair.12
Results are reported in table 4. For industry age, we find the largest agglomeration effects for new industry pairs. This is true for all three Marshallian forces. For labor pool-ing, the effects are smaller for the mixed and old industry pairs (at 0.153 and 0.081, respectively) than for new pairs (at 0.310). However, all coefficients are highly significant, and the extent of variation in these effects is more muted than for the other two Marshallian forces. The knowledge spillover results are very much in the nursery city/unstable industry spirit discussed above. They show knowledge effects that are five to ten times stronger for young pairs, at 0.236 (significant), than for mixed and old pairs, at 0.040 (significant) and 0.026 (insignificant), respectively. The
same is true for the results on input and sharing. The coeffi-cients move from 0.270 (significant) for new industry pairs to 0.049 (insignificant) for the mixed group, and finally to 0.041 (significant) for old pairs. While the pattern of input sharing effects is not consistent with a nursery city model, the heterogeneity in the coefficients for knowledge spil-lovers clearly supports this theory.
The results have a relatively similar pattern for industry dynamism. Labor pooling is always significant, with the coefficients for the three groups fairly constant and ranging between 0.181 and 0.144. We still find that the largest result for knowledge spillovers occurs for the dynamic industries at 0.181 (significant). This shrinks to 0.033 (significant) and
0.020 (insignificant) for mixed and steady industry pairs. Input-output linkages are closer to a nursery pattern in these dynamic-industry models than in the previous age grouping. Input sharing displays significant coefficients for the mixed and the steady pairs, at 0.103 and 0.052, respectively, and has no significant effect for dynamic industries.13
B. High Technology and High Education
We now turn to the related issue of how the relationship between Marshallian forces and coagglomeration depends on the technological status of the industry in question. As noted above, we characterize an industry’s technological status (high technology or not) according to the OECD (1997) classification. This generates three types of industry pairs: both high technology, both low technology, or mixed. We estimate equation (2) for each type.
Results are reported in table 5. We find that labor pooling is significant in all three groups, but its association with coagglomeration is much larger for the low-technology
TABLE4.—HETEROGENEOUSAGGLOMERATION: ADAPTATION
(1) (2) (3)
New Mixed Old
Labor pooling (LP) 0.310 0.153 0.081 (0.058)*** (0.026)*** (0.021)*** Input-output sharing (IO) 0.270 0.049 0.041
(0.083)*** (0.030) (0.018)** Knowledge spillovers—IOM (KS) 0.236 0.040 0.026
(0.121)** (0.017)** (0.019) Number of observations/pairs 12,972/1,081 26,508/2,209 12,972/1,081
Dynamic Mixed Steady Labor pooling (LP) 0.181 0.144 0.180
(0.059)*** (0.026)*** (0.028)*** Input-output sharing (IO) 0.113 0.103 0.052
(0.095) (0.031)*** (0.021)** Knowledge spillovers—IOM (KS) 0.181 0.033 0.020
(0.074)** (0.018)* (0.015) Nuber of observations/pairs 12,972/1,081 26,508/2,209 12,972/1,081
See the note to table 1 and the online appendix for details on definitions of variables. Specification as in column 4 of table 2 plus one of the following variables averaged across sector pairs: first year of opening (top panel) or entry share (bottom panel). Pairs refer to unrepeated sector combinations. Significant at ***1%, **5%, and *10%.
12Our models are at the industry-pair level. Because of this, binning
provides a more straightforward approach to study complementarities between Marshallian and non-Marshallian theories than interacting Mar-shallian forces with industry characteristics. Consider, for example, firm size. We are interested in how Marshallian links between industry pairs relate to firm size, as in Chinitz. Following the binning approach, we con-struct three groups of industry pairs. In the first, both industries are char-acterized by small firms; in the second, the pair is charchar-acterized by large firms. Chinitz makes sharp predictions about what we should expect for these groups. The third group has mixed pairs, with one characterized by small firms and the other by large firms. In this case, Chinitz does not make any predictions. While it would be possible to construct an average firm size variable and estimate an interactive specification, the presence of mixed pairs would compromise the interpretation of the results from such an approach. We discuss this issue further in the online appendix where we also present additional evidence (table W5).
13The results in table 4 and elsewhere continue to hold if we focus on
[image:12.630.74.577.90.270.2]industry group (at 0.332) than for the high-technology group (at 0.046). Input sharing also has the largest coeffi-cient in the low-technology group, at 0.091. While input sharing has positive coefficients for all three groups, the high-technology coefficient is small and insignificant. Knowledge spillovers display the opposite pattern. The lar-gest coefficient is found for high-technology (significant at 0.053), while the effect is smaller and insignificant for low-technology (at 0.039).
These results clearly show that agglomeration economies are not simply a high-technology phenomenon. Labor pool-ing has a stronger effect in the low-technology group, while input sharing is stronger in the mixed- and low-technology groups of industry pairs. Knowledge spillovers, reassur-ingly, are different, with the largest effect for high-technol-ogy industries. This suggests that some of the weaker results for knowledge spillovers reported above, and also presented in Ellison et al. (2010), arise because the sample includes low-technology industries (as well as old and steady indus-tries) where knowledge spillovers are not important.
Table 5 also presents results of a similar exercise where industries are partitioned according to workers’ education levels. In these specifications, we further control for the average share of college graduates across the pair in order to control for direct effects of this variable within groups. The pattern of results is similar to the high-technology ver-sus low-technology heterogeneity discussed above. Knowl-edge spillovers have significant effects in high-education (at 0.048) and mixed-education (at 0.050) industry pairs, but not in low-education pairs (insignificant at 0.030). Con-versely, input sharing and labor pooling have the largest and most significant effects in low-education pairs, at 0.123 and 0.391, respectively. These shrink to 0.007 (insignifi-cant) and 0.046 (borderline signifi(insignifi-cant) for the high-educa-tion pairs.
Taken as a group, these findings are broadly consistent with learning playing an important role in the
agglomera-tion process. Jacobs (1969) calls this phenomenon ‘‘the creation of new work.’’ Vernon (1960) instead discusses the process by which new products reach stability. The evi-dence is also consistent with Duranton and Puga’s (2001) nursery city phenomenon, where new products are created in diverse cities and move to specialized cities upon reach-ing maturity. They provide evidence of firm migration fol-lowing this pattern in France to support their conclusions. To the best of our knowledge, our paper is the first to exam-ine coagglomeration in this light. The observation that only high-technology/high-education pairs are found to have their coagglomeration associated with stronger knowledge links between the industries is consistent with the nursery city idea. So is the finding that low-technology/low-educa-tion pairs have coagglomeralow-technology/low-educa-tion associated with the some-what more routine labor and input links.
C. Industrial Organization
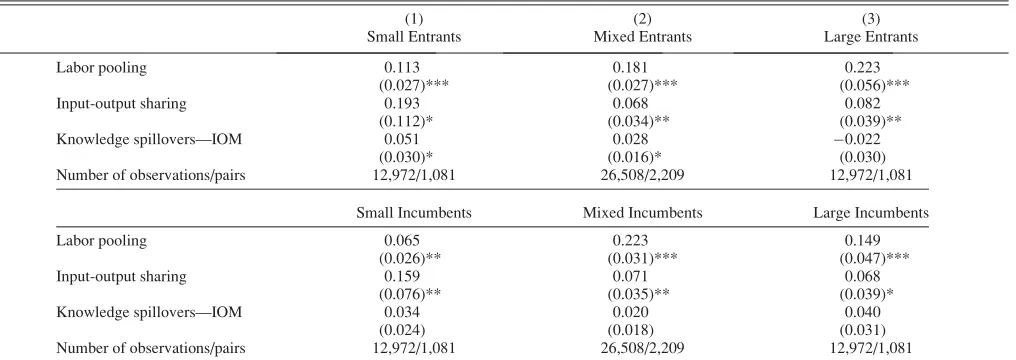
The final set of results deals with industry structure. We consider both a partition based on the size of entrants and another one based on the size of incumbents. Both splits correspond to Chinitz (1961), who argues that the presence of small firms allows entry by other small firms.14
Results are presented in table 6. As above, the table reports results for the three Marshallian forces estimated over three groups of industry pairs. The models include controls for, respectively, entrant size and incumbent size averaged across the pair, alongside the usual controls for natural advantages. The results are consistent with a small-firm effect, with the largest coefficient found on input shar-ing for the small entrants’ and small incumbents’ models (significant at 0.193 and 0.159, respectively). It is worth
TABLE5.—HETEROGENEOUSAGGLOMERATION: TECHNOLOGY ANDEDUCATION
(1) (2) (3)
High Technology Mixed Technology Low Technology Labor pooling (LP) 0.046 0.110 0.332
(0.017)*** (0.019)*** (0.049)*** Input-output sharing (IO) 0.020 0.064 0.091
(0.012) (0.020)*** (0.045)** Knowledge spillovers—IOM (KS) 0.053 0.031 0.039
(0.024)** (0.016)* (0.041) Number of observations/pairs 7,140/595 24,780/2,065 20,532/1,711
[image:13.630.64.578.90.275.2]High Education Mixed Education Low Education Labor pooling (LP) 0.046 0.167 0.391
(0.023)* (0.031)*** (0.061)*** Input-output sharing (IO) 0.007 0.066 0.123
(0.013) (0.029)** (0.057)** Knowledge spillovers—IOM (KS) 0.048 0.050 0.030
(0.020)** (0.021)** (0.040) Number of observations/pairs 12,972/1,081 26,508/2,209 12,972/1,081
See the notes to table 5 for details. Regressions in the bottom panel further control for the share of college graduates averaged across sector pairs. Significant at ***1%, **5%, and *10%.
14Chinitz focuses on the industrial organization of cities, not sectors.
noting that input sharing is significant for all groups in both models. However, the effects are substantially smaller for industries characterized by mixed and large entrants and incumbents, ranging between 0.068 and 0.082. The labor pooling coefficients are all significant and comparable in magnitude in the three entrant- and the three incumbent-size models. Estimates are above 0.10 for all but one group-ing and mainly in the 0.15 to 0.20 range. Finally, as in all the regressions so far, knowledge is not a consistent predic-tor of coagglomeration in the universe of models. In this case, we find that knowledge flows are significant and siz-able only in the small-entrant sample (at 0.051) and in the mixed-entrant group (at 0.028). They are instead insignifi-cant and small, but always positive and between 0.020 and 0.040, for all three groups of incumbents.
Chinitz focused largely on input sharing among small firms as a driver of agglomeration. Our results are consistent with his approach. Conversely, Vernon and Jacobs offer anecdotes of knowledge spillovers generated by large and small firms alike. Our results on coagglomeration seem to suggest, however, that the effect of knowledge flows is more systematic for small entrants. Regarding labor pooling, neither Vernon nor Jacobs directly engages with the implica-tions of firm size for this agglomerative force. While the coefficients on labor pooling are significant for all sizes of entrants and incumbents, we find the smallest coefficients for small entrants and small incumbents. One factor that could potentially come into play is labor poaching, where firms hire away each other’s skilled workers (Combes & Duranton, 2006). If small firms are threatened to a greater degree by the possibility of poaching, they might be less likely to colocate with firms hiring from the same labor pool.
D. Robustness
In this section we discuss a number of issues that could affect the findings set out in tables 4 to 6 and report on a
series of robustness checks to address them. First, we con-sider again whether the spatial scale used to construct gC
affects our results. Following the approach taken in section IV, we measure coagglomeration using regions instead of TTWAs and rerun our analysis. As shown in table W6 in the online appendix, the patterns discussed above continue to hold. We also find that our results do not change if we calculategCusing both urban and rural TTWAs (results not tabulated). Second, in the regressions presented so far, we controlled for the attribute used to partition the sample averaged across the pair—for example, the average entry share or the average size of incumbents. In some extensions (not tabulated for space reasons), we check whether control-ling for the dissimilarity of the sector pair’s characteristics affects our results. We measure dissimilarity as (half of) the absolute value of the difference in the shares of the relevant attribute across the pair. We find that controlling for dissim-ilarity produces very similar results to controlling for the average. A third issue is that the pattern documented above might be related to the extent of localization of the industry pairs in the different groups. To consider this possibility, we perform all the regressions as in tables 4 to 6, adding a control for the average localization index (i.e.,gfrom Elli-son & Glaeser, 1997) across the pair. This does not affect the results in any significant way.15 Fourth, we assess the robustness of our findings relative to the details of the industrial classification we use. In particular, we consider whether our results are driven by the presence of two-digit sectors that are subdivided into many three-digit groupings. To do so, we exclude all two-digit industries partitioned in more than five three-digit subgroups. Although this leaves us with a quarter of the original sample, this exclusion does not affect our results. Alternatively, we drop all pairs where
TABLE6.—HETEROGENEOUSAGGLOMERATION: ORGANIZATION
(1) (2) (3)
Small Entrants Mixed Entrants Large Entrants
Labor pooling 0.113 0.181 0.223
[image:14.630.71.579.90.270.2](0.027)*** (0.027)*** (0.056)*** Input-output sharing 0.193 0.068 0.082
(0.112)* (0.034)** (0.039)** Knowledge spillovers—IOM 0.051 0.028 0.022
(0.030)* (0.016)* (0.030) Number of observations/pairs 12,972/1,081 26,508/2,209 12,972/1,081
Small Incumbents Mixed Incumbents Large Incumbents
Labor pooling 0.065 0.223 0.149
(0.026)** (0.031)*** (0.047)*** Input-output sharing 0.159 0.071 0.068
(0.076)** (0.035)** (0.039)* Knowledge spillovers—IOM 0.034 0.020 0.040
(0.024) (0.018) (0.031) Number of observations/pairs 12,972/1,081 26,508/2,209 12,972/1,081
See the notes to table 5 for details. Regressions further control for the following variables averaged across sector pairs: size of entrants (top panel) and size of incumbents (bottom panel). Significant at ***1%, **5%, and *10%.
15The correlation between coagglomeration and localization of