Web-of-Service Software Reusability Prediction
using Heterogenous Ensemble Classifier
Prakash V. Parande, M. K. Banga
Abstract: WoS computing environment is expected to have numerous parallel computing engines. Presently, software professionals or developers often want to reuse existing software components to exhibit a task with time-efficient and cost effective solutions. However, software component reusability in uncontrolled manner leads to failure, pre-mature shutdown and software smells or aging. This paper develops a novel evolutionary computing assisted ensemble classification system for WoS software reusability prediction. This applies different base learners such asNaïve Bayes (NB), Linear Regression (LR), Decision Tress (DT),Logarithmic Regression (LOGR),and Support Vector Machine (SVM),Multivariate Adaptive Regression Spline (MARS). Once training the base learners, the outputs of each classifier have been processed with majority vote.The computation in conjunction with weighted sum enabled final labelling of each software class. The performance results affirmed that the present work ensemble classifier has better performance with respect to base classifiers.
Keywords: Ensemble classifier; heterogeneous ensemble; web-of-service; software reusability prediction.
.
1. INTRODUCTION
The vital roles and high ability makes software an inevitable entry in modern scenario. The software component signifies anon-dependent section of software application in the form of set of codesand standardized parts, classes, and tests cases etc [1]. The process of reusing existing functionsto achieve efficient software solution for computational time and resource cost is called software reusability [2]. However, the excessive or uncontrolled reuse of software component could lead faults or aging related symptoms, sometimes called software smells [2][3]. In such cases assessing reusability extant of each software component can help avoiding aging or fault like events [4]. The work considers Object Oriented Programming (OOP) concept with software metrics such asCoupling between Object (CBO), Depth of Inheritance Tree (DIT), and Weighted Method per
Revised Manuscript Received on July 25, 2019.
Prakash v. Parande,
Research Scholar, School of Computing & Information Technology, Reva University, Bangalore-560064, India, [email protected]
Dr. M. K. Banga,
Ex - Director of School of Computing and information technology, Reva University, Bangalore 560 064, Professor, Dept of CSE, Dayanandsagar University, Bangalore 560 068
Class (WMC), Line of Code (LOC), Number of Children (NOC), and Lack of Cohesion in Methods (LCOM) [5-8]. In ensemble of classifiers,single decisions are merged to categorize new examples which are the base/weak classifiers [9][10]. Ensembles are familiar to lower the risk of opting the unethical model by clustering all candidates [9][10][13].
In feature-level fusion, attributes are entangling from multiple event info or data sets, and merged into anindividualappended feature vector[11]. Brooks et.al., [12] described feature-level fusion as ahighoptionfor correlated data and DLF is uncorrelated thusit’s a better option. Performing training of each base learner over data subsets, the ensemble has been prepared using majority vote and weighted sum method. Performing two-class classification each class has been predicted as REUABLE and NON-REUSABLE. The overall proposed system has been developed using MATLAB 2017a software where the performance analysis affirmed that the proposed ensemble concept exhibits better performance than the classical base learners.
2. RELATED WORK
Singhani et al. [15] examined various factors influencing inspection of OOP software for an Analytical Hierarchical Process (AHP) model. OO-CK metrics can achieve software re-usability estimation and quality characterization [16-18]. Definition of threshold values for each CK metrics can enable fault resilient reusability prediction [19, 20]. In [21, 22] CK metrics is conceptualized to identify minimal OOP parameters of software design and reusability was predicted in each class. Zahara et al. [23] used Machine learning regression algorithms to perform reusability prediction for independent variables characterizing reuse-proneness of the classes in OOP software metrics. Torkamani [24] explored the possibility of other OOP-software metrics to perform reusability prediction. Similarly, it is also recommended OOP metrics for suitable software design[25]. There is a derived metrics of software to examine quality features of software parts in customizability, reusabilityand complexity[26]. They applied interface mechanism to estimate Component Reusability (CR) and Component Ruse Level (CRL) to
compute the reuse
indicator for IRL as well as reuse proneness indicator. J. Kittler [27] stated that the use of classifier ensembles with decision-level fusion can be significant for multi-class multi-classification. Polikar et al. [28] designed an ensemble of classifiers by exploiting data from different sources and combined the base learners by means of a weighted voting scheme. AdaBoost [29] involves sub-sampling the training examples which has been applied in numerous classification problems[30].However their efficacy for highly correlated features or data seems confined. To achieve higher reliability of prediction, ensemble approach was recommended in [31, 32]. Benediktsson et.al., [33] too affirmed suitability of ensemble classifier for multi-class classification, especially derived using machine learning concept. To further augment performance prediction fusion was also recommended in [34, 35].It found that the accuracy of ensemble depends on the learner fusion for which easy averaging (i.e. maximum vote) can be a potential approach [36]. It elaborated that empirically verified ensembles aregeneralize well [37]. Briem et al. [38] used different classifiers on multiple source data having imagery of multiple spectral, Synthetic Aperture Radar (SAR) data and graphic topological information [39, 40]. Different approaches for ensemble formation were recommended in [41]. It is recommended to have predominant methods like varioushybrid strategies, classifier models, feature subsets and training set based ensemble. However lacks efficacy with multi-class classification with highly correlated features. To further augment it, integrated boosting and bagging is used to create fuzzy ensemble classifiers. Different feature sets with Principle Component Analysis (PCA) based feature selection was used in [42] to perform Rotation Forest ensemble classification. Rotation forest was used in [43] to perform to class classifications for the cancer datasets. Later, AdaBoost and Rotation Forest was combined together to develop a new ensemble RotBoost [44], where it can perform better than the classical base learners. Rotation Forest and IDE [45] was combined in [46]. SVM ensemble was recommended in [47] for spectrogram classification. As enhanced solution selection based SVM ensemble driven withclonal immunity algorithm is proposed in [48]. An ensemble NN was proposed in [49]. Partalas et al. [50] developed the preferred ensemble concept based on Focused Ensemble Selection (FES) with diversity classifiers. Amalgamating different base learners to derive an ensemble classifier has exhibited better performance than the base learner alone [51, 52]. Moderated Asymmetric Naïve Bayes classifiers (MANB) [53]homogeneous ensemble settinghave a base classifier. An ensemble pair approach is presented in [54] whichachieve better performance with respect to bagging, ensemble approaches, and ECOC. In [55], Dempster's rule of combination is used to hybridk-NN, Rocchio classifiers andSVM, and a better
performance is observedwhen compared with base classifiers.
3. PROBLEM FORMULATION
Considering the significance of a robust software reusability estimation system, this paper focuses on developing an “Ensemble Classifier” algorithm with OO-software metrics and classes without imposing aging or smells. “Ensemble Classifiers” have been assessed for small readily available benchmark datasets such as Iris, Spambase, and Satellite etc; however efficacy of such algorithms with large scale and real time applications environment often remains suspicious. Thus it used 100 software modules developed using Java programming language with OO-programming concept using online software repository named “Sourceforge”.
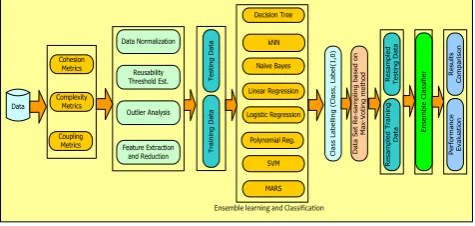
In proposed model DLF approach with majority vote scheme has been implemented and best base classifiers propagated to the Ensemble Classifier foraugmentation of the reliability and accuracy of the reusability prediction system. The snippet of the proposed ensemble classification model based WoS software reusability prediction in Fig. 1.
Data Cohesion Metrics Complexity Metrics Coupling Metrics Reusability Threshold Est. Outlier Analysis Feature Extraction and Reduction Data Normalization Naïve Bayes Linear Regression Logistic Regression Polynomial Reg. SVM MARS Decision Tree T es ti n g D at a T ra in in g D at a C la ss L ab el lin g ( C la ss , La b el (1 ,0 ) D at a S et R e-sa m p lin g b as ed o n M ax -V o ti n g m et h o d R es am p le d T es ti n g D at a R es am p le d T ra in in g D at
a Ense
m b le C la ss if ie
r Res
u lt s C o m p ar is o n P er fo rm an ce E va lu at io n
[image:2.595.316.554.368.481.2]Ensemble learning and Classification kNN
Fig. 1. Implementation Schematic of the proposed Ensemble Learning based Reusability Prediction
4. Ensemble Classifier Based Web of Service Software Reusability Prediction
The base learners and allied ensemble formation approachdiscusses the following:
4.1. WoS software reusability data preparation
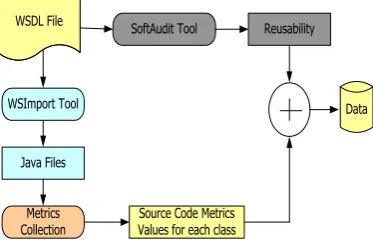
100 OOP based software have consider WoS software, to convert into Java file using WSDL tool (Fig. 2). WSDL signifies the XML-based interface definition language
characterizes web services
WSDL File
Data SoftAudit Tool Reusability
WSImport Tool
Java Files
Metrics
[image:3.595.70.257.52.173.2]Collection Values for each classSource Code Metrics
Fig. 2. Data Preparation for the proposed use case-study
Table 1. Mapping from WSDL to JAVA file.
WSDL document JAVA document
wsdl:portType Service Endpoint Interface (SEI) class
wsdl:portType/wsdl:operation Approaches of the generated SEI class
wsdl:service wsdl:service/wsdlport
Service class
getABCPort() methods of the Service class
4.2. Data normalization and outlier analysis
Here, each data element of the class is mapped to the allied normalized value in the range of [0, 1]. Thus, the normalized value is obtained as (4.1).
(4.1)
4.3. Feature selection
A snippet of the univariate logistics regression (ULR) algorithm is depicted as follows:
4.3.1. Uni-variate logistic regression (ulr) assisted metrics characterization
ULR states the level of significance of each metrics towards reusability estimation of each class.
(4.2)
and state the dependent and independent variables, correspondingly. The variable states the probability factor of significance.
(4.3) 4.3.2. Rough Set Analysis (RSA) based feature
extraction
RSA can be obtained in the form of classification results or reduced data elements that enable swift and precise computation. The detailed of the RSA is given as follows: Step-1: Feature Set Selection
In this step, extracted CK suite metrics for each class of the software are collected.
Step-2: Feature set (Data) Discretization
Here, the extracted data is discretized using K-means clustering algorithm.
Step-3: Lower/Upper Approximation for all feasible data sets
Itestimates the lower and the upper values as the union of all comprising feature sets (Step-2).
(4.4) Upper approximation value signifies the union of all the encompassing sets with unit non-zero intersection with X.
(4.5) Step-4 :Accuracy estimation for the considered
feature sets
Here, we have retrieved a factor stating accuracy of X in A using (4.6).
(4.6)
Cardinality of a set signifies the lower or upper approximation of .
Step-5 : Approximated (Feature Set) Selection
All possible sets are selected with equality of accuracy of the universal set. Later, the obtained data set with optimal cardinal possibility are chosen as the minimal set to be used for “Ensemble Learning and Classification”.
4.4. Ensemble learning for software reusability prediction
Base learners have been trained over the data subsets whose outputs have been combined together to achieve better accuracy.
4.4.1. Decision tree algorithm
C5.0 classifier [51] used as a base classifier that exhibits recursive partitioning over the extracted OOP-metrics. 4.4.2. Enhanced kNN Classifier
KNN classifier applies Euclidean distance to estimate inter-attribute distance using following expression:
(4.7)
Where and are subjected to be compared with n features.
4.4.3. Logistic regression
LR algorithm constitutes a prediction scheme to examines reuse proneness of a class.
(4.8)
and signifies the dependent and independent variables, correspondingly. Practically, vary from 0 to 1 to to . LR outcome is stated as
[image:3.595.22.305.224.285.2]
4.4.4. Polynomial regression
Univariate Polynomial Regression (UPR) for the th polynomial order:
(4.10)
where variables and states for the independent and the dependent variables and , ... signify the constant and coefficients, respectively.
(4.11)
For multivariate 2nd order PR analysis, it is estimated on the basis of the two variables,
(4.12)
4.4.5. Naive bayes classification
NB allocates specified object to class
using Bayes′ rule.
(4.13) signifies the probability of the parameter before observing the data. The factor refers the likelihood of data .
(4.14)
4.4.6. Support Vector Machine (SVM)
To perform prediction, SVM model applies the function derived in (4.15).
(4.15) states the non linear transform and is retrieved by reducing the risk of regression.
(4.16)
The parameter states the cost function, while refers the penalties for error estimation.
(4.17)
The parameters and are Lagrange multipliers, where .
(4.18)
Where, states the kernel function.
4.4.7. Multivariate Adaptive Regression Splines (MARS)
MARS functions of “Divide-and-conquer” policy retrieved OO-CK metrics data, which is divided into the different regions with respective regression equation.
(4.19)
Y states dependent and X states independent variable. The parameter states the fixed coefficients and (X) states the basis functions.
Splitting m-1 out of m feature sets (Subsets)
D1 D2 Dm
D1 D2 Dm
Original OO-CK Feature Set or
Original Data
DT
Train Feature Sets using a randomly selected
classifier
If Classifier increases Accuracy then add it to the Ensemble; Else Exclude it
Weighted Sum based Ensemble Decision
Majority Vote on each base classifiers and Output the Class with the largest Vote kNN RF ULR PLR
LR SVM MARS NB ...
...
[image:4.595.343.515.207.574.2]Performance Evaluation
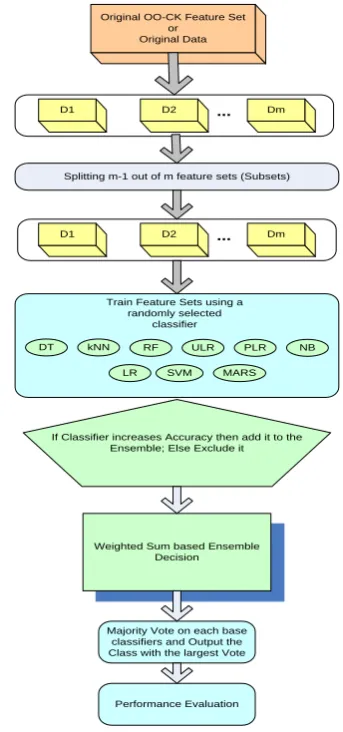
Fig. 3. Proposed Ensemble Based Classifier
4.4.8. Ensemble structure
The maximum weighted computational class from all base classifiers is chosen as class of prediction (4.20):
(4.20)
signifies the weight of base classifiers, refers the reusability prediction output.
5. RESULTS AND DISCUSSION
5.1. Performance assessment
Relative performance is examined using estimating performance of each base learners and ensemble learners. Ensemble classification concept with DLF enables higher accuracy and minimum error.
5.1.1. Classification Accuracy Assessment
[image:5.595.313.550.55.185.2]The assessment of the developed ensemble classification model (Table 2).
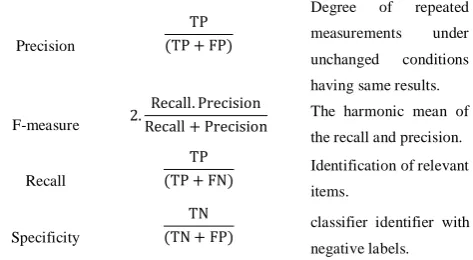
Table 2. Performance Parameter
Parameter Mathematical Expression Definition
Accuracy
Predicted fault prone
module
Precision
Degree of repeated
measurements under
unchanged conditions
having same results.
F-measure
The harmonic mean of
the recall and precision.
Recall
Identification of relevant
items.
Specificity
classifier identifier with
negative labels.
[image:5.595.45.543.203.531.2]The performance parameters and their respective values are given in Table 3.
Table 3. Performance values
Techniques Accuracy(%) Precision(%) F-Measure(%) Recall(%) Specificity(%)
Decision Tree 91.31 90.01 91.65 91.02 82.64
Naïve Bayes 81.40 95.45 88.59 81.78 71.00
kNN 88.43 87.31 89.93 88.99 87.74
Linear Regression 85.71 84.60 86.82 81.30 84.24
Polynomial Regression 89.01 90.48 92.31 89.95 91.04
Logistic Regression 87.91 90.32 91.73 90.16 88.04
SVM (Polynomial) 93.41 94.97 95.52 91.04 91.27
MARS 88.12 93.20 94.20 89.70 96.00
Proposed Ensemble 97.02 95.64 96.18 94.93 97.01
5.1.2. Error Profiling
Ensemble learning intends to reduce error of prediction by amalgamating different classifiers and their respective performances over the original feature data.
5.1.2.1 Mean absolute error (MAE)
(5.1)
where refers the calculated output, while states for the expected value.
5.1.2.2 Mean magnitude of the relative error (MMRE)
(5.2)
To deal with overflow conditions ( ), 0.01is added to denominator. Thus, MMRE i
(5.3)
5.1.2.3 Standard Error of the Mean (SEM)
Mathematically, SEM is presented as (5.4).
(5.4)
where and are standard deviation and total number of samples, respectively.
Table 4 Error performance by the different base learners and the ensemble classifier
Techniques MAE MMRE RMSE SEM
Decision Tree 0.0990 0.7000 0.0200 0.0900
Naïve Bayes 0.1557 0.8623 0.1209 0.0276
kNN 0.2102 0.7432 0.1953 0.1003
Linear Regression 0.2390 0.8418 0.2052 0.1167
Polynomial
Regression
0.1859 0.8016 0.0591 0.962
Logistic Regression 0.1968 0.8073 0.542 0.1331
SVM (Polynomial) 0.1904 0.8001 0.0245 0.1090
MARS 0.2040 0.8210 0.2002
Proposed Ensemble 0.0027 0.0631 0.0091 0.0087
CONCLUSIONS
This paper proposes anensemble learning concept using machine learning. WoS data was obtained from 100 software developments using Object Oriented Programming (OOP) concept. The software data is processed with WSDL followed by Chidamber and Kamrer (CK) metrics estimation. The extracted CK-metrics data is processed for Min-Max normalization followed by outlier detection that avoided premature convergence issues significantly. Furthermore, RSA feature extraction technique enabled selection of only relevant and significant attributes related to software (class) reusability. Considering other base classifiers such as neural network and its variant, shows these approaches suffer from local minima and convergence, and therefore evolutionary
such issues. This as a result could yield more efficient and reliable ensemble classification.
REFERENCES
1. G. Caldiera, and V.R. Basili, “Identifying and qualifying reusable
softwareT components,”T IEEET Software,T vol.T 24,T pp.T 61-70,T
1991.T
2. I.T Sommerville,T “SoftwareT Engineering”.T 9thT Edition,T
Addison-Wesley,T NewT York,T 2011.
3. G.T Singh,T “MetricsT forT measuringT theT qualityT ofT
object-orientedT software,”T ACMT SIGSOFTT SoftwareT EngineeringT
Notes,T vol.T 38,T pp.T 1-5,T 2013.T
4. M.T M.T Stapic,T “ReusabilityT metricsT ofT softwareT
components:T Survey”,T conferenceT paperT ·T September,T 2015.
5. S.T SrivastavaT andT R.T Kumar,T "IndirectT methodT toT
measureT softwareT qualityT usingT CK-OOT suite,"T IntelligentT
SystemsT andT SignalT ProcessingT (ISSP),T InternationalT
ConferenceT on,T Gujarat,T pp.T 47-51,T 2013.
6. B.T M.T Goel,T PradeepT KumarT BhatiaT “T AnalysisT ofT
reusabilityT ofT object-orientedT systemT usingT CKT metrics”,T
InternationalT JournalT ofT ComputerT Applications,T vol.T 60,T
no.10,T 2012.
7. N.S.T BakarT “TheT analysisT ofT object-orientedT metricsT inT
C++T programs”,T LectureT NotesT onT SoftwareT Engineering,T
vol.T 4,T no.T 1,T 2016
8. A.T T.T MohammadT “MetricT suiteT toT evaluateT reusabilityT
ofT softwareT productT line”,T InternationalT JournalT ofT
ElectricalT andT ComputerT EngineeringT (IJECE),T vol.T 4,T no.T
2,T pp.T 285-294,T 2014.
9. L.T Nanni,T S.T Brahnam,T S.T Ghidoni,T andT A.T Lumini,T
“TowardT aT General-PurposeHeterogeneousT EnsembleT forT
PatternT Classification,”T ComputationalT IntelligenceT andT
Neuroscience,T vol.T 2015.T
10. M.T Barghash,T “AnT effectiveT andT novelT neuralT networkT
ensembleT forT shiftT patternT detectionT inT controlT charts,”T
ComputationalT IntelligenceT andT Neuroscience,T vol.T 2015,T
ArticleT ID939248,T 2015.
11. G.T Tsoumakas,T L.T Angelis,T I.T Vlahavas,T SelectiveT fusionT
ofT heterogeneousT classifiers,T IntelligentT DataT AnalysisT Vol.T
9T (6),T pp.T 511–525,T 2005
12. R.T R.T Brooks,T P.T Ramanathan;T A.T M.T Sayeed,T
“DistributedT TargetT ClassificationT andT TrackingT inT SensorT
Networks,T ProceedingsT ofT theT IEEET Vol.T 91,T pp.T
1163-1171,T 2003.
13. C.T Dong-Sheng,T etT al.,T TheT boosting:T aT newT ideaT ofT
buildingT models,T Elsevier,T Amsterdam,T PAYS-BAS,T 2010,T
vol.T 100,T pp.1–11.
14. K.T M.T Ting,T Z.Zheng,T AT studyT ofT AdaboostT withT NaïveT
BayesianT classifiers:T weaknessT andT improvement,T
ComputationalT IntelligenceT Vol.T 19(2),T pp.T 186–200,T 2003.
15. H.T Singhani,T R.T P.T SuriT “TestabilityT assessmentT modelT
forT objectT orientedT softwareT basedT onT internalT andT
externalT qualityT factors”,T GlobalT JournalT ofT ComputerT
ScienceT andT Technology:T CT SoftwareT &T DataT
Engineering,T vol.T 15,T no.5,T 2015.
16. M.T Mijac,T Z.T Stapic,T “ReusabilityT metricsT ofT softwareT
components:T Survey”,T CentralT EuropeanT conferenceT onT
InformationT andT IntelligentT systemT conferenceT paperT ·T
September,T 2015.
17. S.T SrivastavaT andT R.T Kumar,T "IndirectT methodT toT
measureT softwareT qualityT usingT CK-OOT suite,"T IntelligentT
SystemsT andT SignalT ProcessingT (ISSP),T InternationalT
ConferenceT on,T Gujarat,T pp.T 47-51,T 2013.
18. B.M.T Goel,T andT P.K.T Bhatia,T “AnalysisT ofT reusabilityT ofT
object-orientedT systemT usingT CKT metrics,”T InternationalT
JournalT ofT ComputerT Applications,T Vol.60,T No.10,T pp.0975–
8887,T 2012.
19. L.H.T Rosenberg,T andT L.E.T Hyatt,T “SoftwareT qualityT
metricsT forT object-orientedT environments,”T CrosstalkT Journal,T
vol.T 10,T pp.T 1-16,T 1997
S.R.T Chidamber,T and.T C.T F.T Kemerer,T “AT metricsT suiteT
forT objectT orientedT design,”T IEEET TransactionsT onT
SoftwareT Engineering,T vol.T 20,T pp.T 476-493,T 1994.IEEET
PressPiscataway,T NJ,T USA.
20. R.T Shatnawi,T W.T Li,T J.T Swain,T andT T.T Newman,T
“FindingT softwareT metricsT thresholdT valuesT usingT rocT
curves,”T JournalT ofT SoftwareT MaintenanceT andT Evolution:T
ResearchT andT Practice,T vol.T 22,T pp.T 1-16,T 2010.JohnT
WileyT &T Sons,T Inc.NewT York,T NY,T USA.
21. P.T Neelamdhab,T S.T Satapathy,T R.T Singh,T (2017).T UtilityT
ofT anT ObjectT OrientedT ReusabilityT MetricsT andT EstimationT
Complexity.T IndianT JournalT OfT ScienceT AndT Technology,T
10(3).
22. NormiT ShamT AwangT AbuT BakarT “TheT analysisT ofT
object-orientedT metricsT inT C++T programs”,T LectureT NotesT onT
SoftwareT Engineering,T SpringerT ,vol.T 4,T no.T 1,T 2016.
23. S.T I.T Zahara,T M.T Ilyas,T andT T.T Zia,T "AT studyT ofT
comparativeT analysisT ofT regressionT algorithmsT forT
reusabilityT evaluationT ofT objectT orientedT basedT softwareT
components,"T OpenT SourceT SystemsT andT TechnologiesT
(ICOSST),T InternationalT ConferenceT on,T Lahore,T pp.T 75-80,T
2013.
24. TorkamaniT M.T A.T “MetricT suiteT toT evaluateT reusabilityT ofT
softwareT productT line”,T InternationalT JournalT ofT ElectricalT
andT ComputerT EngineeringT (IJECE),T vol.T 4,T no.T 2,T pp.T
285-294,T 2014.
25. A.T Aloysius,T andT K.T Maheswar,T “AT reviewT onT
componentT basedT softwareT metrics”,T Intern.T J.T FuzzyT
MathematicalT Archive,T vol.T 7,T no.T 2,T pp.T 185-194,T
2015.ISSN:T 2320T –3242T (P),T 2320T –3250T (online)
26. E.S.T Cho,T M.S.T Kim,T andT S.D.T Kim,T (2001)T “ComponentT
metricsT toT measureT componentT quality,”T ProceedingsT ofT
theT 8thT AsiaT PacificT SoftwareT EngineeringT ConferenceT
(APSEC),T Macau,T vol.T 4-7,T pp.T 419-426,T 2001.
27. J.T Kittler,T Multi-SensorT IntegrationT andT DecisionT LevelT
Fusion.T Proc.T DERA/IEET WorkshopT IntelligentT SensorT
ProcessingT 2001,T 1-6.
28. R.T Polikar,T D.T Parikh;T Shreekanth;T Mandayam.T MultipleT
ClassifierT SystemsT forT MultisensorT DataT Fusion.T SAST 2006T
-T IEEET SensorsT ApplicationsT SymposiumT 2006,T 180-184.
29. Schapire,T R.T E.T AT BriefT IntroductionT toT Boosting.T
ProceedingsT ofT theT SixteenthT InternationalT JointT ConferenceT
onT ArtificialT IntelligenceT 1999,T 1401-1406.
30. T.T G.T Dietterich,T MachineT learningT research:T FourT currentT
directions.T AIT MagazineT 1997,T 18,T 97-T 136.
31. M.T Barghash,T “AnT effectiveT andT novelT neuralT networkT
ensembleT forT shiftT patternT detectionT inT controlT charts,”T
ComputationalT IntelligenceT andT Neuroscience,T vol.T 2015,T
ArticleT ID939248,T 2015.
32. L.T Nanni,T S.T Brahnam,T S.T Ghidoni,T andT A.T Lumini,T
“TowardT aT General-PurposeHeterogeneousT EnsembleT forT
PatternT Classification,”T ComputationalT IntelligenceT andT
Neuroscience,T vol.T 2015.
33. J.T AT Benediktsson,T J.T Chanussot,T andT M.T Fauvel,T
MultipleT classifierT systemsT inT remoteT sensing:T fromT basicsT
toT recentT developments.T In:T M.T Haindl,T J.T Heidelberg,T
Germany:T Springer,T 501–512,T 2007.T
34. F.T Roli,T G.T Giacinto,T G.T Vernazza,T MethodsT forT
designingT multipleT classifierT systems.T ProceedingsT ofT theT
secondT internationalT
workshopT onT multipleT
Cambridge,T UK,T 78–87,T 2001.
35. Banfield,T R.,T etT al.,T AT comparisonT ofT decisionT treeT
ensembleT creationT techniques.T IEEET TransactionsT onT
PatternT AnalysisT andT MachineT Intelligence,T 29,T 173–180,T
2007.
36. L.T Hansen,T P.T Salamon,T NeuralT networkT ensembles.T IEEET
TransactionsT onT PatternT AnalysisT andT MachineT Intelligence,T
12,T 993–1001,T 1990.
37. D.T Opitz,T J.T Shavlik,T J.,T ActivelyT searchingT forT anT
effectiveT neural-networkT ensemble.T ConnectionT Science,T 8T
(3/4),T 337–353,T 1996.
38. G.T J.T Briem,T G.J.,T Benediktsson,T J.A.,T J.T R.T Sveinsson,T
MultipleT classifiersT appliedT toT multisourceT remoteT sensingT
data.T IEEET TransactionsT onT GeoscienceT andT RemoteT
Sensing,T 40T (10),T 2291–2299,T 2002.
39. B.T Waske,T J.A.T Benediktsson,T FusionT ofT supportT vectorT
machinesT forT classificationT ofT multisensorT data.T IEEET
TransactionsT inT GeoscienceT andT RemoteT Sensing,T 45,T 3858–
3866,T 2007.
40. L.I.T Kuncheva,T CombiningT classifiers:T softT computingT
solution,T in:T S.K.A.T PalT (Ed.),T PatternT Recognition:T FromT
ClassicalT toT ModernT Approaches,T WorldT Scientific,T
Singapore,T 2001,T pp.T 427–451.
41. J.T Canul-Reich,T L.T Shoemaker,T L.O.T Hall,T EnsemblesT ofT
fuzzyT classifiers,T in:T IEEET InternationalT FuzzyT SystemsT
Conference,T pp.T 1–6,T 2007.
42. J.J.T Rodriguez,T L.I.T Kuncheva,T RotationT forest:T aT newT
classifierT ensembleT method,T IEEET TransactionsT onT PatternT
AnalysisT andT MachineT IntelligenceT 28T (10)T (2006)T 1619–
1630.
43. K.T H.T Liu,T D.T S.T Huang,T CancerT classificationT usingT
rotationT forest,T ComputersT inT BiologyT andT MedicineT 38,T
601–610,T 2008.T
44. Chun-XiaT Zhang,T Jiang-SheT Zhang,T RotBoost:T aT techniqueT
forT combiningT rotationT forestT andT AdaBoost,T PatternT
RecognitionT LettersT 29,T pp.T 1524–1536,T 2008.T
45. K.T Tumer,T N.C.T Oza,T InputT decimatedT ensembles,T PatternT
AnalysisT Application,T vol.T 6,T pp.T 65–77,T 2003.
46. L.T Nanni,T A.T Lumini,T EnsembleT generationT andT featureT
selectionT forT theT identificationT ofT studentsT withT learningT
disabilities,T ExpertT SystemsT withT ApplicationsT 36,T pp.3896–
3900,T 2009.
47. LorisT Nanni,T AlessandraT Lumini,T InputT decimatedT ensembleT
basedT onT neigh-T borhoodT preservingT embeddingT forT
spectrogramT classification,T ExpertT SystemsT withT ApplicationsT
36,pp.T 11257–11261,T 2009.
48. X.T Zhang,T S.T Wang,T T.T Shan,T L.C.T Jiao,T SelectiveT
SVMsT ensembleT drivenT byT immuneT clonalT algorithm,T in:T
Rothlauf,T F.T (Ed.)T ProceedingsT ofT theT EvoWork-T shops,T
Springer,T Berlin,T pp.T 325–333,T 2005.
49. Z.H.T Zhou,T J.T Wu,W.T Tang,T EnsemblingT neuralT networks:T
manyT couldT beT betterT thanT all,T ArtificialT IntelligenceT 137T
(1–2),T 239–263,T 2002.
50. I.T Partalas,T G.T Tsoumakas,T I.T Vlahavas,T FocusedT ensembleT
selection:T aT diversity-basedT methodT forT greedyT ensembleT
selection,T in:T ProceedingsT ofT theT 18thT InternationalT
ConferenceT onT ArtificialT Intelligence,T pp.T 117–121,T 2008.
51. S.T Bothorel,T BB.T Meunier,T S.T A.T Muller,T FuzzyT logicT
basedT approachT forT semilogicalT analysisT ofT
microcalcificationT inT mammographicT images.T IntT JT IntellT
System,T 12:819–848,T 1997.
52. AT.T Stavros,T D.T Thickman,T CL.Rapp,T MA.T Dennis,T SHT
Parker,T GAT Sisney.T SolidT breastT nodules:T useT ofT
sonographyT q1q`toT distinguishT betweenT benignT andT
malignantT lesions.T Radiology;T 196:123–134,T 1995.
53. YS.T Dong,T KST Han,T "AT comparisonT ofT severalT ensembleT
methodsT forT textT categorization,"T ServicesT Computing,T
(SCCT 2004).T Proceedings.T 2004T IEEET InternationalT
ConferenceT on,T pp.T 419-422,T 2004.T
54. Y.T Liu,T G.T Jaime,T Carbonell,T andT RongT Jin.T ECML,T
volumeT 2837T ofT LectureT NotesT inT ComputerT ScienceT
(Springer),T pp.T 277-288,T 2003.
55. Y.T Bi,T D.T Bell,T H.T Wang,T G.T Guo,T J.T Guan,T
CombiningT MultipleT ClassifiersT UsingT Dempster'sT RuleT ForT